A Flexible Framework for the Authoring of Reusable and Portable Learning Analytics Gadgets
Sven MANSKE1, Tobias HECKING1, Lars BOLLEN2, Tilman GÖHNERT1, Alfredo RAMOS1, H. Ulrich HOPPE1 1 2 University of Duisburg–Essen University of Twente Faculty of Engineering, Department of Instructional Technology Duisburg, Germany Enschede, The Netherlands {manske, hecking, goehnert, ramos,
[email protected] hoppe}@collide.info Abstract— Technology supported learning is nowadays often based on heterogeneous environments that encompass not only one application and also possibly involve different devices. This creates specific challenges for data analysis and thus for learning analytics. In this paper, we propose a framework to create reusable learning analytics components that are portable to different target platforms. In this approach, the logic of each analysis component is specified in a separate webbased visual environment (or "workbench") from where it is later exported to the target environments form of a gadgetbased dashboard. We demonstrate this mechanism in the context of the Go-Lab portal for accessing remote laboratories in STEM learning scenarios. An example shows how such analytics gadgets can be used to support collaboration inside the classroom. Learning Analytics; CSCL; Inquiry Learning
I.
INTRODUCTION
Heterogeneous learning environments involving a variety of applications more or less loosely connected to a learning platform are examples of complex modern information ecologies. The analysis of data from such environments is supported by open standards for capturing interaction or learning objects that provide the possibility to syndicate and link data. To further facilitate the flexible enrichment of such environments with analysis components, we propose a framework to create reusable analysis workflows supporting various types of visualizations. The portability will be ensured by the use of standard gadget platforms and formats, such as the OpenSocial1 standard for interoperability of web applications. The Go-Lab project is an example of a heterogeneous learning environment that supports blended learning scenarios in STEM fields (science, technology, engineering, mathematics). It serves as a platform for learning scientific inquiry by experimenting with various remote laboratories or simulations in complex and motivating scenarios. Students explore the big ideas of science by using a variety of tools in different inquiry phases and work together face-to-face in a 1
https://opensocial.atlassian.net/wiki/display/OSD/Specs, retrieved 31st of January, 2014.
classroom. The Go-Lab portal also serves as a platform for gadgets based on the OpenSocial specification. Thus we can embed analytics gadgets inside the system. A gadget is a small application to be embedded in a portal system or web page. This enables the composition of dashboards that support teachers and supervisors in monitoring or analyzing the learning processes. In our proposed system, an analytics workbench [1] is used to author gadgets that analyze learner activities based on action logs. No programming is needed, as the user interface of the workbench is based on a graphical specification of workflows following a pipes-and-filters metaphor. Workflows can be re-used and modified, and they can be ported to different target systems or different subsystems inside a platform in the form of analytics gadgets. Our approach supports the multi-stakeholder perspective of learning analytics, that has been pointed out frequently [2], [3], [4], [5]. However, there is a lack for technical solutions supporting students, teachers, researchers and policy makers. While guidance mechanisms usually target the individual learners, analytics support for policy makers may cause interventions for the next generation of students (e.g. as a result of curriculum revision). Monitoring the learning process in classrooms targets teachers and students immediately (e.g. in the form of learner scaffolds), but performing ex post analyses might help researchers to understand causalities retrospectively, which will improve learning on a larger scale. II.
RELATED WORK
The definition of learning analytics by Ferguson [6] highlights the origin and closeness to business intelligence systems. Business intelligence systems are often characterized through the clear separation of the end user system and the analytics platform. In our case, the end user systems are the connected learning portals, e.g. the Go-Lab portal, while the analytics platform contains the workbench for the creation of workflows and their visual gadget representation. The syndication of different gadgets in a single view or web page corresponds to the idea of analytics dashboards, to enable better informed decisions.
This idea of embedding learning analytics gadgets in the context of online-learning has been shown in [7]. There, two courses in vocational training in a learning system based on the Liferay portal have been compared. The output produced through the analytical methods was represented as a gadget in the portal. In comparison, the novelty in our approach is based on the flexibility in the choice of different target platforms supporting connectivity of standardized gadgets, e.g. following the OpenSocial specification. Since the rise of integrated personal learning environments, the syndication of social media and learning management systems becomes more important. Gadget platforms like OpenSocial, which plug into social networking platforms, are well suited for this purpose. Examples of collaborative learning systems using OpenSocial are ROLE [8] and Graasp [9]. Graasp serves as the basic platform for the Go-Lab portal [10], [11], which is covered in the case study in section V. III.
ANALYTICS WORKBENCH
The analytics workbench [1] has been mainly developed during the SiSOB project2. It offers an analysis framework that integrates a wide range of analysis tools and libraries with a user interface that also allows non computer experts to use the full power of the workbench. A. Architecture As a result of these requirements, the workbench combines a multi-agent system as computational backend with a web-based user interface that uses an explicit representation of analysis workflows. Analysis workflows are composed using a visual language based on a pipes-andfilters metaphor. In this language the modules (filters) of the language represent individual analysis steps and the connections (pipes) between the modules represent the data flow. See Figure 2 for an example of this workflow representation. Each of the modules of the virtual language corresponds to one agent in the multi-agent system used to process the analysis workflow. The workbench framework uses a SQLSpaces [12] server as communication platform. The SQLSpaces are an open-source implementation of the Tuple Space concept [13], which especially focuses on language heterogeneous multi-agent systems. The communication between the components of the system uses a simple tuplebased protocol, of which the two main elements are command tuples controlling the execution of a workflow and data tuples used for transferring data between the agents. A custom web server based on Node.js is used to provide the user interface and for connecting the user interface to the computational backend. It is also responsible for translating between the externalization format of the workflow representation used in the user interface and the command tuples used for controlling the workflow execution. Additionally it presents the results of the analysis processes to the users. 2
http://sisob.lcc.uma.es/, retrieved 31st of January, 2014.
Since all steps of the analysis processes are encapsulated in individual agents, the workbench's functionality can be extended easily by adding additional agents. This also holds for agents concerned with data input and output of workflow results. The only requirement for an agent is the connection with the SQLSpaces and the accompanying tuple-based communication protocol. Many of the available output agents are visualization components. Most of these consist of a Java agent connecting to the workbench framework, and a web technology based implementation of the visual metaphor for displaying the visualization in a web browser and for offering interactive data exploration. B. Data Exchange Formats and Standards The workbench uses its own internal formats to represent graph and data table information in each phase of the analysis. Both are based on a JSON structure with two main sections: metadata and data. The metadata section contains supplementary information to enrich the data that is available. For internal data flow and as an external exchange format, it supports widely used standards, e.g. Graph Modelling Language (GML) for graph data and comma separated value (CSV) files for data tables. Traces by learners are typically captured through event logging in platforms like the Go-Lab portal. For analyzing log data, the workbench supports the JSON-based Activity Streams format 3 , which is used by OpenSocial compliant platforms. Activity Streams follow an “actor - verb - object target” metaphor, which represents information about who did what with which object on which artifact. IV.
EXTENSIONS TO THE ANALYTICS WORKBENCH
In this section we present a short overview on the extensions added to the analytics workbench to support the automatic creation of learning analytics gadgets based on analysis workflows. A. Gadget Creation The process involving the user creating the workflow, which will be exported into a gadget, can be summarized through the following steps: - Create a workflow: This consists of connecting specific data sources, filters, converters, analytical methods and algorithms. Typically, the result is a visualization, e.g. a force-based graph layout highlighting centrality measures in an artifact network of a learning platform. - Create the gadget: After the creation of the workflow, a gadget can be exported. A templating engine creates the gadget file for the target platform, e.g. OpenSocial. The file is hosted on the workbench's web server and can be used through a link shown to the user. - Embed the gadget: Embedding the gadget through the created link depends on the target platform. Gadget containers like Apache Shindig provide the possibility to embed the gadget file directly through the link. This is the 3
http://activitystrea.ms, retrieved 9th of February, 2014.
common way for OpenSocial-based platforms like Graasp, which is the underlying system for the Go-Lab portal. B. Multi-Contextuality and Parameterization Besides the modification of the user interface controls for triggering the creation of a gadget, a more crucial change has been performed. Data sources are explicitly connected through filters in the workbench when creating a workflow. As we propose a flexible system for portable and reusable gadgets, we want to enforce multi-contextuality. As an example, consider a workflow merging concept maps and visualizing the aggregated graph. The data source might be all concept maps in the data warehouse or all concept maps from the context of the gadget, e.g. the learning space of the teacher in a portal. To achieve this, we introduced context variables (e.g. “$session.id”) to parameterize workflows on creation without knowing the values beforehand. These will be dynamically replaced by context parameters at runtime, i.e. when the gadget triggers the workflow execution. C. Backend Services Firstly, the modifications of the backend address gadget creation. Services for creating a gadget based on a specific analysis workflow involve a templating engine, which creates the concrete gadget file, and adding hosting services for deploying the gadget file. Secondly, to provide analytics as a service, we also added a web service interface that allows triggering the execution of workflows from outside the system. In our case, the analytics gadgets running in external portals need to execute their encapsulated workflows. Their external and parameterized representation will be rendered to a concrete JSON-based format and sent as a parameter to the web service interface. The response contains the necessary information for the gadget to display the result, i.e. the visualization output. This loose coupling of the analytics system and the displaying platform enforces the business intelligence metaphor of the system, while making it usable for non-experts in terms of analytics.
gadgets into their personal space, in order to compose a set of analysis tools that might help them to supervise the students. In the following we present a use case of the proposed system. The intention is not to introduce novel analysis algorithms, but to show the flexibility of the system to cover different areas of learning analytics, namely artifact and social network analysis. This will be demonstrated by an analysis of concept maps created by students. A. Analysing Individual and Aggregated Concept Maps Concept maps have been used as an instructional tool in inquiry based learning contexts that supports the students to structure and conceptualize their scientific knowledge by explicating concepts and their relations [14]. The Go-Lab platform provides a concept mapping tool that can be used by students. When students use this tool, their actions are continuously logged to the analytics server. Records of sequences of actions, namely adding, removing and labeling of concepts and relations allow reproducing the state of the concept map at any point in time on the server side. These records and reconstructed concept maps are a valuable source of data to gain insights on how the individuals structured their own knowledge, but also to assess the collective knowledge of the class for example by applying network analysis methods [15], [16]. One way to make statements about the knowledge state of the complete class is to build up aggregated concept maps. Formally a concept map can be seen as a multigraph with labeled nodes and edges. Building the union of such graphs means to overlay all individual concept maps. The result contains all concepts and relations between them that occur in at least one individual map. The opposite is to intersect the concept maps. The resulting multigraph only contains concepts and relations that occur in all individual concept maps. This operation can be used to analyze the mental models the students have in common.
D. Visual Framework When initialized, a gadget triggers the execution of its embedded workflow through the workbench’s web service interface, which results in the creation of visualization resources (consisting of HTML and JavaScript sources and the relevant analytics data). The gadget picks up the created resources, and injects them into its rendering context. With this approach, the analytics result visualization is created dynamically by triggering a workflow execution, instead of presenting static, pre-calculated results. Therefore, it is possible to refresh the results simply by repeating the analytics workflow execution on the workbench server and updating the results visualization. This way, even with complex and time consuming calculation processes, it is possible to take into account recent learner activities V.
CASE STUDY: GO-LAB
In the context of the Go-Lab platform teachers embed predefined analysis workflows in the form of OpenSocial
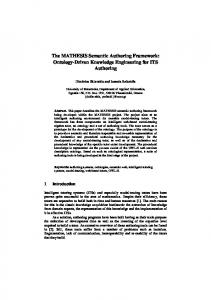
Figure 1. Network derived by aggregating individual concept maps. Node size corresponds to betweenness centrality.
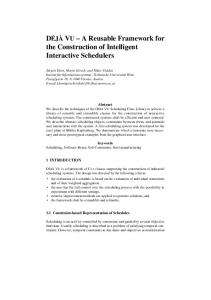
The number of occurrences of a concept or a relation in the set of individual maps can also be counted and stored as a node attribute in the aggregated concept map as a measure of consensus. In addition centrality measures known from social network analysis like degree, betweenness, closeness, and eigenvector centrality [17], among others, can be calculated on concept maps to get additional concept weighting parameters [15], [16]. The outcome of this process is a visualization of the aggregated graph as depicted in Figure 1. The viewer can choose whether the size of the nodes should correspond to the number of occurrences in the individual concept map or the centrality of the concept. The described analysis comprises several steps depicted in the workflow in Figure 2. The process starts with data acquisition and filtering. The concept maps for a particular session are retrieved from the data warehouse as a sequence of graphs by the artifact import filter. When the workflow is intended to become externalized as a gadget, it is also possible to add a dynamic session variable, which depends on the gadget's runtime context, as described in section IV.B. The next step is to aggregate the individual concept maps by performing the union or the intersection operation as described above. One can reuse the Graph Aggregator component, which has been designed to aggregate graphs of various types. The centrality calculation is also implemented as a single independent component. This filter retrieves the aggregated concept map from the previous filter and calculates various centrality measures based on its parameterization. At the end of the workflow an adequate visualization is needed. The Dwyer force directed graph visualization technique [18] is an appropriate choice because it arranges the more densely connected concept nodes close to each other on the screen, which supports the visual interpretation of the results. The interpretation of the results is dedicated to the teacher, however, the assembly of the particular steps to a complex analysis workflow requires some expert knowledge. For this purpose an analyst can compose a complex analysis from single building blocks using the workbench user interface as an authoring environment and provide a generated gadget to the teacher. Once the workflow has been constructed its internal representation can be stored and reused to execute the process several times without consulting the user interface again, see section IV. With the export to Open Social gadgets the predefined workflow can be embedded and executed from any gadget container like ROLE or Graasp. The gadget itself only displays the visual results while hiding the complexity of the analysis workflow behind. B. Comparing a Concept Map with a Reference Map One common task in the analysis of concept maps is the comparison of student created maps with a reference map. A reference map can be a concept map created by an expert [19] or a domain ontology [16]. For this task it is possible to reuse most of the filters of the workflow in section V.A only the Centrality filter has to be replaced with the Graph Comparison filter.
Figure 2. Centrality calculation of aggregated concept maps as a pipes-andfilters workflow.
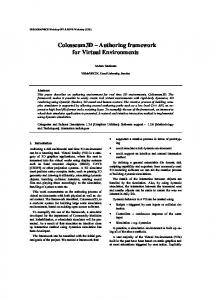
This filter takes two graphs as input. Similar to the previously described Graph Aggregator it performs a union operation on the two input graphs. Unlike the Graph Aggregator it can only handle two input graphs. It checks which relations between concepts occur exclusively in one of the two input graphs and which relations can be observed in both graphs, in this case concept maps. The output of this filter is an aggregated graph with edges decorated with an attribute, which indicates whether the edge exists only in graph 1, only in graph 2 or in both graphs. These attributes are used by the visualization component to color the edges accordingly. A characteristic output of the workflow is depicted in Figure 3. As in the example described in A, the visual results of the comparison of the collective concept map and a reference map can be very useful for a teacher to uncover potential shortcomings in the knowledge state of the class. He can react on the analysis results, e.g. by rearranging working groups. Analysts author those gadgets, while the stakeholders or users of the analysis, in this case a teacher, see only the product as an expressive visualization that he/she can understand and interpret.
Figure 3. Comparison of two concept maps. Edges occurring only in the expert map are colored green. Edges occurring in student maps exclusively are blue and brown connections are drawn by students and the experts.
VI.
CONCLUSION AND OUTLOOK
In the current version, data is gathered in a central repository, acting as a data warehouse in a custom analytics platform. This consists of facilities to capture user actions from within connected learning platforms, particularly the Go-Lab portal. It also integrates this infrastructure into components as the analytics workbench. Such a central repository also harbors the risk of exposure of sensitive data, e.g. learners’ traces that can be used to identify a single individual. This is the case if a filter provides the possibility to return parts of the raw input data. Data anonymization, as in the Go-Lab case, could solve this problem partially combined with origin control for querying the data. If the communication is exclusively channeled through the portal systems, identity on the portal side and also anonymity on the analytics side can be guaranteed. A whitelist to control the web service calls to the analytics workbench can provide that a gadget cannot get the information about how the anonymization works. To authenticate or grant access permissions to the creator through the workbench itself is not a sufficient solution - the creator of the gadget is not the one executing it, which highly depends on the context. In this case authentication and authorization is not a trivial challenge as this is handled differently for every gadget system. More general solutions such as OAuth could provide a mechanism to incorporate rights and access management of external gadget systems like OpenSocial. The presented framework system provides lots of possibilities to embed applications of learning analytics into portal systems to support different stakeholders. The case study exemplarily shows the possibilities of such open and flexible system. Extending templates with little programming efforts for targeting more platforms and adding filters and data converters to the workbench will even push the boundaries. Besides the obvious stakeholders of learning analytics, namely students and teachers, it gives researchers, institutions and authorities the opportunity to explore (their) real datasets, conduct analyses with the means of conserving the freedom of decision. By feeding external data sources into the system, it is possible to build comprehensive recommendation engines, which is valuable in the context of the Go-Lab project, where resource or peer recommendations positively influence both learning and teaching in inquiry-based learning scenarios around a federation of online laboratories. ACKNOWLEDGMENT The Go-Lab project is partially funded by the European Union (Grant Agreement no. 317601) under the Information and Communication Technologies (ICT) theme of the 7th Framework Programme for R&D (FP7). This document does not represent the opinion of the European Union, and the European Union is not responsible for any use that might be made of its content.
REFERENCES [1] T. Göhnert, A. Harrer, T. Hecking and H. U. Hoppe, "A Workbench to Construct and Re-use Network Analysis Workflows: Concept, Implementation, and Example Case," in Proceedings of the 2013 IEEE/ACM International Conference on Advances in Social Networks Analysis and Mining, New York, NY, USA, 2013. [2] D. Clow, "The Learning Analytics Cycle: Closing the Loop Effectively," in Proceedings of the 2Nd International Conference on Learning Analytics and Knowledge, New York, NY, USA, 2012. [3] H. Drachsler and W. Greller, "The Pulse of Learning Analytics Understandings and Expectations from the Stakeholders," in Proceedings of the 2Nd International Conference on Learning Analytics and Knowledge, New York, NY, USA, 2012. [4] G. Siemens, "Learning Analytics: Envisioning a Research Discipline and a Domain of Practice," in Proceedings of the 2Nd International Conference on Learning Analytics and Knowledge, New York, NY, USA, 2012. [5] D. Suthers and K. Verbert, "Learning Analytics As a "Middle Space"," in Proceedings of the Third International Conference on Learning Analytics and Knowledge, New York, NY, USA, 2013. [6] R. Ferguson, "Learning Analytics: Drivers, Developments and Challenges," Int. J. Technol. Enhanc. Learn., vol. 4, no. 5/6, 2012. [7] N. Malzahn, T. Ganster, N. Sträfling, N. Krämer and H. Hoppe, "Motivating Students or Teachers?," in 8th European Conference on Technology Enhanced Learning, EC-TEL 2013, Pahos, 2013. [8] S. Govaerts, K. Verbert, D. Dahrendorf and others, "Towards Responsive Open Learning Environments: The ROLE Interoperability Framework," in 6th European Conference of Technology Enhanced Learning, Palermo, 2011. [9] E. Bogdanov, F. Limpens, N. Li, S. El Helou, C. Salzmann and D. Gillet, "A social media platform in higher education," in Global Engineering Education Conference, 2012 IEEE, 2012. [10] S. Govaerts, Y. Cao, A. Vozniuk, A. Holzer, D. G. Zutin, E. S. C. Ruiz, L. Bollen, S. Manske, N. Faltin, C. Salzmann and others, "Towards an Online Lab Portal for Inquiry-Based STEM Learning at School," in Advances in Web-Based Learning, Springer, 2013. [11] D. Gillet, T. de Jong, S. Sotirou and C. Salzmann, "Personalised learning spaces and federated online labs for STEM Education at School," in Global Engineering Education Conference, IEEE, 2013. [12] S. Weinbrenner, "SQLSpaces: a platform for flexible language heterogeneous multi-agent systems," Hut, München, 2012. [13] D. Gelernter, "Generative Communication in Linda," ACM Trans. Program. Lang. Syst., vol. 7, no. 1, 1985. [14] T. Stoddart, R. Abrams, E. Gasper and D. Canaday, "Concept maps as assessment in science inquiry learning - a report of methodology," International Journal of Science Education, vol. 22, no. 12, 2000. [15] R. Clariana, T. Engelmann and W. Yu, "Using centrality of concept maps as a measure of problem space states in computer-supported collaborative problem solving," Educational Technology Research and Development, vol. 61, no. 3, 2013. [16] H. U. Hoppe, J. Engler and S. Weinbrenner, "The Impact of Structural Characteristics of Concept Maps on Automatic Quality Measurement," in Proceedings of the 10th International Conference of the Learning Sciences, Sydney, Australia, 2012. [17] S. Wasserman, Social network analysis: Methods and applications, vol. 8, Cambridge university press, 1994. [18] T. Dwyer, "Scalable, versatile and simple constrained graph layout," in Proceedings of the 11th Eurographics / IEEE - VGTC conference on Visualization, Aire-la-Ville, Switzerland, 2009. [19] T. Conlon, "'Please Argue, I Could Be Wrong': a Reasonable Fallible Analyser for Student Concept Maps," in Proceedings of World Conf. on Ed. Multimedia, Hypermedia and Telecomm., Lugano, 2004.