Dec 9, 2011 - words and a small set of closed class of keywords (e.g. ratings such as ... results in extracting table token sequences can be applied ... Table I, for example, can be parsed in the following way: (a) .... task that results in correctly filled templates. ..... category include the number of blank lines in the table or.
A Flexible Table Parsing Approach Frank Schilder, Ravi Kondadadi, and Yana Kadiyska
It is important to note that this table parsing approach that results in extracting table token sequences can be applied also to other types of tables. Other tables may have different anchors and token types, but the parsing strategy will be the same. Drug dosage tables, for example, contain information about dosages depending on age or weight of the patient. Table I, for example, can be parsed in the following way: (a) determine the anchors in this table (i.e., numbers), (b) iterate over all the cells in a row that contain anchor cells (e.g. 0.8, 1.2, 1.6) and collect cells to the left that are not anchors, (c) go up the same column for a respective anchor cell and associate the header cell with the anchor, and (d) go to the right and collect all remaining cells not yet collected. if we start, for example with 1.2 in the second row and the third column, we collect Infant Drops 7.5mg./0.8 ml, 27-35, ml as table token sequence. The remaining tokens Child’s weight (pounds) and lbs are type cells describing the type (or unit) and need to be linked to the respective column and row. For this table they both apply to the top row. This linking requires domain knowledge and is the final step in the table parsing process. For our experiments, we used tables containing financial information where bid/ask prices are the anchor cells. The tables were often copied from spreadsheets into the body of an email and the the formatting was not always maintained The following figure 1, for example, contains a specific format for the bid/ask price, it contains bonds consisting of security name, coupon, maturity date and is slightly misaligned with the headings. The first instrument in this table is specified as HXN- 9.5-14 40.000-41.000: Given the specified task, the parser needs to extract all instruments specified by the respective token sequence in the table. The task can also be described as “table flattening” because the two dimensional structure of the table needs to be understood in order to end up with a sequence of tokens and a price. We divide all tokens in a table into two categories. A token is either a data cell or a authority cell (or authority header). Data cells are prices and authority cells/headers are everything else (e.g. coupon, maturity date, contract term). The distinguishing factor between a data cell and an authority cell/header is based on the question of whether the cell can have scope over another cell. The following table, for example, contains contract terms that take scope over the row of prices. Here, the contract terms (i.e. 3yr and 4yr) are authority headers because their scope is vertical. Authority cells, on the other hand, carry horizontal scope, such as the company names ABC and EDF in the following example:
Abstract—Relational data is often encoded in tables. Tables are easy to read by humans, but difficult to interpret automatically. In cases where table layout cues are not obtainable (missing HTML tags) or where columns are distorted (by copying from a spreadsheet to text) previous table extraction approaches run into problems. This paper introduces a novel table parsing approach. Our approach is based on a set of simple assumptions: (a) every table can be split up in data cells and headers, and (b) every table can be parsed beginning from a data cell utilizing the overall table structure. The table parsing is defined as “table flattening” in this paper. That is, the parsing starts with a data cell and pulls out all token (i.e., headers and sub-headers) associated with a respective data cell. We propose a parsing technique that uses two simple parsing heuristics: table headers are to the left of and above a data cell. We experimented with trader emails that contained instrument information with bid-ask prices as data cells. We developed a clustering and classifying method for finding prices reliably in the data set we used. This method is transferable to other data cell types and can be applied to other table content. Index Terms—Information retrieval, document processing, tables.
I. I NTRODUCTION
T
HIS paper proposes a flexible table parsing approach that can be applied to a majority of table types. In our work we applied the approach to financial tables containing information on various instruments (e.g., bonds, loans). Extracting information from tables has been shown to be notoriously difficult in particular when they occur in plain text (e.g., email) where columns can be easily misaligned after copying them from another document such as a spread sheet. The task we define in this paper is called table token sequencing and requires to (a) find all anchor cells (i.e., bid/ask prices) in the table and (b) determine the tokens in the table that are associated with the respective bid/ask price. The anchor cells are domain-specific and in our case we need to make sure bid-ask prices are found and extracted reliably. We also propose a clustering and classifying approach for finding bid-ask prices in this paper. Except for the anchor of each sequence given by the bid/ask price, we are mostly agnostic with respect to the other token types. We assume general types such as numbers, capitalized words and a small set of closed class of keywords (e.g. ratings such as AAA). Manuscript received on October 31, 2011, accepted for publication on December 9, 2011. Frank Schilder and Ravi Kondadadi are with Thomson Reuters Corporate R&D and Yana Kadiyska is with Thomson Reuters Fixed Income, USA (e-mail:{frank.schilder, ravikumar.kondadadi, yana.kadiyska} @thomsonreuters.com).
ISSN 1870-9044; pp. 13–19
13
Polibits (45) 2012
Frank Schilder, Ravi Kondadadi, Yana Kadiyska
TABLE I A MEDICAL TABLE CONTAINING DRUG DOSAGE INFORMATION Child’s weight (pounds) Infant Drops 7.5 mg./0.8 ml Liquid 15mg/5ml (tsp) Chewable 15 mg. Tablets 30 mg. Tablet 60 mg.
18-26 0.8 1/ 2 – – –
27-35 1.2 3/ 4 – – –
36-53 1.6 1 1 – –
54-71 – 11/2 11/2 – –
72-139 – 2 2 1 –
140+ – – 4 2 1
lbs ml tsp tablets tablets tablet
Bid Ask Bid Ask Bid Security Px Px YTW YTW ZSPR ZSPR Notes Notes2 ----------------------------------------------------------------------HXN 9.5 14 40.000-41.000 34.994/34.198 3244/3164 HXN 0 14 34.000-35.000 30.389/29.639 2938/2863 HXN 7.5 23 24.000-25.000 34.130/32.910 3132/3007 MOMENT 9.7 14 34.000-35.000 40.260/39.262 3773/3672 B 4MM Fig. 1. A misaligned table containing financial information
mostly avoids the table segmentation task and only requires the identification of the data cells. Because of restricting our approach to a simpler task, early errors in the processing pipeline are avoided. We need to make sure that the extraction of data cell has high accuracy though. More recent work presented in [4], for example, addressed the task of classifying label rows and data rows in ASCII documents using a machine learning approach (i.e., Conditional Random Fields (CRF)). One of the difficulties in a supervised learning approach is how to obtain accurately and reliably annotated data. Work from MITRE [5] specifically created a platform to streamline such annotation effort. Still, a lot of effort needs to go into the annotation of tables in order to cover a large enough representative sample of the entire data set. In addition, a disadvantage of a general supervised machine learning approach is that it will optimize on the most-frequent table structures and treat infrequent tables that are still well-formed as noise. In contrast to a supervised ML approach, we rely on clustering cells in each individual table and train a classifier for each table on the fly and hence do not require any annotated training data. This classifier identifies cells based on the table context and avoids the pitfalls producing a model based on the most frequent table structures. Because a lot of useful information are represented in tables in HTML documents, there have been a lot of effort in extracting information from Web documents, known as wrappers. Many efforts are based on manual created rules. More advanced approaches used machine learning techniques [6]. The major problem with wrapper-based approach for information extraction is that those wrappers are not robust across different sites and slight modifications to existing pages might invalidate working wrappers. [7] explored an approach that used the rendering information from a web browser. The approach is not limited to HTML table tag, but requires some sort of table representation in order to produce the spatial information it derives the information from. Because of
3yr 4yr ABC 23/24 25/27 EDF 26/28 30/32 The four instruments extracted from this simple table are ABC-3yr-23/24, ABC-4yr-25/27, EDF-3yr-26/28, and EDF-4yr-30/32. Note that the authority headers may not always be perfectly align with the columns, as in this example, but our approach is still able to extract the correct token sequences. The focus of our work is to provide a table parsing approach that derives all single data cells and their associated authority cells/headers. The output is token sequences of cells and headers. Since our table parsing approach is mainly domain agnostic, further processing can be carried out on these sequences and can factor in further domain-specific reasoning. The main contributions of this paper: 1) A new approach to table parsing that relies on the distinction between table data cells and headers and is capable of detecting even misaligned table structures. 2) Learning data cells (here: prices) on the fly by clustering and learning a classifier for a specific table. 3) Providing a confidence metric for the table parsing II. R ELATED W ORK Many researchers have studied the problem of extracting information from tables. [1] provides a good overview of the field. Table extraction tasks can be divided into different categories. First, there is the table segmentation task that requires to correctly determine type of table rows, identify columns and data cells. Second, there is the table interpretation task that is more complicated and is an information extraction task that results in correctly filled templates. Earlier work focused on tables scanned in from documents where ASCII text was produced with the help of OCR programs [2], [3]. In the past, heuristics were employed to solve the table segmentation task, i.e., determining which word belong to which column, and similarly for rows. Our approach
Polibits (45) 2012
14
ISSN 1870-9044
A Flexible Table Parsing Approach
domain independence, the accuracy reaches only about 50% for the table interpretation task, but higher results for the table segmentation task (precision:68, recall: 81). This approach fails if no table structure representation is supplied and will run into problems if misaligned table columns are part of the table.
Prices are often easily identifiable as NUMBER SEP NUMBER, where SEP can be - or /, as in 23-26. However, there are also cases where there are no separators or where the price actually describes a different token sequences such as a date or a version number, as in 3/10 or 07-10. In order to increase recall and weed out false positives, we developed a “cluster and classify” approach described in the following section. 2) Clustering and classifying prices: Another approach to detecting prices was based on an approach that used clustering and self-training on the derived clusters. The clustering was based on the following observation. The Ask price is always higher than the Bid price. Hence the ratio of the Bid price divided by the Ask price has be greater than 1. Moreover, the difference between the two prices is never very large. As a rule of thumb we assume that the Ask price is never more than twice as big as the Bid price.
III. TABLE PARSING We propose a new technique to table parsing where the goal is to determine the data cells and the headings that refer to the respective data cell. Our approach is motivated by the observation that every table has a set of data cells of the same types and that headings referring to one cell are mostly to the left and above this cell. Most importantly, we do not assume a perfectly aligned table structure. Tables where cells in a row have shifted when copied from medium to another (e.g., spreadsheet to email editor) maintain the constraints of having the headings to the left and somewhere above. Since we do not rely on the spatial structure of the tables (e.g., column separation), we are able to parse even very misaligned tables Our new approach is based on the following heuristics: 1) Detect data cells with high accuracy (here: bid/ask prices). 2) Utilizing table structure by parsing the text left to each data cell and the rows above for detecting header cells (go left and up) 3) Link all remaining tokens to the right of a data cell to that data cell (these are often notes or secondary information) 4) Collect all tokens associated with each cell and therefore flatten the table
1) Compute the ratio between two consecutive numbers N1 and N2: BidAskRatio = N2/N1 2) Assign the following clusters: a) If 1 < BidAskRatio < 2, then N1= -1 and N2 = 1 b) Else: N1,N2=0 Note that the assignment is based on consecutive number tuples in an email. It is therefore possible that number assignments are overwritten because two tuples fulfill the cluster assignment as in Ford 8 10 13 14. The tuples 8-10, 10-13, as well as 13-14 fulfill the condition for assigning -1 and 1 for the first and the second number, respectively. Given the assignment procedure defined above, the numbers are assigned to the following clusters: 8(-1), 10(-1), 13(-1), 14(1). Even though the numbers 8 and 10 which are coupon and maturity date in this made-up example are wrongly assigned as bid prices, the overall structure of the table will be used to weed them out of the pool of bid/ask prices. Given the assignment of a cluster to each number in an email, a feature vector can be created for each number. These vectors are then used to generate a multi-class classifier via an SVM. We used the WEKA package for training this classifier and also normalized the data set [8]. That means that the actual training set contains approximately the same number of 0, -1, and 1 instances. After training, the classifier is run over the training set again. Using the following feature set, the classifier is able to detect the prices that are within the most frequent context for this given table:
A. Finding header and data cells In our chosen domain, data cells are bid/ask prices, header cells can be percent, maturity dates, company names or specific identifiers (i.e., facilities). As a first step, tokenization ensures that the basic tokens used in a table are identified. We developed a specific ANTLR grammar that distinguish between basic types such numbers, words, special keywords.1 Another ANTLR grammar identified prices and computed their bid and ask price values. 1) Parsing tokens and prices: We developed a tokenizer grammar that detects simple token types that are frequent in trader emails. For example, Words starting with an upper-case letter are identified as follows:
– – – –
current_tok current token type (e.g., UPPER) prev_tok previous token type next_tok next token type prev_prev_tok type of the token previous to the previous token – next_next_tok type of the next token to the next token – pos nth token in a line – char_pos character position of the middle of the token
UPPER : (INT? ’A’..’Z’ (’A’..’Z’|’a’..’z’|INT)*); All number tokens are translated into decimals since we use this number values for various feature when classifying them as prices or coupons. 1 ANTLR is a parser generator based on LL∗ parsing technology. ANTLR grammars are written in EBNF and can be translated into many different programming languages including Java code.
ISSN 1870-9044
15
Polibits (45) 2012
Frank Schilder, Ravi Kondadadi, Yana Kadiyska
Note that the training and testing on the same email has certain advantages over training over an annotated data set of emails used for supervised learning. If we train over such a large data set, as we did in a preliminary study, feature weights are derived via the frequency in the overall data set. The peculiarities of a certain table are not taken into account, even though for a given email the position of the price and the context may be perfectly understandable following a pattern not often seen in the training data. After determining the bid/ask prices and tokenizing and labeling the tokens according to some general types, the token sequences can be derived via the parsing strategy of going left and up described in the following.
the information from the previous instrument is not carried over. C. Go right Occasionally, there are unassigned cells to the right of the anchor cells. In a last step, these cells are collected and added to the right-most anchor cell. In Figure 1, the spread information and additional notes are added to the respective anchor cell (e.g., 40.260/39.262 3773/3672 B 4MM are added to MOMENT 9.7 14 34.000-35.000) After all tokens have been parsed and the authority cells have been applied to all instruments, we can go up the table and associate other sequences or data headers with a token sequence.
B. Go left D. Go up
Most authority cells and headers are to the left of a data cell in tables. If we start with the first data cell (i.e., bid/ask price), we go to the left of this token and collect non-price tokens as associated to this particular data cell. A new token can be added to the sequence only if it had not been associated to another cell. This parsing strategy can also be described by head-driven parsing approach such as Lexical Functional Grammar (LFG) [9] or Head-Driven Phrase Structure Grammar (HPSG) [10]. Both linguistic approaches combine syntactic and other constraints in one grammar formalism. In LFG, the c-structure is derived by syntactic grammar rules. In addition, semantic information — the so-called s-structure — can further constrain the c-structure. For the table parsing, we assume a simple context-free grammar that parses tokens per line
There are two cases for finding further tokens for a token sequence above the line where the data cell is in. First, it is possible to find a longer token sequence in an earlier line. For example, the name of the instrument is only mentioned in the first line including coupon and maturity date. All subsequent lines omit the name, but have different coupons and maturity dates. Ford
In order to add further authority cells to sequences, we defined a signature for each sequence. The first line in the above example has the following signature: [U P P ER, N U M BER, N U M BER]. The second line, on the other hand, has the signature [N U M BER, N U M BER]. If we find another sequence above that has a super-signature, the missing tokens (here: Ford) are added to the instrument below. Second, there are authority headers in header lines. Header lines are defined as lines without any prices. Those authority headers can be of two types: (a) the tokens can be token types such as coupon or (b) the authority headers are additional tokens that are added to the token sequence (e.g., 5yr indicating the contract term). In order to match these authority headers to the token sequences, we utilize the Hungarian Algorithm [11]. This combinatorial optimization method is used for assignment problems. For our purposes, we need to define a n × n matrix consisting of the instruments in a line and the authority cells in a line above. For the Hungarian method, the instruments in one line and the authority cells in a line above are represented in form of a a complete bipartite graph G = (S, T ; E) where s ∈ S instruments need to be matched to t ∈ T authority cells in the line above. For each link between all vertices, a non-negative cost c(s, t) is defined. We define the cost by the distance between the beginning of the price information of the instrument and the authority header. The cost matrix for the following example table is transformed by subtracting the
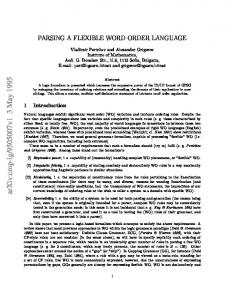
LINE --> INSTRUMENT* NL INSTRUMENT --> TOKEN* PRICE Since the goal of the table parsing is the derivation of token sequences per price, another structure is derived via the parsing. This table signature structure (ts-structure) is added as further constraint onto the c-structure. INSTRUMENT([Price(Value)]) --> PRICE INSTRUMENT([TokenType(Value) | Rest]) --> TOKEN INSTRUMENT(REST) After parsing the first instrument, a so-called signature is derived, that constrains the subsequent instruments and completes them, if necessary. Figure 2 shows the derivation for the line ABC 23/24 25/27. The first INSTRUMENT is derived up to the first PRICE. The signature derived is the list [U P P ER(ABC)]. This signature is then used to constrain the subsequent instruments in this line. In this case, the company name ABC is added to the next price. The constraints invoked on the instruments in the line can be of different types. If the signature of the next instrument is a sub-sequence, further authority cells are added, as in the example line. If the signatures do not match, on the other hand,
Polibits (45) 2012
3.4 12 13-14 4.5 13 20-21
16
ISSN 1870-9044
A Flexible Table Parsing Approach
LINE[U P P ER(ABC)]
INSTRUMENT[U P P ER(ABC)]
INSTRUMENT[U P P ER(ABC)] TOKEN
PRICE
TOKEN
PRICE
ABC
23/24
ABC
25/27
Fig. 2. A simple table parse tree
lowest number in each row and column from all the cells in the same row and column. Then the matching is indicated by the 0 in each row and column for this simple example.2
The other set of features in our confidence metric is related to the system’s performance on the input. Features in this category include the number of prices that are also dates or the ratio of numbers to prices in the email.
3yr 4yr ABC 23/24 25/27 EDF 26/28 30/32
B. Gaining confidence We developed a binary classifier to classify between complex and simple input texts according to our system. This will let the user of our output decide whether to use it not. We had a training set of 202 emails where the instruments were identified. We used a threshold on the F-score of our system on those emails to create training data for our classifier. We experimented with different thresholds on the F-score and found that 0.7 works the best. With this threshold, we had around 130 positive examples and 72 negative examples for the classifier. We used an SVM to build the classification model. We tested the model on the same data using 10-fold cross validation. The accuracy of the classifier was 85.8. The precision and recall of the positive class were 89.8 and 91 respectively.
Cost metric:! 5 1 14 10 1) Reduce the rows by subtracting the minimum value of each row from that row. 2) Reduce the columns by subtracting the minimum value of each column from that column. 3) Select a matching by choosing a set of zeros so that each row!or column has only one selected: 0 4 4 0 IV. C ONFIDENCE METRIC As our approach is mostly used as a part of a table extraction workflow, it is very important that we provide a confidence score to identify tables we can derive information from with high confidence. This main workflow can thus avoid processing complex tables. The Confidence measure is defined as a number between 0 and 1 indicating how confident we are about the correctness of the output instruments. Given a confidence metric we are able to identify a subset of the test set where we can extract instrument token sequences with high accuracy (i.e. > 90 precision/recall).
The evaluation we carried out had two phases. First, we needed to show that the table flattening achieves high precision and recall. Secondly, we used the table flattening in the table extraction workflow that produces instrument templates used to populate a data base of instruments and their bid/ask prices.
A. Feature set
We obtained 202 emails of various length and annotated the token sequences for each price found in the emails. In addition, we annotated the tokens by token type, as in the following example:
V. E VALUATION
A. Data
The most important factor in the confidence estimation is the complexity of the input itself. For example, our system performs better with tables that have only one level of sub-headers compared to nested tables. Features in this category include the number of blank lines in the table or the number of lines where the number of token signatures is not same as the one from line above. 2 There
1238023.txt GS 4.5 06/10 185/175 1238023.txt NAME CPN MAT PRICE The token sequence task requires to check whether these tokens from the first line are part of the tokens derived from the table parsing process. The instrument slot filing part also checks for the correct slots to be filled. In this example, the
are more steps to consider for a more complex example
ISSN 1870-9044
17
Polibits (45) 2012
Frank Schilder, Ravi Kondadadi, Yana Kadiyska
TABLE II R ESULTS FOR ( A ) TABLE SEQUENCE TASK ( B )
TABLE SEQUENCE TASK WITH CONFIDENCE METRIC
Precision
Recall
F-Value
0.84 0.34
0.85 0.36
0.85 0.32
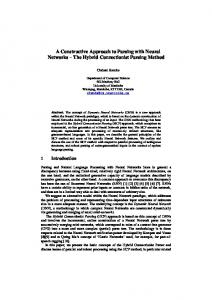
Evaluation of different automatically generated tables ●
0.89 0.33
0.89 0.33
0.7
0.86 0.34
●
● ●
0.6
0.85 0.34
●
0.5
0.81 0.38 F-Value
F−Score
0.81 0.37 Recall
0.3
0.81 0.39 Precision most confident top 60% Table Parsing 0.88 Baseline 0.34 most confident top 75% Table Parsing 0.90 Baseline 0.33
Description No randomization A B C A+B+C
0.4
micro-averaged Table Parsing Baseline macro-averaged Table Parsing Baseline
1 2 3 4 5
Approaches
instrument name, the coupon, maturity date and the price have to be placed into the respective slot. In addition to the original emails, we also generated randomly distorted tables from the gold data token sequences in order to show the robustness of our approach. Section
0.2
baseline ●
1
table parsing
2
3
4
5
Table Combinations (see table) (increasing complexity)
TABLE III R ANDOMLY
GENERATED TABLE COMPLEXITY
B. Results We carried out three evaluations. The first one was concerned with matching the token sequences via the table flattening resulting from our table parsing technique. The second evaluation investigated whether the confidence score could improve the overall precision and recall values for a subset of the emails from the test set where we computed high confidence. Finally, we tried to incorporate the table flattening into the email parsing workflow and derive templates for instruments. this last task is the most challenging task, but we can show that using the table flattening that the performance improves overall. The table flattening module pulls out token sequences that were compared against a token sequence gold data file. A parsed token sequence was correct if it covered the same token (and possibly more tokens) from the gold data. Table II (a) summarizes the results from our experiments comparing the Table Parsing approach with a Baseline approach. The baseline uses the same price tagging and only takes the tokens to the left of a price. In order to boost performance we utilized the confidence metric and excluded a certain percentage of the test set based on the confidence score. Table II (b) indicates two different cup-off levels where the overall performance significantly improved when only a certain percentage of emails were tested. In a final experiment, we automatically generated tables of varying complexity from a quote database. Each record in the database corresponds to a quote sequence with all the fields associated with that quote. Each record also has an indication of the source of the record. We grouped records by source and generated a table corresponding to each source. The most important field in a quote sequence is the company name. A
Polibits (45) 2012
company can have more than one quotes in the same source. So within each source, we grouped the records by company name. We introduced randomness in the following aspects of the table generation: A
B C
We always generate the company name for the first instrument (e.g., Ford 6 15 30-32), but instruments in subsequent lines that are of the same type do not need to have this authority cell in order to be correctly understood. A line in the table can have more than one sequence The company name can appear to the left of the quote sequence or at the top.
We generated tables of different complexity using different combinations of the above mentioned features.
VI. C ONCLUSIONS We presented a table parsing approach that is based on a heuristics of detecting anchor cells (i.e., bid/ask price) and derives token sequences represented in the table. The proposed approach does not required any training data and is unsupervised regarding the clustering and classification of the so-called anchor cells. Even though we focus on financial data, the approach can be easily adapted to other domains. Moreover, the approach does not rely on the spatial information encoded in HTML tags and shows a robust performance when tested on tables where noise in form of misalignment is introduced.
18
ISSN 1870-9044
A Flexible Table Parsing Approach
ACKNOWLEDGMENT The authors would like to thank Khalid Al-Kofahi, VP Research, Thomson Reuters and Ted Healey, Global Head of Web Development, Thomson Reuters for supporting this work. We also would like to thank the anonymous reviewers for their valuable suggestions. R EFERENCES [1] R. Zanibbi, D. Blostein, and J. Cordy, “A survey of table recognition: Models, observations, transformations, and inferences,” Int’l J. Document Analysis and Recognition, vol. 7, no. 1, 2004. [2] M. Hurst and S. Douglas, “Layout and language: Preliminary investigations in recognizing the structure of tables,” in Proc. of Int’l Conf. of Document Analysis and Recognition, 1997. [3] P. Pyreddy and W. B. Croft, “Tintin: A system for retrieval in text tables,” in Proc. of Int’l Conf. of Digital Libraries, 1997. [4] D. Pinto, A. McCallun, X. Wei, and B. Croft, “Table extraction using conditional random fields,” in Proc. of SIGIR, Toronto, 2003. [5] M. Vilain, J. Gibson, B. Wellner, and R. Quimby, “Table classification: An application of machine learning to web-hosted financial documents,” MITRE, Technical Report, 2006. [6] W. Cohen, M. Hurst, and L. Jensen, “A flexible learning system for wrapping tables and lists in HTML documents,” in Proc. of WWW, 2002. [7] W. Gatterbauer, P. Bohunsky, M. Herzog, B. Kr¨upl, and B. Pollak, “Towards domain-independent information extraction from web tables,” in Proceedings of the 16th International World Wide Web Conference (WWW 2007). ACM Press, May 8–12, 2007, pp. 71–80. [Online]. Available: http://www2007.org/paper790.php [8] J. Platt, “Fast training of support vector machines using sequential minimal optimization,” in Advances in Kernel Methods - Support Vector Learning, B. Schoelkopf, C. Burges, and A. Smola, Eds. MIT Press, 1998. [Online]. Available: http://research.microsoft.com/\∼jplatt/ smo.html [9] R. M. Kaplan and J. Bresnan, “Lexical-functional grammar: A formal system for grammatical representation,” in The Mental Representation of Grammatical Relations, J. Bresnan, Ed. Cambridge, MA: MIT Press, 1982, pp. 173–281. [10] C. Pollard and I. A. Sag, Head-Driven Phrase Structure Grammar. Chicago: University of Chicago Press, 1994. [11] H. W. Kuhn, “The Hungarian Method for the Assignment Problem,” in 50 Years of Integer Programming 1958-2008, M. J¨unger, T. M. Liebling, D. Naddef, G. L. Nemhauser, W. R. Pulleyblank, G. Reinelt, G. Rinaldi, and L. A. Wolsey, Eds. Springer Berlin Heidelberg, 2010, pp. 29–47. [Online]. Available: http://dx.doi.org/10.1007/978-3-540-68279-0\ 2
ISSN 1870-9044
19
Polibits (45) 2012