Available online at www.sciencedirect.com
ScienceDirect Procedia Computer Science 93 (2016) 824 – 831
6th International Conference on Advances in Computing & Communications, ICACC 2016, 6-8 September 2016, Cochin, India
A Framework for Fast and Efficient Cyber Security Network Intrusion Detection using Apache Spark Govind P Guptaa,*, Manish Kulariyaa Department of Information Technology, National Institute of Technology, Raipur-492010(C.G.)India
Abstract Due to increase in internet based services, the size of network traffic data has become so large and complex that it is very difficult to process with the traditional data processing tools. Fast and efficient cyber security intrusion detection is a very challenging problem due to big and complex nature of network traffic data. A realistic cyber security intrusion detection system should be able to process large size of network traffic data as fast as possible in order to detect the malicious traffic as early as possible. This paper used Apache Spark, a big data processing tool for processing the large size of network traffic data. In this paper, we have proposed a framework in which first a well-known feature selection algorithm is employed for selecting the most important features and then classification based intrusion detection method is used for fast and efficient detection of intrusion in the massive network traffic. In this work, we have used two well-known feature selection algorithm, namely, correlation based feature selection and Chi-squared feature selection and five well known classification based intrusion detection methods, namely, Logistic regression, Support vector machines, Random forest, Gradient Boosted Decision trees & Naive Bayes. A real time DARPA’s KDD’99 data set is used to validate the proposed framework and performance comparison of classification based intrusion detection schemes are evaluated in terms of training time, prediction time, accuracy, sensitivity and specificity. © Published by Elsevier B.V.B.V. This is an open access article under the CC BY-NC-ND license ©2016 2016The TheAuthors. Authors. Published by Elsevier (http://creativecommons.org/licenses/by-nc-nd/4.0/). Peer-review under responsibility of the Organizing Committee of ICACC 2016. Peer-review under responsibility of the Organizing Committee of ICACC 2016 Keywords:Cyber security, Intrusion Detection, Network Traffic Analysis, Apache Spark
1. Introduction As the use of internet based services are increasing rapidly, so the cyber security concerns are also growing. In recent years, cyber security intrusion detection has become a very challenging research area in communication * Corresponding author. Tel.: +91-9458127005 E-mail address:
[email protected]
1877-0509 © 2016 The Authors. Published by Elsevier B.V. This is an open access article under the CC BY-NC-ND license (http://creativecommons.org/licenses/by-nc-nd/4.0/). Peer-review under responsibility of the Organizing Committee of ICACC 2016 doi:10.1016/j.procs.2016.07.238
Govind P. Gupta and Manish Kulariya / Procedia Computer Science 93 (2016) 824 – 831
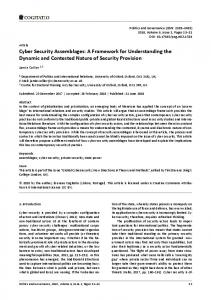
network [1]. An intrusion detection system (IDS) is a complete ecosystem for monitoring the network traffic for detection of malicious activities and generates alerts messages to the controlling station [1] [2] [3]. Due to increase in internet based services, the size of network traffic data has become so large and complex that it is very difficult to process with the traditional data processing tools. Fast and efficient cyber security intrusion detection is a very challenging problem due to big and complex nature of network traffic data. A realistic cyber security intrusion detection system should be able to process large size of network traffic data as fast as possible in order to detect the malicious traffic as early as possible. Cyber security intrusion detection commonly requires an efficient real-time storing and processing of the large size of network traffic data as well as analysis to identify malicious network traffic [4]. In this paper, we aim to design a framework using Apache Spark: a big data processing tool for fast and efficient detection of cyber security attacks. In the proposed framework, first a well-known feature selection algorithm is employed for selection the most important features and then classification based intrusion detection method is used for fast and efficient detection of intrusion in the massive network traffic. In this work, we have used two well-known feature selection algorithm, namely, correlation based feature selection and Chi-squared feature selectionand five well known classification based intrusion detection methods, namely, Logistic regression, Support vector machines, Random forest, Gradient Boosted Decision trees & Naive Bayes. A real time DARPA’s KDD’99 data set is used to validate the proposed framework and performance comparison of classification based intrusion detection schemes are evaluated in terms of training time, prediction time, accuracy, sensitivity and specificity. This paper is organized as follows: Section II presents the related work. In section III, brief descriptions of the various classifiers are given. In Section IV, we give a comparative study of these methods based on various metrics. And finally Section V carries the conclusion. 2. Related Work Design and development of a fast and efficient cyber security intrusion detection system has been a very popular research area in the field of cyber security of the network systems [1[ [2] [3] [4] [5]. In [2], Lee et al. has discussed signature based intrusion detection model in which rules are formulated based on the 41 features of the datasets. In [5], Tan Z et al. has proposed a collaborative intrusion detection system for enhancing big data security. Susan et. at. [6] proposed the use of fuzzy data mining and genetic algorithm for detection of intrusion detection. Application of unsupervised outlier detection scheme for network intrusion detection has been discussed in [7]. A comparative analysis of anomaly detection schemes for detections of network intrusion is presented in [8] by Lazarevicet. al. G. V. Nadiammaiet. al. [9] presented a comparative study of all rule based and some function based classifiers for detecting intrusion and provides results in terms of accuracy, sensitivity, specificity, time and error. In [10], Himadri et al. discussed a comparative study of classification techniques for detection of intrusion and they used ten classification algorithms namely J48, BayesNet, Logistic, SGD, IBK, JRip, PART, Random Forest, Random Tree and REPTree for detecting the intrusion in the network traffic and present their performance analysis. In this comparative analysis, they have used a very low size instance of data set i.e. in thousands records. All the related work discussed so far, do not focus of fast and efficient detection of attack traffic, they only focus on accuracy. However, in this paper, we have proposed a framework for fast and efficient cyber security intrusion detection. In the proposed work, we have taken big data size where number records used for processing are of big size i.e. around 5 million. In this paper, we not only focus on selecting an efficient and fast scheme but also measure its accuracy, scalability. 3. A Framework for Fast and Efficient Cyber Security Intrusion Detection In this section, we have discussed about a framework for fast and efficient cyber security intrusion detection system and also discussed the algorithms used in different sub-processes of the framework. Fig.1. illustrates the different components of the proposed framework and their interactions.
825
826
Govind P. Gupta and Manish Kulariya / Procedia Computer Science 93 (2016) 824 – 831
Training Dataset (Logged Network traffic data)
Feature Selection
Testing Data
Training Dataset
Feature Selection
Machine Learning Algorithms
Classification Based Intrusion Detection Model
Results
Fig.1. A Framework for Fast and Efficient Cyber Security Intrusion Detection
3.1. Feature Selection Schemes In this section, we have presented two well known feature selection algorithms, namely, correlation based feature selection [11] and Chi-Squared feature selection[2] [12] thatare used for evaluation of the proposed framework. 3.1.1. Correlation based feature selection In the correlation based feature selection algorithm [2] [11], a correlation based heuristic is used for the evaluation of the features. The heuristic used in this method considers the usefulness of individual features for predicting the class labels as well as the level of inter correlation among them. The hypothesis, on which this scheme is based on, can be stated like this. Subsets of Good feature forms a highly correlated class, however, uncorrelated with each other. Correlation basically tells the dependence among various attributes, so the attributes which are highly correlated, i.e. depended on other attributes can be removed. It saves a lot of time and gives the better results. 3.1.2. Chi-Squared feature selection In Chi-Squared feature selection algorithm, chi-square metric [2] [12] is used to find out the fact that how the distributions of categorical variables are different from each other. In this algorithm, goodness of a feature is evaluated by hypothesis testing [6]. Hypothesis testing [25] is a tool to determine whether a result is significant or not. In Apache Spark‘s MLlib library, Pearson’s chi-squared (Ȥ2) tests for evaluation of goodness of fit and independence are formulated. It is used to determine whether distributions of values of a feature for two different classes are distinct or not by using a t-test. If the attributes are found to be distinct within a certain confidence interval, we can include the feature in our classifier model [13]. 3.2. Classification based Intrusion Detection Schemes 3.2.1. Logistic Regression Logistic regression [17] [18] [19] is a linear method. It is widely used for binary responses. It is based on the
827
Govind P. Gupta and Manish Kulariya / Procedia Computer Science 93 (2016) 824 – 831
desire to model the posterior probabilities of k classes by using a linear function in x, While ensuring at the same time that their sum should be one and they should lie in [0,1]. Logistic regression models are mostly fit by maximum likelihood, using the conditional likelihood of G given X. Since Pr(G|X) completely specifies the conditional distribution, the multinomial distribution is appropriate. The logistic loss function is L (w; x, y):=log (1+exp (−ywTx))
(1)
In case of binary classification problems, the model predicts a binary output model, if a data point x is given it will predict as (2) f(z) =1/(1+e −z ) Where z = wTx. By, when (wTx)>0.5, the outcome is positive, else negative. 3.2.2. Support Vector Machine Support vector machine [17] [19] [20] is a well known classification technique, which is based on creating a maximum-margin hyper plane, which is as far away as possible from each of the classes. A dividing line has been chosen so that the parallel lines that touch the items from each class are as far from it as possible. The point that are near to the line are called the support vectors. Support vectors machine can classify data efficiently in a high dimensional dataset. It is mostly used with data intensive scientific problems and complex datasets. 3.2.3. Naïve Bayes Naïve bayes [17] [19] is a popular classification technique, It is basically based on the bayes rule of classification. It works with the assumption that each feature is independent i.e presence of a feature in a class has no relation with the presence of any other feature in that calss. It is a very easy model to build, and works better with large datasets.Bayes theorem [20] is used to calculate posterior probability ܲሺܥȁݔሻ ൌ
ሺ௫ȁሻሺሻ ሺ௫ሻ
(3)
Where P(C) and P(x) are the individual probabilities of C(class) and x(attributes). P(C | x), is a conditional probability, probability of getting event C given that x is true. P(x | C), probability of getting event x given that C is true. 3.2.4. Random Forest Ensembles of decision trees are Random forests [17] [19]. Random forest is considered as one of best algorithms and it is used for the tasks: classification and regression. To reduce the over fitting risk this algorithm combine a lot of decision trees. Same like decision trees, the random forests can handle the categorical features, can be extended to the multiclass classification settings, and does not require feature scaling, it can capture non-linear aspects and feature interactions. Random forest grows multiple tree and to predict a point each tree gives a classification or the tree votes for that particular class, a class with maximum votes is chosen by the model. What random forests do is train a set of decision trees separately because the training is done in parallel. The random forests inject randomness inside the training process so that each decision tree is different from the other. Predictions from each tree are combined which reduces the variance of the predictions, and thus improves the performance on the given test data. 3.2.5. Gradient Boosted Decision Tree Gradient Boosted Decision Tree (GBDT)scheme is aensembles of decision trees [17]. It is a machine learning algorithm which iteratively constructs an ensemble of weak decision tree learners through boosting techniques. In order to minimize the loss function, GBDT iteratively train decision trees. In each iteration, GBDT scheme uses the
828
Govind P. Gupta and Manish Kulariya / Procedia Computer Science 93 (2016) 824 – 831
current ensemble to predict the label of each training instance and then compares the prediction with the true label. This scheme re-labels the dataset in order to put more emphasis on training instances with poor predictions. In this way, in the next iteration, the decision tree will help to correct the previous mistakes. This algorithm is used with large datasets to make prediction with high prediction power. 4. Big Data Processing Tools: Apache Spark Apache Spark [21] is an open source cluster computing platform designed for big data processing. In Comparison to the other big data processing tools such as Hadoop and Storm, it uses multi-staged in-memory processing scheme which results in 100 times faster processing than map-reduce processing. It also supports multiple languages like Java, Scala, or Python and provides a user friendly API and shells in Python, Scala, Java and SQL for handling jobs and writing queries. Spark can run Hadoop clusters and can access and process any Hadoop data sources [21]. The main core of Apache Spark [21] contains some basic functionality such as component of task scheduling, memory management, fault recovery and interaction with storage systems. RDDs (resilient distributed data sets) are the main programming abstraction of Apache Spark. It represents a set of things which is distributed across many computing nodes for processing data in parallel. 5. Experiments and Result Analysis This section presents description of datasets used for experiments and result analysis, performance metrics used for comparisons and a detail performance analysis of the proposed framework by using different feature selection and classification based intrusion detection schemes. For experiment and result analysis, we have used a latest Big Data Processing Tool: Apache Spark and its MLlib[19] library. In the experiments, two well known feature selection schemes are used, namely, correlation based feature selection and hypothesis based feature selection and five well known machine learning algorithms such as Logistic regression[17], Support vector machines [20], Random forest[17], Gradient Boosted Decision trees [17]& Naive Bayes[17] are used for performance evaluation of the proposed framework. 5.1. Description of Datasets In order to verify time efficiency and the effectiveness of the proposed cyber security intrusion detection framework, we have used two real time network traffic datasets, namely DARPA KDD’99 dataset [22] [24] [25] and NSL-KDD Dataset [23]. DARPA KDD’99 dataset contains approximately 4GB network traffic data in the form of tcpdump. This dataset was processed and stored by using approximately five million network connections at DARPA. Each network connection record has 41 features and it is also labeled as either normal or as an attack type. In this dataset, total 22 types of attack are mentioned and these attacks are classified into four groups such as Denial of Service ( DoS), Port Scanning attack (Probe), unauthorized access to remote machine(R2L) and unauthorized access to root super user privileges (U2R attack). NSL-KDD [23] dataset is an improvement version of KDD’99 dataset. In order to avoid biased classification results, all the duplicate instances are removed from KDD’99 dataset and formed a new dataset called NSL-KDD dataset [25]. 5.2. Performance Matrices In order to compare the performance of the proposed framework, we have used five performance matrices such as accuracy, sensitivity, specificity, training time and prediction time. True Positive (TP) measures can be described as number of attacks correctly identified as attacks. False Positive (FP) measures can be described as number of normal connection incorrectly identified as attack connections [18]. True Negative (TN) measurescan be described as number of normal connection correctly identified as normal. However, False Negative (FN) Measures can be described as number of attack connection incorrectly identified as normal. Definition of the performance metrics are described as follows [18]:
829
Govind P. Gupta and Manish Kulariya / Procedia Computer Science 93 (2016) 824 – 831
a)
Accuracy: It is the most important measure of any classification scheme. It describes how accurately a scheme can detect connections as normal or attack. Accuracy=
்ା்ே
(4)
்ା்ேାிାிே
b) Sensitivity:It is also called true positive rate. It is used to measures the proportion of positives that are correctly identified as such. Sensitivity= c)
்
(5)
்ାிே
Specificity: It is also called true negative rate. It is used to measures the proportion of negatives that are correctly identified as such. Specificity=
்ே
(6)
்ேାி
d) Training Time: Time taken to train a classifier. e)
Prediction Time: This describes how much time a particular algorithm has taken to predict whole data set as normal or attack.
5.3. Result Analysis In this section, we discuss the result analysis of the classification based intrusion detection schemes. Performance is evaluated using KDD’99 and NSL-KDD datasets. 5.3.1. Performance analysis of the proposed framework using correlation based feature selection scheme In this experiment, we have used correlation based feature selection scheme for the selection of the most relevant features of the dataset for efficient and effective identification of the cyber attacks. By applying the correlation based feature selection, we observed that some of the attributes are highly correlated such as src_bytes, logged_in, num_compromised, src_count, srv_serror_rate, rerror_rate, diff_srv_rate, dst_host_srv_count, dst_host_same, srv_rate, dst_host_diff_srv_rate, dst_host_srv_diff_host_rate, dst_host_serror_rate, dst_host_srv_serror_rate, dst_host_rerror_rate, dst_host_srv_rerror_rate. After removing the these highly correlated attributes, we trained the classification based intrusion detection model. Table 1: Performance evaluation using correlation based FS method on KDD’99 dataset Method Accuracy Sensitivity Specificity Logistic Regression SVM Naive Bayes Random Forest GB Tree
91.56 78.84 90.68 88.65 91.13
89.91 90.53 98.62 94.62 89.23
98.4 30.48 57.85 63.97 99.0
Training Time 289.105 479.124 79.552 155.64 294.74
Prediction Time 12.909 10.085 12.75 15.65 22.25
It is observed from the Table 1 that Logistic regression based scheme shows highest accuracy approximately 91.56% whereas SVM based scheme records lowest accuracy as 78.84%. Naïve bayesbased scheme shows highest sensitivity 98.62% and GB tree based scheme shows lowest as 89.23% in terms of specificity. GB tree performs better than others by showing 99% specificity and SVM shows lowest specificity. Naïve bayes based scheme takes lowest time to train the model about 80 seconds, and SVM based scheme takes highest time 480 seconds. It is clear
830
Govind P. Gupta and Manish Kulariya / Procedia Computer Science 93 (2016) 824 – 831
that all the schemes took less time to train after removing correlated attributes. Prediction time is also decreased as SVM takes about 10 seconds to predict and GB tree based scheme takes about 22 seconds. Table 2: Performance evaluation using correlation based FS method on NSL-KDD dataset Method
Accuracy
Sensitivity
Specificity
73.43 37.89 23.83 82.35 79.91
58.67 65.01 0.8 72.72 66.99
92.93 2.05 54.27 95.07 96.98
Logistic Regression SVM Naive Bayes Random Forest GB Tree
Training Time 6.363 10.486 2.816 6.159 7.795
Prediction Time 1.357 1.056 0.842 1.387 1.6
It is observed from Table 2 that accuracy and sensitivity of Logistic Regression, SVM and Naïve bayes decreased after removing correlated attributes and in case of Random Forest and GB tree it increases. The accuracy for random forest and GB tree is as 82.35% and 79.91% respectively. Training time and prediction time are also decreased as expected, Naïve bayes takes least time to train the model and to predict the data about 2.8 seconds and 0.84 seconds respectively. GB tree based scheme takes highest time to predict as 1.6 seconds. 5.3.2. Performance analysis of the proposed framework using Hypothesis testing based feature selection schemes Table 3: Performance evaluation using Hypothesis testing based FS method on KDD’99 dataset Method Logistic Regression SVM Naive Bayes Random Forest GB Tree
Accuracy
Sensitivity
Specificity 98.31
Training Time 320.256
Prediction Time 15.686
91.64
90.02
92.13 91.45 92.13 91.38
92.17 99.41 90.85 89.35
91.96 58.56 97.43 99.79
530.45 93.871 159.739 344.771
19.02 14.025 16.326 19.910
It is observed from the Table 3 that accuracy of Logistic Regression, SVM and Naïve Bayes based scheme are approximately same whereas accuracy of random forest and GB tree has increased to 92.13% and 91.38% respectively. Training time and prediction time is also decreased. Sensitivity and specificity is almost same for logistic regression, SVM and Naive Bayes whereas in case of random forest and GB tree it changes slightly. Table 4: Intrusion detection methods evaluation using hypothesis testing based FS method on NSL-KDD dataset
Method Logistic Regression SVM Naive Bayes Random Forest GB Tree
Accuracy
Sensitivity
Specificity 93.34
Training Time 6.412
Prediction Time 1.336
74.37
60.01
40.51 35.4 80.96 76.57
58.45 0.65 69.28 60.85
16.87 81.32 96.4 97.33
10.456 0.875 6.753 8.757
1.53 0.345 2.242 1.674
It is observed from Table 4 that accuracy and sensitivity of all the schemes except random forest is not performing better when applying Chi-squared feature selection scheme. Training time and prediction time for NSL-KDD dataset are decreased by a little margin compare to KDD’99 dataset. The increased accuracy of random forest as well as highest among all the schemes is 80.96%.
Govind P. Gupta and Manish Kulariya / Procedia Computer Science 93 (2016) 824 – 831
6. Conclusion This paper proposed a framework for the fast and efficient cyber security intrusion detection system. The performance of the proposed framework is evaluated by using Big Data processing tool like Apache Spark and machine learning algorithms. We have used two real time dataset such as KDD’99 and NSL-KDD dataset for the performance evaluation of the proposed framework by employing different feature selection and classification models. Removing highly correlated features from KDD’99 dataset affects the accuracy by a very low margin, but it reduces the time taken by all the techniques to train the model or predict the data. Removing attributes according to chi square test does affect the accuracy, increases in case of random forest and GB tree and alsoreduces the time taken by schemes. If we remove highly correlated features from NSL-KDD dataset, accuracy of logistic Regression, SVM and Naïve Bayes reduces by small margin whereas accuracy of random forest and GB tree goes up. Time taken by all the schemes to train and predict are also come down. If we remove attributes from NSL-KDD dataset according to chi square test, accuracy remains almost constant, but increases in case of random forest. References 1. 2. 3. 4. 5. 6. 7. 8. 9. 10. 11. 12. 13. 14. 15. 16.
17. 18. 19. 20. 21. 22. 23. 24. 25.
Huang M-Y, Jasper RJ, Wicks TM, “A large scale distributed intrusion detection framework based on attack strategy analysis”, Computer Network, pp. 65–75, 1999. Lee, W., Stolfo, W. ‘A framework for constructing features and models for intrusion detection systems’, ACM Trans. Inf. Syst. Sec., 2000, 3, (4), pp. 227–261. Feng, W., Zhang, Q., Hu, G., Huang, J.: ‘Mining network data for intrusion detection through combining SVMs with ant colony networks’, Future Gener. Comput. Syst., 2014, 37, pp. 127–140. Bhuyan, M., Bhattacharyya, D., Kalita, J. ‘Network anomaly detection: Methods, systems and tools’, IEEE Commun. Surv. Tutor., 2014, 16, (1), pp. 303–336. Tan Z, Nagar UT, He X, Nanda P, Liu RP, Wang S, Hu J.,”Enhancing big data security with collaborative intrusion detection”, IEEE Cloud Computer, pp. 27–33, 2014. Susan M. Bridges, and Rayford B. Vaughn, “Fuzzy Data Mining and Genetic Algorithms Applied to Intrusion Detection”, Proceedings of the National Information Systems Security Conference (NISSC), Baltimore,MD, October, 2000. J. Zhang, M. Zulkernine. “Anomaly based network intrusion detection with unsupervised outlier detection”. Proc. of the IEEE ICC 2006. pp. 2388-2393. A. Lazarevic, L. Ertoz, A. Ozgur, J. Srivastava& V. Kumar, “A Comparative Study of Anomaly Detection Schemes in Network Intrusion Detection”, Proceedings of Third SIAM Conference on Data Mining, San Francisco, May 2003. G. V. Nadiammai and M. Hemalatha, "Perspective analysis of machine learning algorithms for detecting network intrusions," IEEE Third International Conference on Computing Communication & Networking Technologies (ICCCNT), Coimbatore, India, 2012, pp. 1-7. HimadriChauhan, Vipin Kumar, SumitPundir and Emmanuel S. Pilli,”A Comparative Study of Classification Techniques for Intrusion Detection”, In. Proceedings of International Symposium on Computer and Business Intelligent, pp.40–43, 2013. Sung, H., Mukkamala, S. ‘Identifying important features for intrusion detection using support vector machines and neural networks’,Sympon Applications and the Internet, 2003. El-Khatib, K. ‘Impact of feature reduction on the efficiency of wireless intrusion detection systems’, IEEE Trans.On ParallelDistrib. Syst., 2010. Wei Wang, Yongzhong He, Jiqiang Liu, Sylvain Gombault, “Constructing important features from massive network traffic for lightweight intrusion detection”, IET journals the institution of engineering and technology. FatemehAmiriet. al.,” Mutual information-based feature selection for intrusion detection systems”, Journal of Network and Computer Applications, Elsevier. G. H. John, R. Kohavi, and K. Pfleger, "Irrelevant Features and the Subset Selection Problem," in ICML, 1994, pp. 121-129. S. Ergin and S. Isik, "The assessment of feature selection methods on agglutinative language for spam email detection: A special case for Turkish," Innovations in Intelligent Systems and Applications (INISTA) Proceedings, 2014 IEEE International Symposium on, Alberobello, 2014, pp. 122-125. Trevor hastie, Robert tibshirani, Jerome friedman, “The elements of statistical learning ”, Springer, 2008. Ho C-Y et. al., “Statistical analysis of false positives and false negatives from real traffic with intrusion detection/prevention systems”, IEEE Communication Magazine, pp. 46–54, 2012. Apache Spark MLlib, http://spark.apache.org/docs/latest/mllib-guide.html Cristianini N, Shawe-Taylor J,” An introduction to support vector machines: and other kernel-based learning methods”, Cambridge University Press; 2000. Apache Spark™ - Lightning-Fast Cluster Computing, http:// spark.apache.org/ KDD Cup 1999 dataset. Avaliableonline:http://kdd.ics.uci.edu/databases/kddcup99/kddcup99.html. NSL-KDD dataset, http://www.unb.ca/research/iscx/dataset/iscx-NSL-KDD-dataset.html R. Lippman R et al. “The 1999 DARPA off-line intrusion detectionevaluation”, Journal of Computer Networks, 2000, 34(4):579-595. MahbodTavallaee, EbrahimBagheri, Wei Lu, and Ali A. Ghorbani, "A Detailed Analysis of the KDD CUP 99 Data Set", proceedings of the 2009 IEEE Symposium Computational intelligence in Security and Defence Applications (CISDA 2009).
831