Insects 2015, 6, 988-1012; doi:10.3390/insects6040988 OPEN ACCESS
insects ISSN 2075-4450 www.mdpi.com/journal/insects/ Article
A Framework for Identifying Selective Chemical Applications for IPM in Dryland Agriculture Paul A. Umina 1,2,*, Sommer Jenkins 1, Stuart McColl 2, Aston Arthur 2 and Ary A. Hoffmann 1 1
2
School of BioSciences, The University of Melbourne, Parkville, Victoria 3010, Australia; E-Mails:
[email protected] (S.J.);
[email protected] (A.A.H.) cesar Pty. Ltd, 293 Royal Parade, Parkville, Victoria 3052, Australia; E-Mails:
[email protected] (S.M.);
[email protected] (A.A.)
* Author to whom correspondence should be addressed; E-Mail:
[email protected]; Tel.: +61-3-8344-3710. Academic Editors: Michael J. Stout, Jeff Davis, Rodrigo Diaz and Julien M. Beuzelin Received: 21 August 2015 / Accepted: 11 December 2015 / Published: 16 December 2015
Abstract: Shifts to Integrated Pest Management (IPM) in agriculture are assisted by the identification of chemical applications that provide effective control of pests relative to broad-spectrum pesticides but have fewer negative effects on natural enemy (beneficial) groups that assist in pest control. Here, we outline a framework for identifying such applications and apply this framework to field trials involving the crop establishment phase of Australian dryland cropping systems. Several chemicals, which are not presently available to farmers in Australia, were identified as providing moderate levels of pest control and seedling protection, with the potential to be less harmful to beneficial groups including predatory mites, predatory beetles and ants. This framework highlights the challenges involved in chemically controlling pests while maintaining non-target populations when pest species are present at damaging levels. Keywords: pesticide; pests; toxicity; invertebrate; agro-ecosystems
1. Introduction Worldwide, there is recognition that chemical usage patterns in agriculture are unsustainable and that methods to reduce the use of broad-spectrum pesticides need to be developed so that the role of natural
Insects 2015, 6
989
enemies of pests can be expanded [1–3]. Populations of natural enemy (beneficial) groups are invariably higher on farms where pesticide use is minimized or pesticides are removed completely [4,5]. There has been much progress in identifying the impact of pesticides on non-target beneficial organisms, such as through the International Organization for Biological Control (IOBC), who develop standard methods (ranging from laboratory through to field experiments) for testing the side effects of pesticides on natural enemies [6]. Despite this knowledge, there is still reluctance by the majority of farmers to use alternatives to broad-spectrum pesticides [7,8]. This situation is certainly true in Australia, particularly in the grains industry, which is one of the largest primary industries, with exports worth almost AU$6 billion annually and over 35 million ha planted each year [9]. Invertebrate pests are a significant cost to Australian grain production, not only in terms of direct crop damage and control but also indirect costs as vectors of numerous plant diseases [10,11]. Pesticides are currently the main method of control against invertebrate pests attacking grain crops, mainly due to their low cost, effectiveness and ease of application [12,13]. These chemicals are often applied prophylactically prior to and/or soon after sowing to protect small gross margins and as a safeguard against pest infestations [13–15]. Pests that attack Australian dryland crops at seedling establishment are particularly damaging and responsible for millions of dollars in lost production and chemical control costs each year [13]. Halotydeus destructor Tucker (redlegged earth mite) and the Penthaleus species complex (blue oat mites) are considered to be among the most important establishment pests of Australian grain crops [14,16,17]. Redlegged earth mites and blue oat mites are active during the winter-cropping season in Australia, with an inactive diapause period over the summer months [17,18]. They are widely distributed across southern Australia and extremely polyphagous, attacking a broad range of plant types, including cereals, oilseeds, pulses, and a variety of pasture species [16,17,19]. As in the case of other plant-feeding mites [20], the current heavy reliance on broad-spectrum pesticides is not a sustainable practice and can lead to resistance problems [21], emergence of secondary pests [22] and loss of natural enemies [23,24]. High resistance levels to synthetic pyrethroids have already been observed in H. destructor after continuous exposure to these chemicals in the field [21,25]. Additionally, there is a high likelihood that a number of broad-spectrum chemicals will be removed from the market as a result of international pesticide legislation in reaction to potential hazards to health and the environment. Endosulfan has already been banned in Australia as a result of this [26], and several other chemical groups are currently under review [27]. There is a need to expand chemistry available to growers, ideally focusing on selective (also referred to as “soft”) pesticides and seed dressings that have reduced impacts on beneficial invertebrates and fit within a broader Integrated Pest Management (IPM) program. There are many selective pesticides currently registered for use within the horticulture, viticulture and Australian cotton industries. However, there have been few attempts to move from using conventional broad-spectrum pesticides to more selective pesticides within the broadacre grains industry, even though selective chemicals can help maintain populations of natural enemies and other beneficial invertebrates that provide important ecosystem services in terms of pest control, seed dispersal, pollination of plants and enhancing soil health [28,29]. Selective chemicals are often more expensive in the first instance but can become economically viable when considering their long-term benefits [30]. Unfortunately, the benefits of selective chemicals have typically only been assessed through laboratory bioassays on a few species; the relevance of these assays to field conditions is rarely assessed [31].
Insects 2015, 6
990
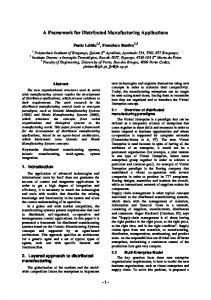
One approach for testing the impact of new chemical applications might involve a comparison of effects on pests and beneficial groups to both a conventional (broad-spectrum) treatment and a treatment where no sprays are applied (Figure 1). This field chemical evaluation (FCE) framework would allow for the effectiveness of new chemical applications against pests to be contrasted to current treatments and for the relative benefits of new applications to be expressed relative to a situation where no chemicals are applied. Ideally, new chemical applications would provide effective control but reduced impact on beneficial groups (1 in Figure 1). However, control might be less effective even if there are fewer harmful effects (3 in Figure 1). A number of idiosyncratic outcomes are also possible due to interactions between chemicals, pests and non-target beneficials. For instance, pest numbers might increase if chemicals are particularly harmful to an important group of beneficial organisms (6 in Figure 1), while secondary pest outbreaks could attract an influx of beneficials into the system (7 in Figure 1).
Figure 1. A framework for assessing the impact of new chemical applications on pest and beneficial invertebrates relative to a conventional chemical treatment and unsprayed treatment. The x-axis represents the effectiveness of the application for controlling a target pest relative to a control treatment. At the intersection with the y-axis there is no control of the pest (i.e., pest numbers are equivalent to an unsprayed control). The y-axis represents the relative reduction of the application on beneficials relative to the unsprayed control. Ideally, new applications will be less harmful but still provide control (1) at similar levels to the conventional treatment, (2) whereas many new chemicals are expected to provide reduced levels of control but also reduced levels of harm (3). Pest numbers can also increase (to the left of the origin) if there are idiosyncratic effects (6,7).
Insects 2015, 6
991
The efficacy of several selective and broad-spectrum pesticides against mite pests of Australian grain crops has been tested in laboratory bioassays [32], which showed that a number of chemicals have potential to provide control against H. destructor and Penthaleus spp., although no single pesticide was found to be effective against all species tested. Furthermore, Jenkins et al. [33] tested the impact of broad-spectrum pesticides and several selective pesticides on these pests and non-target invertebrates under field conditions in wheat and canola, and found that selective chemicals generally had fewer negative effects on non-target species than the broad-spectrum chemicals, although these patterns were inconsistent among invertebrate groups. In this study, we extend the findings of Jenkins et al. [33] by examining the effectiveness of several selective pesticide treatments in the field, as well as exploring some non-chemical approaches that could work hand-in-hand with selective pesticides (e.g., weed cover treatment). These were compared directly with broad-spectrum chemicals commonly used by Australian farmers, allowing treatments to be considered within the FCE framework. 2. Experimental Section 2.1. Trial Sites During 2009 and 2010, four field trials were established to examine the efficacy of selective pesticides against crop establishment pests and non-target invertebrates in Australia. Two trials were conducted in 2009; one site was located near Inverleigh, Victoria (38°09'08'' S, 144°00'36'' E) and the other at Rossbridge, Victoria (37°28'54'' S, 142°50'25'' E). In 2010, the trials were repeated at the Inverleigh and Rossbridge sites. Locations for trials were chosen specifically to target field sites with low history of pesticide use and moderate numbers of crop invertebrates. All trials were designed in a randomized block arrangement with four blocks consisting of six plots per block. Each plot measured 20 m × 20 m, with a 5 m buffer of bare ground separating blocks to limit the movement of invertebrates between plots. In 2009, plots were sown with canola (cv. CB™ Argyle) at a rate of 4 kg/ha at Inverleigh and 5 kg/ha at Rossbridge. In 2010, plots were sown with wheat (cv. Bolac) at a rate of 70 kg/ha at Inverleigh and 88.8 kg/ha at Rossbridge. In all trials, treatments were allocated four replicate plots. Sowing rates were chosen based on local farming practice. 2.2. Chemical Treatments Table 1 outlines the treatments applied at each trial site. Broad-spectrum pesticides were applied at the recommended field rate for H. destructor, which was the main pest present at all sites. The selective pesticides tested in this study are not currently registered for use in broadacre grain crops within Australia, therefore treatments were applied at rates used in other industries and/or recommended directly by agrichemical manufacturers. A low rate of dimethoate was included as a treatment in one trial; although dimethoate is an organophosphorus (and “broad-spectrum”) chemical, it has previously been found to have little negative impact on some non-target invertebrates [34]. Thus for the purposes of this study, we initially categorized dimethoate (when applied at a low field rate) as a selective chemical. All chemical treatments were reported to have toxicity against mites, the target group of pests in this study.
Insects 2015, 6
992 Table 1. Chemical treatments applied at each trial site.
Trial Site
Treatment Name
Broad-spectrum *
Inverleigh 2009
Thiamethoxam/ abamectin
Chemical Trade Name
Active Ingredient(s)
Rate
Treatment
Gaucho®
(mL/ha)
Date(s)
Seed
02/06/2009
Coating
and
No
Talstar and
bifenthrin (250 g/L) and
40 and
Le-mat
omethoate (290 g/L)
100
Columbus
thiamethoxam (72 g/L)/ abamectin (36 g/L)
24/06/2009
300
24/06/2009
Yes
Spinosad
GF-1587
spinosad (100 g/L)
83.6
24/06/2009
Yes
Weed cover Imidacloprid
-
-
-
-
Yes Yes
Untreated control
-
-
-
-
No
Talstar and
bifenthrin (250 g/L) and
40 and
Le-mat
omethoate (290 g/L)
100
Broad-spectrum *
04/06/2009 and
No
16/07/2009
Rossbridge
Diafenthiuron
Pegasus
diafenthiuron (500 g/L)
400
16/07/2009
Yes
2009
Paraffinic oil
Canopy
paraffinic oil (792 g/L)
5000
16/07/2009
Yes
Weed cover
-
-
-
-
Yes
Imidacloprid
-
-
-
-
Yes
Untreated control
-
-
-
-
No
Broad-spectrum
Talstar
bifenthrin (250 g/L)
40
22/06/2010
Yes
400
22/06/2010
Yes
Thiamethoxam/ Inverleigh 2010
Rossbridge 2010
abamectin
Columbus
thiamethoxam (72 g/L)/ abamectin (36 g/L)
Dimethoate
Danadim
dimethoate (400 g/L)
55
22/06/2010
Yes
Weed cover Imidacloprid Untreated control
-
-
-
-
Yes Yes No
Broad-spectrum
Talstar
bifenthrin (250 g/L)
40
29/06/2010
Yes
Diafenthiuron
Pegasus
diafenthiuron (500 g/L)
400
29/06/2010
Yes
400
29/06/2010
Yes
Thiamethoxam/ abamectin
Columbus
thiamethoxam (72 g/L)/ abamectin (36 g/L)
Weed cover
-
-
-
-
Yes
Imidacloprid
-
-
-
-
Yes
Untreated control
-
-
-
-
No
* These treatments had two broad-spectrum applications; a bare earth foliar application of bifenthrin was applied post sowing/pre-emergence and a second application of omethoate was applied at the same time as the selective treatments.
Pesticides were applied once canola seedlings had reached the first true leaf stage and wheat seedlings had reached the one leaf stage (approximately Zadok’s 11). These are known susceptible crop stages when pesticides are often applied to control invertebrate pests within Australia [13,17]. For the broad-spectrum treatments at the 2009 sites, a “bare-earth” application was applied on the day of sowing (well before the emergence of crop seedlings), followed by a second application once the crop had emerged (post sowing) (see Table 1); this is common practice when sowing canola in Australia [14].
Insects 2015, 6
993
The second spray was applied at the same time as the selective pesticides. The untreated control plots were left unsprayed. In addition to investigating different chemical treatments, we also explored the role that alternative host plants play in minimizing pest-feeding damage to emerging crop seedlings. To do this, we included a weed cover treatment in which plots did not receive a pre-sowing herbicide application that was applied to all other plots as per local practice. The weeds within these plots consisted mostly of capeweed (Arctotheca calendula), clover (Trifolium spp.) and ryegrass (Lolium spp.). All chemical treatments were applied in a total volume of 100 L/ha using a trailing boom spray (UniBoom model 600 L TR) with TeeJet (Glendale Heights, IL, USA) flat fan nozzles (02-fine) at 3 bar pressure. Chemical sprays were applied in dry conditions when average wind speed was below 15 km/h. At Rossbridge and Inverleigh, treatments were assigned the same plots over the two-year period (i.e., the untreated control plots in 2009 were also the untreated control plots in 2010). In 2009, the canola seed sown in several field plots was coated with imidacloprid (Gaucho 600, Bayer CropScience, Melbourne, Australia) at the recommended rate of 400 mL/100 kg (Table 1). However, the seed used in the untreated control plots and the broad-spectrum plots were left untreated. In 2010, all wheat seed, except for the untreated control plots, was coated with imidacloprid at a rate of 240 mL/100 kg (Table 1). Pesticide seed coatings were incorporated because they offer protection to crop seedlings from moderate pest densities and can allow foliar pesticide applications to be delayed. This complements pesticides with systemic and translaminar properties, which are common across many of the selective chemicals examined. 2.3. Invertebrate Sampling A combination of vacuum sampling and pitfall traps was used to assess the abundance of invertebrates across plots, both prior to, and after, chemical applications. These techniques are commonly used to assess the densities of ground-dwelling invertebrates in the field [35–37]. Once samples were collected and brought back to the laboratory, they were first sorted to order level using a stereomicroscope with 20×to 100×magnification. Key pest and non-target invertebrates were then further identified by sorting them into family and species levels. Vacuum sampling was performed via suction using a Stihl SH55 blower vacuum (Andreas Stihl AG & Co. KG, Waiblingen, Germany), with four samples randomly taken per field plot. For each sample, we vacuumed the soil surface and vegetation within a 0.09 m2 frame over a period of 10 s. Suction samples were taken using a 100-micron fine cup sieve fitted on to the end of the vacuum spout, with the contents transferred to vials containing 70% ethanol. Pitfall traps consisted of a plastic vial 11 cm deep and 4.5 cm in diameter placed into a polyvinyl chloride (PVC) sleeve in the ground so the rim was flush with the soil surface. Vials contained 50 mL of a 50% propylene glycol (propane-1, 2-diol) solution. At each site, five pitfall traps were placed in a regular arrangement in the central 10 m × 10 m area of each plot and marked with a flag. Four traps were placed in a square configuration, 5 m apart from each other, and the fifth was placed centrally. Pitfall traps were left for seven days before collection. Once collected, vials were then transported to the laboratory where the contents were transferred to a vial containing 70% ethanol. Sampling dates for pitfalls are scored as the day they were collected from the field. In 2009, all plots were vacuum sampled prior to the bare earth application (PreBE), and again at 0, 3, 7, 14 and 28 days after treatment (DAT). Pitfall traps were used in all plots at PreBE at Rossbridge 2009,
Insects 2015, 6
994
while at Inverleigh 2009 at PreBE, pitfall traps were only used in the broad-spectrum and untreated control plots. At both sites, pitfall traps were used across all plots at 0, 14 and 35 DAT. In 2010, there was no “bare earth” pesticide applied at the Inverleigh or Rossbridge sites. At these sites, all plots were vacuum sampled immediately after sowing (post sowing), and again at 0, 7, 14 and 28 DAT. Pitfall sampling occurred post sowing and at zero, 14 and 35 DAT. 2.4. Plant Assessments In the 2009 trials, plant damage and plant density assessments were taken across all plots at 0, 3, 14 and 28 DAT. These assessments were only recorded at 28 DAT in the weed cover plots because the weeds were too dense to accurately assess plant numbers and plant damage at other sampling dates. Assessments were made in four random locations within each plot. At each sample location, a 0.5 m2 quadrat was placed on the ground along a row of plants, and the total number of canola plants within the quadrat was recorded. Overall plant damage was also assessed within the quadrat using a 0–10 scale, where 0 indicates no visible damage, 5 indicates 50% of the plants damaged and 10 indicates all plants dead or dying. This score has been used and validated in numerous studies involving earth mite pests [19,38,39]. In 2010, plant damage and plant density assessments were undertaken at 0, 7, 14 and 28 DAT. These were taken in 10 random locations within each plot. At each sample location, a wooden stick (the length equivalent to a row size of 0.25 m2 depending on row spacing) was placed on the ground along a row of plants, and the total number of wheat plants counted. Overall, plant damage was also assessed along rows marked by the stick as described above. Yield estimates were undertaken at each site using a small plot harvester. In each plot, three strips were harvested the length of the plot and the average grain weight (t/ha) was recorded. Yield estimates were measured at Inverleigh and Rossbridge at 160 and 170 DAT, respectively in 2009, and at 224 and 218 DAT, respectively, in 2010. 2.5. Statistical Analysis For all invertebrate and plant assessments, we calculated an average value for each plot. Plant density and invertebrates collected in the vacuum samples were converted to number of individuals of a taxon per m2. Data for some non-target invertebrates were combined into functional groups. These groups included predatory mites (Astigmata, Bdellidae, Mesostigmata) and predatory beetles (Anthicidae, Carabidae, Staphylinidae, Coccinellidae). Before analysis, all data were checked for normality using the Kolomogorov-Smirnov test (normal distribution) and Levene’s test (homogeneity of variances) following Sokal and Rohlf [40]. Where necessary, invertebrate numbers and plant density were log transformed (log(n + 1)) and feeding damage scores were arcsine square root transformed to achieve normality. However, to maintain biological meaning, all figures display untransformed data. Overall effects of treatment on invertebrate numbers, plant density and plant damage were assessed using repeated measures analysis of variance (ANOVA). These were conducted for each individual invertebrate species/group for the field trials with sufficient numbers. For the invertebrate data, the PreBE or post sowing data was used as a covariate in the analyses. However, this was excluded in the pitfall data for Inverleigh 2009 given that no samples were undertaken at PreBE in most plots. For plant
Insects 2015, 6
995
density and plant damage scores, the weed cover treatment was excluded from analyses in the 2009 trials given they were not assessed at most sampling dates. A one-way analysis of covariance was performed for each invertebrate species/group to calculate studentized residuals, with PreBE or post sowing data included as a covariate. These studentized residuals were then used in analyses to assess differences between treatments at individual sampling dates for each trial. These were assessed using one-way ANOVAs with Tukey’s-b post hoc tests. For cases where repeated measures ANOVAs indicated significant effects for non-target invertebrates (see Table 2), we also calculated cumulative numbers of individuals from post-treatment sampling dates. At each field site, an average cumulative number was calculated per treatment, and one-way ANOVAs with Tukey’s-b post hoc tests were performed to investigate treatment differences. For plant density, plant damage and yield data, we conducted one-way ANOVAs with Tukey’s-b post hoc tests at individual sampling dates for each trial. We have not reported the one-way ANOVA outputs but the post hoc results are discussed and displayed in the figures and tables. Finally, we estimated the relative reduction of invertebrate numbers following chemical treatment. For each individual invertebrate species (or group), we calculated the average number of individuals from all post-treatment sampling dates per plot. At each field site, a treatment average was estimated, and then divided by the average number of invertebrates from the untreated control plots at this site. This resulted in an estimate of the percentage reduction in the species/group relative to the control treatment (or increase as reflected by negative values). The weed cover treatment was excluded from this analysis because we were interested in assessing different chemical applications within the FCE framework. Analyses were conducted in SPSS Statistics (version 20.0, IBM, New York, NY, USA). 3. Results 3.1. Invertebrates A large number of pests and non-target invertebrates were collected from all four field trials, with the abundance of species and groups varying greatly with collection method. Several groups were not analyzed given low and/or inconsistent numbers collected across the field trials (e.g., spiders were counted within every sample but only present in numbers greater than an average of 1/m2 at Rossbridge in 2010). For the purpose of this study, we were particularly interested in the major pests present: H. destructor and Penthaleus species. Data for non-target invertebrates were combined into functional groups. These groups included predatory mites (Astigmata, Bdellidae, Mesostigmata) and predatory beetles (Anthicidae, Carabidae, Staphylinidae). We also analyzed Collembola (Hypogsdtruridae), Oribatidae and Formicidae. Based on trapping efficiency [32,36], vacuum data was used for all groups, except for the Formicidae and predatory beetles for which pitfall data was used. 3.1.1. Pest Species Treatments had an overall impact on H. destructor numbers across the majority of trials (Table 2). Significant treatment effects were present at all sites at most sampling dates for H. destructor, except for Rossbridge 2009 where differences were only present at three DAT (Figure 2). The weed cover treatments tended to have the highest mite numbers across trials. The broad-spectrum pesticides had
Insects 2015, 6
996
significantly fewer H. destructor than the other treatments at most trials, although there were some exceptions. There was no difference between chemical treatments at most sampling dates at the Rossbridge 2009 site (Figure 2b) and for the early sampling dates at the Rossbridge 2010 site (Figure 2d). Furthermore, no differences were evident between the broad-spectrum pesticides and other treatments at the early sampling dates at Inverleigh 2010 (Figure 2c). In most trials, there were no significant differences detected between the selective pesticides, and these did not generally differ from the untreated controls. Diafenthiuron, dimethoate and thiamethoxam/abamectin typically reduced H. destructor numbers by 44% to 92%, but patterns were not consistent across sampling dates and trials. Table 2. Repeated measures ANOVAs comparing the overall treatment effects on pest species and non-target invertebrate numbers collected from vacuum (V) and pitfall (P) samples across each field site. Trial Site
Inverleigh 2009
Rossbridge 2009
Inverleigh 2010
Rossbridge 2010
Functional Group
Sampling Type
df
MS
F-value
p
H. destructor
V
5, 18
9.030
32.489