[12] Maya Yajnik, Sue Moon, Jim Kurose, and Don. Towsley, âMeasurement and modelling of the temporal dependence in packet loss,â in infocom, New York,.
A framework for interpreting measurement over Internet Kavé Salamatian, Serge Fdida LIP6- Université Pierre et Marie Curie (UPMC) Paris, France {kave.salamatian,serge.fdida} @lip6.fr
ABSTRACT This paper introduces a methodology for interpreting measurement obtained over Internet. The paper is motivated by the fact that a large number of published papers in empirical networking analysis follow a generic framework that might be formalized and generalized to a large class of problem. The objective of this paper is to present an interpretation framework and to illustrate it by examples coming from the networking literature. The aim of the paper is rather to give to the researcher who is confronted to measurements coming from a network some guidelines on how to formalize the way to address interpretation of observations. The paper is based on the remark that interpretation is essentially a matter of relating observed effects to hidden causes. This problem might be formalized in its most general setting as an inverse statistical inference problem. The paper illustrates this inverse statistical problem in the context of two well-referred problems: interpretation of active measurement and network tomography. It shows that even if at first glance these two problems are different, the solution framework is the same. We will also give description about how to solve that inverse statistical inference problem by the EM method or the Bayesian framework. The framework provided in this paper is a powerful solution to address the complex problem of interpreting measurement over Internet and network modelling.
Keywords modelling, Interpretation, Measurement, Internet Felix qui potuit rerum cognoscere causas Happy is he who can understand the reasons of realities... Virgile, Georgic
1.
INTRODUCTION
We address, in this paper, the problem of modelling network elements and understanding their behaviour. There
Permission to make digital or hard copies of all or part of this work for personal or classroom use is granted without fee provided that copies are not made or distributed for profit or commercial advantage and that copies bear this notice and the full citation on the first page. To copy otherwise, to republish, to post on servers or to redistribute to lists, requires prior specific permission and/or a fee. ACM SIGCOMM 2003 Workshops , August 25&27, 2003, Karlsruhe, Germany. Copyright 2003 ACM 1-58113-748-6/03/0008 ...$5.00.
exists a complete literature on the art of performance analysis of computer network and a broad spectrum of methods is commonly used to perform capacity planning, modelling and analysis. Analytic modelling, measurement and simulations are frequently used independently or in association to derive accurate solutions able to capture the essence of the system under study. Combining different methods is an interesting solution as it is recognized that each of particular approach is better suited to some target goals. For instance, in computer system modelling, when fine grain analysis is crucial, a first step consists in developing a simulator of the system while, at the same time, a measurement campaign is conducted to extract some important system performance metrics. The later are exploited, in a second step, in order to calibrate the system simulator. We propose a general method that combines measurement and modelling in order to understand some important Internet performance metrics. Two main classes of modelling approaches have been applied so far to address performances in networking context : the constructive and the descriptive approach. The constructive approach has been widely used since many years to model systems in general. It is based on the derivation of a model that ideally produces the same output that the system for an outside observer. These models might be based on a description of network elements those are as close as possible to the real network. The network is described as a combination of queues and routers etc. that causally relate an input scenario defining the parameters of the system in term of arrival process, capacity, buffer space, etc., to output parameters. The modelling phase is followed by a resolution phase that either relies on simulation or analytical analysis to derive performance metrics for a given set of input parameters. This approach is widely adopted in performance analysis and queueing theory. The general use of packet level network simulator, as ns [1], as simulation tool for analysing complex networks have made possible very precise and detailed modelling of network elements. Constructive approaches have the nice property of relating directly performance metrics as can be perceived by end users to operational traffic engineering parameters that might be controlled by network operators. It can also answer "what if" questions, arising when one want to evaluate the impact of changes in network parameters or architecture in the performance of the system under study. Nevertheless, this approach suffers from a main drawback; the assumptions made about the structure of the network and the scenario are so strong that it is very difficult to generalize
results of constructive approach to the real Internet. On the other hand, the descriptive approach is based on measurements made over operational networks. It models the observations by describing them by some statistical parameters such as moment of different order (mean, variance, autocorrelation, Hurst parameter, etc.). In this approach the network is seen as an opaque black box and no access to its internal structure is supposed. The descriptive approach only describes the observations without explaining the mechanism generating the observations. This process mainly aims toward predicting the QoS experienced by applications under some reproducibility or stationarity assumptions. However, as these models do not integrate the mechanisms generating the observations, they cannot help on predicting what will happen if these stationarity assumptions do not hold anymore. This means that this approach cannot be used for network dimensioning, capacity planning or predicting the QoS improvement consecutive to changes in network parameters. An important goal in any scientific investigations, is to interpret results. By interpretation we mean being able to relate effects to causes. Without interpretation, any measurement results remain at best anecdotal, and no proactive control can be done. However, interpretation is not trivial, as it needs an insight into the observed phenomenon that might be unreachable to the observer with incomplete knowledge. This incompleteness might results from partial observation or from partial understanding of the underlying process leading to the observations. The situation of the engineer confronted to measurement obtained over the Internet is almost similar to the situation nicely described by Socrates in the famous Plato cavern allegory [2]. The allegory is the story of peoples who have been held prisoner in a den deep inside a mountain. They have been there for so long that the cave has gradually become the only world they know. The only light they can see is the light from a fire that is maintained on the other side of the cave, which is reflected off the rocks of the cavern in front of them. In this manner, their world has become a world of a faint glow of light and of huge shadows of objects that are passed in front of the fire. The shadows thus become a reality to them that in part defines their world, that they react to. If someone manages to break away from the chains, and begins to observe the process that creates the shadows, he will begins to understand that the mythology of the world the had created for him is not real, but was merely a construct of its deduction from the limitations of its perception. By essence, measurements are always incomplete as they are always bounded in time and space. This fact is truer in the context of the Internet that spread over continent and timescales. Moreover, our understanding of the complex interactions occurring in the network is still embryonic. Even when we have good understanding of some internal mechanism, the combinatorial explosion of the number of influent parameters drive the observer to use a parsimonious and incomplete model of the observed reality. These facts somewhat explain why a lot of observed phenomenon over the Internet still remains without any convincing interpretation. Examples of these unanswered question are the sources (and the interpretation) of self-similar behaviour and long-range dependences in traffic, or the causes of the power law in the topological graphs of Internet.
Our aim in this paper is to provide a framework for interpreting measurements. This framework might be applied to a large class of measurement problem. The approach will consist of mixing the two previously described modelling approaches: constructive and descriptive. At the first step, we use constructive approach to define some models relating effects to causes, or differently said, relating parameters of unseen (hidden) input scenario to observed and measured parameters. This constructive model will be used as an a priori base for interpretation. The interpretation occurs afterthat when descriptive approach and statistical inference are used to infer the hidden input scenario that have led to the actual observations. This framework enable a formulation of the interpretation problem as an inverse statistical estimation problem. In this problem the goal is to infer the input scenario of an a priori constructive model that have more likely led to the observations. This inverse problem might be solved by several methods, as we will explain. Moreover, we will describe some networking problems that appears at first attempt as completely separate problems, but reduce to the same inverse statistical estimation problem by using the described framework, demonstrating its importance as a generic approach.
2.
GENERAL FRAMEWORK
Suppose that we are interested in a given performance metric x (vector-valued variable). Unfortunately, x can not be measured directly (hidden variable), although, we can measure another causally related variable y; by causally related we means that x might be interpreted as a cause of y through a model D (possibly deterministic or probabilistic) relating x to y and some other variables z, i.e. y = D(x, z). Model D might come from a constructive approaches as described in the introduction. It might frequently arise that we have not access to all causal variables,i.e. z or x might be unobserved. In this case probabilistic modelling is applied; x and y are assumed to be realizations of correlated stochastic processes X and Y, defined over a probability space (X × Y, E, P), e.g. a sample space X × Y, a σ-algebra of events E and a probability measure P. We suppose that X and Y are related through a parametric (with parameter θ) stochastic model d
M, i.e. Y = M(θ, X); by stochastic model we mean that the model give the probability distribution function (pdf ) of the resulting random variable and this is emphasized by d the use of the sign = meaning an equality in distribution. Thereafter we will assume that all equality between random variables are by distribution and we will not use anymore d the = sign. We assume that we have measured a realization y of the output process Y and the input process X is hidden from us. The interpretation problem with an a priori interpretation model M consists of finding the sequence x of inputs that have more likely led to the observation y (Fig. 1). In this framework the problem under study reduces to an estimation problem where estimation refers to the general subject of making inferences about the value(s) of one (or more) random variable(s) based on observations (measurements) of one or more related random variables [3]. In general terms, we have to find an inference δ(y) = ˆ of the hidden variable X and the parameter θ based ˆ θ) (X,
we find a good model for interpretation and what happen if the a priori model is bad? This question is as old as modelling itself. Almost all natural phenomena lack of universal models that are good for all purposes. A specific model and a resulting interpretation might be good in one context and insufficient for another one. The quality of a model cannot be defined per se, and it need to be evaluated in relation with the applicative context of the model. The proposed framework gives a natural way to evaluate the quality of an interpretation. As explained before, the outcome of the interpretation problem is an inferred seˆ that most likely led to the observation of quence of input x y. Application of the sequence of input (ˆ x) to the model ˆx ˆ = M(θ, ˆ) lead to a predicted sequence of observations y that might be compared with the observation by the way ˆ ) evaluating the error. Definition of a cost function C(y, y of the cost function depends on the particular applicative setting. However, some popular cost function, as the root mean squared error (rms), are frequently used. Figure 1: The general interpretation problem
on the observation y such that an optimality criterion is satisfied. The optimality criterion for dealing with the estimation problem can be defined based on every form of ˆ suitable to a particular applicative cost function C(X, X) need. We will describe further this general case. This general problem can be splitted to two problems that may not be independent: the modelling problem and the interpretation problem. In the described framework the modelling problem goal is to infer the parameter θ in relation Y = M(θ, X) that will most likely lead to the observation y. Specific case of this problem is given by descriptive approaches which usually try to describes the observations (measurements) through a stochastic parametric model defined by Y = N (θ) (where no input variable X is assumed) by inferring the parameter θ. As an example of this kind of approaches we can give the large literature, that assume a model N where the observation have a multi-fractal or long-range dependent structure, and one have to infer parameters of the model based on the observations. We will give other examples in the forthcoming. On the other hand the interpretation problem tries to find ˆ (realization of the random vector X) the vector δ(y) = x that will interpret the measured y by a cause and effect relationship given by Y = M(θ, X) (where the parameter θ are assumed to be known). Solving this problem is the ultimate goal of measurement interpretation, as based on the a priori interpretation model, it gives the set of causes (ˆ x) that have more likely lead to the observation (y). This kind of approach has also been applied in a lot of problems in the networking literature. One bright example is the so-called network tomography problem [4, 5, 6], where one have to infer the internal characteristics of the network (Traffic matrix, link delay, link losses, etc.) based on some correlated observed value. We will describe more completely this example in next section. Before going further and giving any explanatory examples, we have to answer a concern that might pop up in the reader mind; the proposed interpretation framework is based on an a priori interpretation model, and the interpretation results are conditioned on this prior model. How can
Figure 2: Needed steps for interpretation of measurements In next section, we will explain the proposed framework by giving a complete application to two examples: interpretation of active measurements and network tomography.
3.
EXPLANATORY EXAMPLES
Previous section has described the interpretation framework in general. In this section we will apply the framework to two well-known problems, and shows that presented solutions to these problems are in fact employing unconsciously the interpretation framework as developed before. We will first describe the interpretation of active measurement problem.
3.1
Interpretation of active measurement
In active measurement a probe sending process injects probe packets into the network. At the other end of the network a measurement agent records some metrics on each received probe packet. The collected metrics are used to infer about the QoS that will be seen by other packet flow crossing the network. The rationale behind active measurement is that end to end QoS as sensed by real application can be measured by being in competition with the real application. The IPPM group of the IETF has defined some end-toend performance metrics [7] to be collected on probe packets. Three main type of information are extracted from the received probe packet flow: packet size, packet loss process and packet delay process. These information are used to derive more complex metrics as goodput, loss rate, loss run length, jitter, etc. The probe packets are usually sent using ICMP (in ping surveys) or UDP. A lot of active measure-
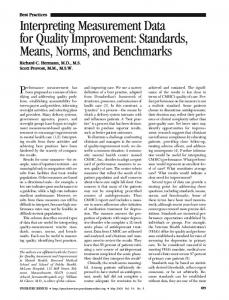
ment surveys has been produced during the recent years [8, 9, 10, 9, 11, 12] and some measurement infrastructures have been deployed [13, 14]. Active measurements are the source of some interesting and challenging problems. We will describe here the interpretation of loss metrics measured by active measurement. Let X = (Xt )Tt=1 be a sampled loss trace measured by an active measurement flow over an Internet link. The loss trace is defined as Xt = 0, if the tth active measurement probe reaches its destination and Xt = 1, if the probe is lost. Losses observed by measurement probes are mainly due to buffer overflow in router in the path. The main cause that has led to the observation of losses is the cross traffic competing with the active measurement flow. In this context interpretation means to find the characteristics of the cross traffic that have led to the observed loss trace.
Background Internet traffic
K
µ
Probing traffic Figure 3: A priori constructive model of the network used for interpretation
For doing this interpretation, we need an a priori constructive model of the Internet path relating the causes (competing cross traffic) to the effects (losses observed on the probes). We assume a simple constructive model M (fig. 3) for the network consisting of a single bottleneck model with transmission capacity µ and buffer size K. The bottleneck is fed by the probing flow and by the Internet background traffic. We assume that the background traffic follows a Markov Modulated Poisson Process (MMPP). The MMPP traffic model describes the traffic entering the bottleneck, as the superposition of the background Internet traffic and measurement probe traffic. This model assumes that the traffic switches between K different states following a continuous time homogeneous Markov chain with infinitesimal transition matrix Q. Each state represents an homogeneous poisson process with parameter Λi = λi + γ, i ∈ {1, . . . , K}, where Γ is the measurement probe traffic and λi represent the Internet background traffic. This model is very suitable as it is able to approximate every type of traffic conditioned on the number of state is sufficiently large (even long-range dependence can be approximated with large number of state and/or semi separable states). The a priori model M is governed by the parameters θ = (µ, K, Λ, Γ) and accept as an input the sequence of states of the MMPP background Internet traffic. The output is the loss process measured over the measurement flow. In this context the previously defined modelling and interpretation problem can be stated as : Modelling problem: Observing a loss trace over the measurement probes what are the parameter θ = (µ, K, Λ, Γ) of the a priori model M. Interpretation problem: What is the particular sample path of the states of the background Internet traffic that has
caused the observed loss trace. In the modelling problem, the parameter µ might be estimated faithfully by packet pairs (or packet train) approaches in the literature [15]. We can therefore assume that it is known. The modelling problem has been treated in the simple case of a Poisson traffic model (MMPP with only one state) in [16]. An extension to the general MMPP case as described here, has been done in [17]. This paper propose a formula relating the MMPP parameters to the parameters of a Hidden Markov Model as described in [18]. [17] shows also that the parameter K is not very sensitive for the purpose of interpretation. The modelling problem, i.e. estimation of remaining parameters θ = (Λ, Γ), is solved by using the Expectation Maximization method that will be described further in section 4. The interpretation problems is solved using the viterbi algorithm or a Maximum a posteriori methodology that will be also describe 4.
3.2
Network tomography
Another example of application of the described interpretation framework is given by the so called “Network tomography” problem. This name was first coined by Vardi in [4] for the problem of traffic matrix estimation based on observed volume of traffic in network links. The name was later extended to a large class of problems consisting of inferring internal network characteristics based on end-to-end measurements [6]. Even if these two problems seem to be far apart, however the mathematical formulation of them remains the same, explaining the similarity of the name attributed to them. These two problem can be reduced to the solution of a highly under-dimensioned linear equation of the form AX = Y , where A is a kind of routing matrix, X is the vector of unknowns characteristics to infer and Y is the vector of observations. For the sake of simplicity we will only described here the first network tomography problem as defined by Vardi, which consist of estimating the traffic matrix based on some partial observation of the traffic volume on internal network link. However the approach can be also applied to the second class of network tomography problems. A Traffic Matrix (TM) represents the volume of traffic that flows between all source-destination pairs in a network. In a TM X = (Xij ), rows and columns represent nodes in the network, and element xij represents the volume of traffic exchanged from node i to j. Traffic matrix is an important parameter for designing and dimensioning network topology and architecture as it gives the traffic demand. However, deriving directly this matrix is unfeasible. A lot of works have dealt with the estimation of traffic matrices using traffic count on network links that can be easily measured by SNMP MIBs [4, 19, 20, 5, 21]. However, traffic matrix have also another meaning that is relevant to the subject of this paper: the volume of traffic Xij exchanged between nodes is the cause of the traffic observed in network links. If somebody wish to interpret traffic count measured on network links at time t, he will have to estimate the traffic matrix at time t. The presented framework might be applied to this problem. In fact proposed solutions to the matrix tomography problem follow unconsciously the framework that we have described. For dealing with this interpretation problem, the a priori constructive model used is the following. Let c be the
number of origin-destination (OD) pairs. If the network has n nodes, then c = n ∗ (n − 1). Rather than represent the amount of data transmitted from node i to node j as Xij , it is preferable to represent the list of OD pairs as a vector. We thus order the pairs and let Xk be the amount of data transmitted by OD pair k. Let Y = (y1 , ...yr ) be the vector of link counts where yl gives the link count for link l, and r denotes the number of links in the network. The link counts refer to the link load which is obtained via SNMP data. The vectors X (causes) and Y (observations) are related through a routing matrix A, which is an r by c matrix. Each routing matrix component aij ∈ 0, 1 where aij = 1 if link i belongs to the path used for OD pair j, and aij = 0 otherwise. The OD flows are thus related to the link counts according to the linear relation: Y = AX
(1)
This means that the traffic matrix estimation problem is equivalent to solving the previous linear equation. However this linear equation is largely under-dimensioned as the number of link in a network is largely smaller than the number of OD pairs. Nevertheless, this equation can be used as the base of an a priori model for interpretation. We need to define a parametric structure for the distribution of the unobserved causes X. Let’s suppose that X follows a probability distribution P(α) with unknows parameters α, e.g. a normal distribution with α = (µ, σ) or a Poisson distribution with α = λ, etc.. The a priori model M(θ, X) is governed by θ = (A, α), where α is the unknown parameters of the probability distribution of X. The routing matrix A of an IP networks can be obtained by gathering the OSPF or IS-IS links weights and computing the shortest-paths between all OD pairs. We need only to estimate α. In this context the previously defined modelling and interpretation problem can be stated as : Modelling problem: Observing a link traffic count vector Y what are the parameter θ = (α) of the a priori model M. Interpretation problem: Knowing the parameter θ, i.e. parameters of the distribution of OD pairs, and observing a link traffic count vector Y, what is the OD pairs vector X that have led to observation of Y. In other terms the interpretation problem consists of solving the linear equation AX = Y knowing the probability distribution of the hidden values X. As explained before several researches have dealt with these two problems. Some of these researches differ in the parametric hypothesis for the a priori probability distributions of OD pairs P(α), e.g. [4, 20] assume a Poisson distribution, [19] assumes a Gaussian distribution where the mean and the variance are related by σi2 = γµci and [21] assume a MMPP model for the OD pairs. These researches differ also in the resolution method used for solving the modelling and interpretation problem, e.g. [4] use a method of moment for solving the modelling problem, [20] use a Bayesian estimation framework for solving the modelling and interpretation problem, [19] use an EM method for solving the modelling problem and an Iterative Proportional Fitting (IPF) for solving the interpretation problem. [5] make a comparison of these different approaches. In this section, we have applied the proposed interpretation framework to two problems. We have demonstrated
that even if these two problems seems far away, the resolution framework for the two is essentially the same. This conclusion might be reached over a large class of problem in Internet measurement analysis. In next section we will describe how to solve the interpretation and modelling problem and compare the different approach to the problem.
4.
HOW TO SOLVE IT
Previous sections have introduced the interpretation of measurement obtained over Internet as an inversion estimation problem. This section will give some guidelines for solving the modelling problems as described before. Three main approach are detailed here : the EM method based on the maximum likelihood paradigm, the Bayesian approach based on the Bayes theorem and the Maximum a posteriori approach and the regularization approach related to the maximum entropy paradigm. For the sake of simplicity, we will explain here the discrete variable framework where all variables, i.e. X, Y, θ etc., are discrete�random variables and it is meaningful to speak about Prob . . The presentation can be easily extended to the continuous variable case by replacing the probability, density function and summations by integrals. The interpretative model M(X, θ) defines two probability distribution function : an a priori �distribution function for the hidden input of the model Prob X; θ and a conditional � distribution function Prob Y|X; θ giving the input-output relationship. These two distribution are the basis of the inverse statistical problem we have to solve for interpreting measurements.
4.1
EM method
The first approach for dealing with the modelling problem is based on the maximum-likelihood paradigm. Recall the definition of the maximum-likelihood paradigm. Let suppose that we have observed a realization x of a random vector X, the log-likelihood function given�the observed sequence x is defined as L(θ|x) = log Prob X = x; θ . One important point is that in the maximum likelihood paradigm, the parameter θ is not a random variable and it is rather an hidden fixed value that have to be computed. It is therefore meaningless to condition a probability by θ. This point is emphasized by using in notations a semi-colon to separate θ from other variables. The log-likelihood function might be thought of as a function of the parameters θ where the observed vector x is fixed. In the maximum likelihood paradigm, the value of θ is chosen such that it maximizes the log-likelihood function. θˆ = Arg max L(θ|X) Θ
� Depending on the form of the density function Prob X = x; θ this problem can be easy or hard to solve. For some problem it is not possible to find simple analytical expressions for the log-likelihood function, and we must resort to other techniques, as the EM method that will be described. The modelling problem could be rewritten in the maximum log-likelihood context as finding the value θˆ that maximizes the complete-data log-likelihood function given � the observation of y defined as L(θ|X, Y = y) = log Prob X, Y = y; θ . θˆ = Arg max L(θ|X, Y = y) Θ
The complete-data � log-likelihood � function � is obtained using Prob Y, X; θ = Prob Y|X; θ Prob X; θ that is computable as we have the interpretation model M. However, as the vector X is hidden the previous optimization cannot be done easily. EM method is used to deal with situation where we have missing values, due to problems with or limitations of the observation process. This is exactly the situation we have to deal with. As X is hidden, the complete-data log-likelihood function L(θ|X, Y = y) can be assumed as a random variable. By fixing the value of the parameter θ = θˆ(i) , the marginal distribution of the unobserved input vector X can be ob� tained as γ (i) (X) = Prob X|Y = y; θ = θˆ(i) . The function Q(θ, θˆ(i) ) can be defined as the expectation of the completedata log-likelihood function over the marginal distribution γ (i) (.): � Q(θ, θˆ(i) ) = E L(θ|X, Y = y)|Y = y; θˆ(i) In some case the distribution γ (i) (.) is a simple analytic expression of the assumed parameter θˆ(i) and the observed data y. This favourable case occurs when X and Y are jointly Gaussian or when we are in the Hidden Markov Model context where Baum-Welches backward and forward equations apply [22]. In worst case this marginal distribution might be difficult to compute and we have to use in � place of it Prob X, Y = y; θ = θˆ(i) which is more easy to derive. This will not affect the overall convergence of the EM methods, but it might slow down it. The EM method consists of iterations of two steps: an Expectation step where the function Q(θ, θˆ(i) ) is evaluated and a Maximization step where the maximum-likelihood paradigm is applied to previously define mean log-likelihood computed by Q(θ, θˆ(i) ) which is maximized with respect to θ to derive the next value θˆ(i+1) . Expectation Step: In this step, we have to compute the expectation of the log-likelihood over the marginal distribution γ (i) (X) to derive Q(θ, θˆ(i) . In some case Q(θ, θˆ(i) ) have a simple analytic form that simplify the maximization step. Maximization Step: Maximize function Q(θ, θˆ(i) ) with respect to θ and derive the new estimate θˆ(i+1) : θˆ(i+1) = Arg max Q(θ, θˆ(i) ). Θ
If Q(θ, θˆ(i) ) has analytic form, the maximization might be done by solving the following equation : ∂Q(θ, θˆ(i) ) = 0. ∂θ The maximization might lead to simple analytic formula in some case where Q(θ, θˆ(i) ) have suitable form. However in some case, the maximization is too complex to be done completely. We might use the generalized EM method which differ from the EM method by the fact that θˆ(i+1) is set such that Q(θ, θˆ(i+1) ) > Q(θ, θˆ(i) ), i.e. θˆ(i+1) is not suppose to maximize Q(θ, θˆ(i) ). These two steps are repeated as necessary to be convinced of the convergence to a fixed point. Each iterations is guaranteed to increase the log-likelihood and the algorithm is guaranteed to converge to a local maximum of the log-likelihood function. However, the local minimum is not necessarily a global minimum. This problem have motivated some statistical variation of the EM method, as
the SAEM (Simulated Annealing Expectation maximization) [23]. These variations introduce some controlled amount of noise into the process to push out the optimization from local minimum. But even with such methods, the EM method is highly sensitive to the initial value θ0 used in the first iteration. The better this initial guess is, the lower the chance to get stick in a local minimum. It is therefore helpful to have an intelligent choice of this initial value. How to make this intelligent choice is a question of expertise and deep knowledge of the problem to analyze. The next step after inferring the parameter θˆ and solving the modelling problem is to deal with the interpretation problem. As explained�before we need to derive the distribution γ (i) (X) = Prob X|Y = y; θ = θˆ(i) in each step of the EM method.� At the last step we have the a posteriori probability Prob X|Y = y; θ = θˆ as a side result of the EM estimation. This probability might be used to estimate ˆ and solve the interpretation problem : X � ˆ = Arg max Prob X|Y = y; θ = θˆ X X
In some case, we might add some constraint in the previous optimization and reduce the search space, e.g. in the matrix tomography problem the constraint AX = Y is added to validate the traffic constraint. We have presented here the EM method in its most general form. The details of the steps required to compute the given quantities are very dependent on the particular application. [19] illustrate the application of EM method to the network tomography problem. [18, 17] presents the application of EM method to the interpretation of active measurement and [24] use SAEM method in the context of flow classification. In next section we will describe the solution of the modelling problem in the context of Bayesian analysis.
4.2
Bayesian framework
The second approach for solving the modelling problem is based on the Bayesian framework. The main difference between this approach and the previously described Maximum likelihood approach is that in the Bayesian framework θ is a random variable that will have a probability distribution function π(θ) and it is meaningful to define a probability conditioned on θ, where in the previous approach θ is seen as an unknown but fixed parameter. This comment is not anecdotal, as it traduces profound methodological differences between the two approaches. The Bayesian approach is completely based on the definition of a prior distribution π(θ), where maximum likelihood do not need any prior distribution hypothesis. Use of prior is the most critical and most criticized point of Bayesian analysis. Recall a description of the Bayesian approach. The framework is based on the Bayes theorem relating the conditional probability of two events A and B : � � � Prob B|A Prob A � � Prob A|B = P alleventsE Prob B|E Prob E This theorem is very helpful for interpreting measurement. As described in previous section, the a prior model M�de fines a conditional probability distribution function Prob Y|X, θ . However as we have observed y and X and θ are missing, we would rather be � interest on knowing the inverse conditional probability Prob X, θ|Y = y . The Bayes theorem enable
� us to compute Prob X, θ|Y = y by : � � � Prob Y|X, θ Prob X|θ π(θ) � � Prob X, θ|Y = y = P Z,Ω Prob Y|Z, θ Prob Z|θ π(ω) After obtaining a posteriori probability dis� the so called tribution Prob X, θ|Y = y , we might compute marginal a posteriori probability defined as : � � P Prob θ|Y = y = X Prob X, θ|Y = y � � P Prob X|Y = y = Θ Prob X, θ|Y = y and apply a maximum a posteriori probability criteria to derive the needed parameter : � θˆ = Arg maxΘ Prob θ|Y = y � ˆ = Arg maxX Prob X|Y = y X One nice property of the Bayesian framework is that it might be extended to deal with cost functions. As explained ˆ ˆ θ)) before, we might define a suitable cost function C(Y, M(X, that will be used to evaluate the quality of the interpretation. To simplify notations, we will position ourself in the continuous situation where X, θ and Y are continuous random variables that are related by conditional defined by the a priori interpretive model M as f (Y|X, θ) and g(X|θ), moreover we will assume an distribution prior π(θ) for the parameters. We suppose that the inference is done by a ˆ θˆ = δ(y). The overall cost refunction delta(.) such that X, sulting from using the inference rule δ for solving the modelling and interpretation problems, can be derived as : Z Z c(δ) = C(y, M(δ(y)))f (Y = y|X, θ)g(X|θ)π(θ)dXdθ Θ
X
The best inference rule for the interpretation problem is the rule that minimize this overall cost : δ ∗ = Arg min c(δ) δ
Such an estimator is called a Bayes estimator. The rich literature in Bayesian decision theory [25], give such Bayes estimator for specific cost function, e. g. for the popular mean square error cost function C(x, y) = |x−y|2 , the Bayes estimator is given by : � δ ∗ (y) = Eπ θ|Y = y The previous discussion has shown that the main technical point in Bayesian analysis is how to calculate the involved integral. These integrals occurs for calculating the a posteriori probability as well as for deriving the total cost. Numerical integral evaluation have a complete and rich literature, however as we are in a statistical estimation context some specific methods have been designed to deal with integrals coming from Bayesian analysis. The Markov Chain Monte Carlo (MCMC) method is one of the most popular approach [25]. The idea here is to define a Markov chain that will converge to a stationary distribution that will follow the needed a posteriori distribution. The Bayesian inference problems might be addressed by MCMC approach. MCMC approach have been applied to deal with the interpretation as defined in this paper. Examples of this application are [20] that use the Bayesian framework for solving the network tomography problem; [21] refines this approach by integrating an MMPP traffic into the a priori model. [26]
apply the Bayesian methodologoy and the MCMC method to another type of network tomography problem where the goal is to identifying lossy links in the interior of the Internet by passively observing the end-to-end performance of existing traffic between a server and its clients.
5.
CONCLUSION AND PERSPECTIVES
In this paper we developed a new modelling methodology for analyzing and interpreting QoS as measured by active measurement with the help of an a priori constructive model. This approach is original as it starts with observed performance (or QoS) measure and find inputs that had lead to these observation. This approach needs the introduction of the hidden variable statistical framework. We have described this framework and given some guidelines into the EM algorithm. This framework provides the mean to formalize the approach in the context of the well documented Hidden Markov Model. Finally, we have illustrated the methodology in the context of the modelling of the loss observed in an internet path. This example shows that the proposed approach can be valuable in the context of interpretation of QoS measured by active measurements. It is clear that this methodology needs more complete explanation and case studies. It enables to build a calibrated model that provides a good tradeoff between accuracy and complexity.
6.
REFERENCES
[1] “Network simulator- ns,” http://www.isi.edu/nsnam. [2] Plato, The republic, IndyPublish.com, 2002. [3] Yannis Viniotis, Probability and Random Processes, Mc Graw Hill, 1998. [4] Y. Vardi, “Estimating Source-Destination Traffic Intensities from Link Data,” Journal of the American Statistical Association, pp. 365–377, 1996. [5] A. Medina, N. Taft, K. Salamatian, S. Bhattacharyya, and Diot C., “Traffic Matrix Estimation: Existing Techniques and New Directions,” in ACM SIGCOMM, Pittsburgh, USA, Aug. 2002. [6] R. Caceres, N.G. duffield, J. Horowitz, and D. Towsley, “Multicast-based inference of network internal loss characteristics,” IEEE Transactions on Information Theory, vol. 45, no. 7, pp. pp. 2462–2480, November 1999. [7] V. Paxson, G. Almes, J. Mahdavi, and M. Mathis, “Framework for IP performance metrics,” RFC-2330, May 1998. [8] V. Paxson, Measurements and Analysis of End-to-End Internet Traffic, Ph.D. thesis, UC Berkeley, February 1997. [9] J. Andren, M. Hilding, and D. Veitch, “Understanding end-to-end internet traffic dynamics,” in Proceedings of SIGCOMM’ 98, 1998. [10] J.C. Bolot, S. Fosse-Parisis, and D. Towsley, “Adaptive fec-based error control for internet telephony,” in Proceedings of IEEE INFOCOM, NY, March 1999, pp. 1453–1460. [11] M. Yajnik, J. Kurose, and D. Towsley, “Packet loss correlation in the mbone multicast network,” in IEEE Global Internet Conf.,London,UK, 1996.
[12] Maya Yajnik, Sue Moon, Jim Kurose, and Don Towsley, “Measurement and modelling of the temporal dependence in packet loss,” in infocom, New York, Mar. 1999. [13] V. Paxson, J. Mahdavi, A. Adams, and M. Mathis, “An architecture for large-scale internet measurement,” IEEE Communications, vol. 36, no. 8, pp. 48–54, August 1998. [14] Fotis Georgatos, Florian Gruber, Daniel Karrenberg, Mark Santcroos, Ana Susanj, Henk Uijterwaal, and René Wilhelm, “Providing active measurements as a regular service for isp’s.,” in Proceeding of PAM 2001 conference. [15] Constantinos Dovrolis, Parameswaran Ramanathan, and David Moore, “What do packet dispersion techniques measure?,” in INFOCOM, 2001, pp. 905–914. [16] Sara Alouf, Philippe Nain, and Donald F. Towsley, “Inferring network characteristics via moment-based estimators,” in INFOCOM, 2001, pp. 1045–1054. [17] Kavé Salamatian Thomas Bugnazet and Bruno Baynat, “Cross traffic estimation by loss process analysis,” in Proceedings of 15th ITC Specialist Seminar on Internet Traffic Engineering and Traffic Management, July 2002. [18] Kavé Salamatian and Sandrine Vaton, “Hidden markov modeling for network communication channels,” in SIGMETRICS 2001, July 2001. [19] J. Cao, D. Davis, S. Vander Weil, and B. Yu, “Time-Varying Network Tomography,” Journal of the American Statistical Association, 2000. [20] C. Tebaldi and M. West, “Bayesian Inference of Network Traffic Using Link Count Data,” Journal of the American Statistical Association, 1998. [21] Sandrine Vaton and Annie Gravey, “Iterative bayesian estimation of network traffic matrices in the case of bursty flows,” in Proceedings of IMW 2002, 2002. [22] Jeff Bilmes, “A gentle tutorial on the EM algorithm including gaussian mixtures and baum-welch,” Tech. Rep. TR-97-021, International Computer Science Institute, Berkeley, CA, 1997. [23] Gilles Celeux, Didier Chauveau, and Jean Diebolt, “On stochastic versions of the EM algorithm,” Tech. Rep. RR-2514, INRIA, 1995. [24] Augustin Soule, Kavé Salamatian, Richard Emilion, Nina Taft, and Konstantina Papaginiaki, “Flow classification by histogram or how to go to safari over interneton stochastic versions of the EM algorithm,” Tech. Rep., LIP6-UPMC, 2003. [25] Christian P. Robert, The Bayesian Choice: From Decision-Theoretic Foundations to Computational Implementation, Springer, 2nd edition, Janvier 2001. [26] Venkata N. Padmanabhan, Lili Qiu, and Helen J. Wang, “Passive network tomography using bayesian inference,” in Proceedings of IMW 2002, ACM, Ed., Marseille, France, 2002.