Figure 1: A Model of software project schedule behaviour. .... system version 3 or 4] after the [new product] ship." ..... O/002 Product support = 15 person-years.
A framework for investigating software project schedule behaviour1 Austen Rainer and Martin Shepperd Empirical Software Engineering Research Group Department of Computing Bournemouth University Talbot Campus Poole Dorset BH12 5BB, UK Email: {arainer, mshepper}@bournemouth.ac.uk ABSTRACT This paper describes an ongoing empirical investigation into software project schedule behaviour at a leading, international software development organisation. Due to the complexity of the phenomena being observed and the diversity and volume of empirical evidence being collected, a framework is proposed. The framework both facilitates the organisation of single and multiple sources of evidence and acts as a foundation for the subsequent analysis of that evidence. The core of the framework is concerned with the interaction between three main constructs, duration, capability and workload. In addition to considering other evidence, the paper reports on the application of this framework to over 2000 statements from project meeting minutes. Rather than presenting definitive findings, the paper demonstrates how the framework can be used to organise and analyse “real world” complex evidence of a variety of types, and evaluates the use of the framework for such organisation and analysis. The main conclusion from the evaluation was that incompatibilities between the requirements of the framework and the nature of the evidence lead to difficulties in using the framework effectively. This has challenged our initial position, which was that the framework would prove to be a practical method for investigating software project schedule behaviour. Keywords: case study, project schedule, empirical evidence. 1. INTRODUCTION A number of case studies are being conducted at a leading, international software development organisation, as an investigation into the following research question: Why do software development projects complete later than originally planned? The focus of these case studies has been on large, real-world software development projects. This has generated a considerable amount of evidence, both qualitative and quantitative, and this has resulted in a research approach which is particularly labour1
An earlier version of this paper was published in: Proceedings of EASE’98 Empirical Assessment and Evaluation in Software Engineering, Keele University, UK, March 30 – April 1 1998.
1
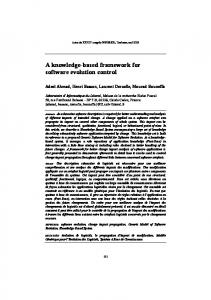
intensive. Despite the labour-intensive nature of this approach, such research is of great importance because software engineering is predominantly concerned with large scale phenomena. This paper reports on the novel approach taken to investigate this research question, reporting interim findings from one case study because the research is still ongoing. More specifically, the paper first presents a framework of software project schedule behaviour, consisting of a model and a classification system derived from that model (see Section 2). The paper then describes how the model and the classification system are being used to organise and reason about the empirical evidence being collected (see Sections 3 and 4). The paper draws upon quantitative and qualitative evidence collected in one particular case study (‘Project C’) to demonstrate the relationships between the model, the classification system, and the empirical evidence. The paper concludes (see Section 5) with an evaluation of the use of the framework and a discussion of the resource implications for this style of research. 2. A MODEL AND CLASSIFICATION SYSTEM In order to help organise the large volume of empirical evidence being collected, and to provide a foundation on which this evidence can be analysed, a simple model of software project schedule behaviour, and an associated classification system, have been developed. The model and classification system are first described and then briefly discussed with respect to related research. 2.1 A MODEL OF SOFTWARE PROJECT SCHEDULE BEHAVIOUR Figure 1: A Model of software project schedule behaviour. WORKLOAD
DURATION
CAPABILITY
Figure 1 presents the model of software project schedule behaviour. The model comprises three constructs: duration, workload and capability. Duration is defined as the amount of time remaining on the project. It could be measured in a number of different units e.g. days, weeks, months. In the case study described here, duration is measured in weeks. Workload is defined as the amount of work remaining to be completed. Again there are a number of different measures of workload available for the case study, and
2
there are benefits in exploiting these different measures, such as triangulation. For simplicity, however, only features are considered in this paper. A feature is a set of market requirements of a piece of software, and each feature “... typically involve[s] changes and additions to multiple [software] subsystems” ([9], p. 840; emphasis in original). Capability is defined as the ability to complete n units of work per unit time e.g. features completed per week. The concept of capability combines concepts of productivity and resource. The relationships between the three constructs of the model can be expressed 2 mathematically as : D = W.C-1
(1)
where D is the time remaining on the project, W is the workload remaining on the project and C is the capability of the project. Currently, the mathematical model is not intended as a predictive system, nevertheless, expressing the model mathematically does introduce opportunities to develop time-based models to explore some of the dynamic aspects of the software development process, as advocated by Abdel-Hamid and Madnick [1]. The model may be applied to the project as a whole, or to a particular section of the project such as an explicit project phase, for instance design or system test. Alternatively, one might focus upon the entire development of a particular ‘part’ of the product, for instance a particular feature. Although the model can be applied at a number of levels of granularity, this paper will focus on the project as a whole. Figure 2a: Modelling Workload.
Figure 2b: Modelling Duration.
Workload (W)
t=0
Duration (D)
t=i
t=n
t=0
Time (t)
t=i
t=n
Time (t)
2
The mathematical formulation is not intended as an exact model, but rather to indicate the nature of the relationships between the three constructs.
3
Figure 2c: Modelling Capability. Capability (C)
t=0
t=i
t=n
Time (t)
Figures 2a-2c present graphical representations of the three constructs. The project starts at time (t=0), and is scheduled to complete at time (t=n). At time (t=i) there is an increase in workload (W). In order not to increase the duration (D) of the project (so that the project maintains its scheduled completion date), the capability (C) of the project must increase. An increase in capability allows more work to be completed in the same amount of time. This example demonstrates the fundamental assertion of this model, which is that a change in one of the constructs will affect a change in one or both of the other constructs. This effect may not be noticed immediately. Note that, at this stage, no distinction is made between the actual values of duration, workload and capability, and the desired values of duration, workload, and capability. For example, an increase in actual workload might lead to a desired increase in capability (necessary to complete the project according to the planned duration), but this desired increase in capability may not be reflected by an actual increase in capability. Note also that no distinction is made between the actual values and the perceived values of duration, workload and capability. Were such a distinction made, one could then explore how the project’s perception of its progress was different from the project’s actual progress. One could also relate this to the desired progress of the project. 2.2 THE CLASSIFICATION SYSTEM The three constructs (workload, duration and capability) provide a basis for classifying the empirical evidence. Items of empirical evidence can be classified according to whether they relate to duration, workload or capability. Having classified the evidence, one can then start to reason about the changes that are occurring to these three constructs and the affects of these changes on final project duration. Later sections of this paper consider how the model and the classification system can be applied in two complementary ways. Section 3 considers how the classification system can be applied to classify particular items of evidence. In that section the classification system is tied closely to the ‘raw’ empirical evidence, and the analysis proceeds ‘bottom up’. Section 4 4
considers how the classification system can be used to organise empirical evidence according to the three primary categories of the classification system. The classification system is applied in a broader fashion and the analysis proceeds ‘top down’. Figure 3. A high-level clas s ification of s oftw are project s chedule behaviour. Empirical evidence
Workload
Actual completion of work Planned completion of work Progress of work Work still to be done Other workload
Capability Duration Unclassified
Figure 3 presents the high-level classification based on the model of schedule behaviour. The figure shows the three primary constructs, together with a more detailed elaboration of the workload construct into secondary constructs. The figure also shows a fourth primary construct, used to accommodate that empirical evidence which cannot be placed within the three main constructs. An example item of evidence that is included under the 'Unclassified' category is: " ... [a developer] will need to upgrade the build machines to [operating system version 3 or 4] after the [new product] ship." Whilst this example suggests an increase in workload, the increase in workload will be after the project has finished. Consequently, it is not appropriate to include this piece of evidence under the workload category.
5
2.3 CLASSIFICATION ATTRIBUTES Each item of empirical evidence is assigned to a specific category, is described by two 3 additional attributes, and is labelled with the week number it was reported . Table 1 shows the relationships between the four primary categories, the five secondary categories, the two attributes, and the week number. Table 1: Attributes for the primary and secondary categories. Primary Construct Workload
Secondary Construct Actual Completion of Work Planned Completion of Work
Workload Type Internal, External
Progress of Work
Internal, External
Work still to be done
Internal, External
Other Workload
Internal, External
Capability
N/A
N/A
Duration
N/A
Internal, External
Unclassified
N/A
N/A
Internal, External
Direction of Change Decrease, No change, Change undetermined Increase, Decrease, No change, Change undetermined Increase, Decrease, No change, Change undetermined Increase, Decrease, No change, Change undetermined Increase, Decrease, No change, Change undetermined Increase, Decrease, No change, Change undetermined Increase, Decrease, No change, Change undetermined No change
Week Number Week number
Week number
Week number
Week number
Week number
Week number
Week number
Week number
(i) Secondary Categories Actual Completion of Work
3
The time of reporting an event, action etc. may not be the same time at which the event, action etc. actually occurred. Whilst it would be ideal to identify when the event actually occurred there is no practical solution, especially when one considers the volume of evidence involved. The interval between when an event occurred and when it was reported is never more than 3 weeks and typically is not more than 2 weeks. Such intervals may lead, however, to a slight distortion in the behaviour of the project.
6
Where an item of evidence has been classified under the ’Actual Completion of Work’ category this usually indicates that there has been a decrease in workload since a piece of work is now complete. Planned Completion of Work An item of evidence classified under the ‘Planned Completion of Work’ category indicates when a certain item of work is expected to be completed. This information is useful because it allows one to reason about whether an item of work has been completed when it was planned. Where an item of evidence, classified under the 'Actual Completion of Work' category, occurs later than a reciprocal item of evidence classified under the 'Planned Completion of Work' category, then this indicates an increase in workload at the time when the work was planned to be completed. The workload would then decrease at the point of the Actual Completion of Work. Progress of Work This is used to categorise items of evidence that refer to the progress of some piece of work, rather than the actual completion or planned completion of that work. Such items of evidence can then be used to trace the progress of a piece of work over time. The ‘Progress of Work’ items can be used as partial substitutes for absent 'Actual Completion of Work' items so that one can gain an insight into whether a particular piece of work is taking longer than originally planned. Work still to be done This is used to highlight work that is not yet complete. It may be that, according to the project plan, this work is planned to be completed at a later date, and consequently there is no increase in workload on the project. By contrast, there may be situations where the existence of such items of evidence indicate that the work is taking longer than originally planned. Other Workload The ‘Other Workload’ category is used to classify items that clearly relate to workload, but which do not qualify under one of the other four workload categories. (ii) Workload Type The ‘Workload Type’ attribute is used to distinguish between work that is part of the project itself, and work which the project team must complete but which does not relate to the project. That work which is part of the project is defined as internal work, and that work which is not part of the project is defined as external work. External work includes service work, work for competitive bids, work for conferences, and other work required by the organisation but which does not relate to the project itself. (iii) Direction of Change
7
Four values are permissible for this attribute: increase, decrease, no change, or change undetermined. If, for example, there is an increase in the workload then the model would assert that one should also expect an increase in either project duration or capability, or both. (iv) Week Number The week numbers allow cross-referencing between the various sources of evidence. They also provide an important temporal aspect. At a given week one can observe the ‘values’ of the workload, capability and duration constructs, and over time one can observe the changes in these ‘values’. 2.4 MODEL DEVELOPMENT The model has been developed through the synthesis of a number of 'strands' of other research, and through experience gained from the case study itself. The general 'shape' of the model is drawn from the 'triple constraints model', found in project management (e.g. [4-6]). The 'triple constraints model' focuses on schedule, content and cost, which may be contrasted with the three constructs of the model presented here. The distinction between workload and capability was drawn from research by Olsen [7] and also from interviews with project managers at the organisation in which the case study is being conducted. For example, one project manager stated: 'First determine the work to be done; then determine our ability to do that work; then build a plan from these.' The values for the Workload Type attribute were based on previous research [2, 3, 8] and on the experiences of the project managers at the reference organisation. Within projects of this organisation there is often a distinction between personnel dedicated to developing new products and personnel dedicated to servicing current products. The secondary constructs were generated from an iterative analysis of a sample set of empirical evidence drawn from a number of the projects being studied at the organisation. 2.5 CAVEATS It should be noted that the model was developed as the evidence was being collected. This has both advantages and disadvantages. Yin [11], for example, would disagree with this approach, arguing that the model should have been developed in some form prior to the collection of the evidence. It was considered important, however, to collect evidence of the project unfolding, rather than only collecting retrospective evidence once the project had completed. Consequently, there were practical constraints in that the project started before the formal model could be developed. It was also considered important to develop a model to which practitioners could relate. This necessarily requires that one spend some time with practitioners understanding the 8
language and concepts that they employ. As indicated earlier in this section, the interviews were actually one source for the development of the model. It should be clear that the current model is not able to distinguish between strengths of change. For example, two items of evidence showing an increase in workload may not be equivalent in terms of the size of the increase in workload. In one respect this is accepted as a limitation of the framework imposed by the kinds of evidence that are naturally available from the project. This limitation is overcome, to some degree, by the collection and analyses of other kinds of evidence from the project, such as summary status reports of the progress of features. In another respect, however, a framework that only represents precise and specific changes would exclude much, if not most, of the qualitative evidence that has been collected. This is undesirable. Consequently, a degree of detail is sacrificed in the framework to improve its flexibility. In this way, the framework is more tolerant of the qualitative evidence and, consequently, the volume of qualitative evidence can be better exploited.
9
3. USING THE CLASSIFICATION SYSTEM TO ORGANISE A SINGLE SOURCE OF EVIDENCE For the purposes of this section, items of evidence are statements derived from the minutes of the project’s development status meetings. Development status meetings for the entire duration of the project are included, a total of 2039 statements. Table 2: A sample of classified empirical evidence. ID. Statement
220
222
223
224
225
226
228 241
272
Primary Secondary Workload Change Week Classification Classification Type No. Discussion of reassignment plans for work items and components owned by[one of the developers] ... Capability N/A Internal Change 19 undetermined 21 Features. 2 in Design State. 9 in Size State. 10 in Working State. Workload Actual Completion of Internal Decrease 21 Work [the project manager] reported that a directive had been issued that all server products supporting the [operating system] environment must be submitted for ... compliance... Workload Other Workload External Change 21 undetermined ... the implication for [the product] is being assessed, but it may require that ... distribution (during the Installation and Customisation phase) uses ... [virus protection]. This was continuing to be evaluated. Workload Other Workload External Change 21 undetermined [the project manager] had completed the design for [one of the features] Workload Actual Completion of Internal Decrease 21 Work ... This had identified potentially serious limitations upon on the operation of the [new product] comprising mixed workstation types... It will not be possible to mix workstation types. Workload Other Workload Internal Change 21 undetermined ... additional work is still required to support parameter requirements of specific servers [...] Workload Work still to be done Internal Increase 21 [a certain developer] pointed out that service commitments had predominated over the past two weeks... Workload Other Workload External Increase 21 Some... [features]... will extend into ...[week 32], Duration N/A Internal Increase 22
Table 2 presents a sample of empirical evidence that has been organised using the classification system. The evidence has been ‘desensitised’ for reasons of confidentiality. Clearly it is inappropriate to draw any general conclusions from a sample of nine statements, but the table illustrates that the classification system is a usable system, although it is often difficult to determine the direction of change for the duration, workload and capability constructs. Difficulties in using the classification system are considered in Section 5. 10
Table 3: Frequency table of the primary classifications of minute statements. Group Capability Duration Unclassified Workload Total
Count 156 10 124 1749 2039
% 7.6 0.5 6.1 85.8 100.0
Table 3 reveals that over 85% of all the statements from the minutes were classified as workload related. This seems to have been the primary preoccupation of the project team. By contrast only 10 out of the 2039 items relate to duration. The likely explanation, confirmed by a senior manager, is that the project duration or schedule is largely treated as ‘given’. Only rarely do the project members believe that they have the latitude to vary project duration. The number of unclassified minute statements (over 6%) is due to the conservative approach adopted, such that in the event of any doubt, a given statement was placed in the unclassified category. It is possible that this count could be reduced by means of discussions with project members. Figure 4: Totals of minute items over time.
100
75 T o t a l
50
25
10
20
30
40
50
WEEK
Figure 4 shows the total number of minute statements over time (week number) with a Lowess smoother applied to indicate possible trends over the duration of the project. The
11
general pattern is a build up in the number of minute statements until the last two meetings of the project when there is a sharp decline. It should also be noted that the intervals between meetings are not always regular, and that there is a tendency for increased frequency during the second half of the project.
12
Figure 5: Time series of minute items by type.
100
75
D a t a
50
Total
25
Work Unclassified Capability Duration
0 6
12
18
24
30
36
Series
Figure 5 shows the count of each class of minute statement per meeting. As previously stated, meetings were not necessarily held at regular intervals so the data is treated here as a series. There is a tendency for the number of statements to increase over time, although the pattern is quite erratic. Two noteworthy features are the pronounced dip (t=10) and, to a lesser extent, (t=24). This corresponds with a spike in duration type statements (t=10), and again just before the second dip (t=23). The working hypothesis, which has been partly confirmed by discussion with personnel from the organisation, is that revisiting the project schedule had the effect of “releasing pressure” on other aspects of the project, namely capability and workload. This analysis is only at a preliminary stage, but it is hoped that one will, for example, be able to superimpose information, such as the progress of features, onto a time line in order to provide a detailed view of the dynamics within a software project. It is expected that this will yield additional insights over and above the traditional “single snapshot” approach that is more generally employed.
13
Figure 6: Time series highlighting a data collection problem. 60.0
50.0
Total
40.0
Workload
D 30.0 a t a 20.0
10.0
Unclassified Capability Duration 4
8
12
16
Series
Figure 6 reveals another application of this type of analysis (in this case on the dataset at an earlier stage in the collection and analysis process). Here the striking feature is the pronounced dip (t=5). This actually proved to be a problem with the data collection and was remedied prior to the generation of Figures 4 and 5. What this figure illustrates is that one of the goals of the analysis can be to validate the consistency of classifications. 4. USING THE CLASSIFICATION SYSTEM TO ORGANISE AND ANALYSE MULTIPLE SOURCES OF EVIDENCE In this section, three examples of organising and analysing multiple sources of evidence are considered. The first example demonstrates how multiple sources of evidence regarding the capability construct can be organised. The second example demonstrates the organisation of multiple sources of evidence regarding the duration. The third example demonstrates how the behaviour of the project can be used to generate questions about the project, and how the framework can be used to help answer those questions. Tables 4 and 5 provide some background information for the three examples. Table 4 indicates the diversity of sources and volume of evidence that the framework must organise and analyse. Table 5 provides more detail on the interviews conducted.
14
Table 4: Summary of the types of evidence collected. Types of evidence Interviews Meeting minutes - Development status meetings - Feature commit and approval meetings - Senior management meetings Project schedules Projector overheads (from presentations) Project documents Risk assessments Project ‘contract’ (including amendments) Comments on interim research reports Email conversation (between researcher & project leader)
Quantity of evidence 9 72 33 34 5 2 2 7 2 1 1 1
Table 5: Summary of interviews. Interview ID. I/001 I/002 I/003 I/004 I/005 I/006 I/007 I/008 I/009
Week of interview 6 8 11 13 13 16 25 34 39
15
Project role of interviewee Project Leader Project Leader Project Manager Brand and Technical Planning System Test Manager Project Leader Project Leader Project Leader Project Leader
4.1 EVIDENCE RELATING TO THE CAPABILITY CONSTRUCT Table 6: Using the classification system to organise multiple sources of evidence. Source of evidence
ID.
Interview
I/001
Interview
I/004
Interview
I/009
Overheads
O/002
Project Documentation
D/002
Statement Primary Secondary Workload Change of Week Classification Classification Type Direction No. “In actual fact 70% of the time and resource I’ve got is involved in servicing existing products, and 30% in terms of new development.” Capability N/A N/A N/A 6 ‘75% of the total effort goes on keeping the customer base happy.’ Capability N/A N/A N/A 13 ‘In the original plan, the resource breakdown was 15 person-years effort for support and 4 for development. In actuality, this has probably been 50:50’ Capability N/A N/A N/A 39 Product support = 15 person-years. New product development = 4 person-years Capability N/A N/A N/A 39 Product support = 15 person-years. New product development = 4 person-years Capability N/A N/A N/A 39
Table 6 presents a sample of empirical evidence that demonstrates one way in which the classification system can be used to organise different types of evidence. The method of organisation is to sort the statements in each source of evidence according to a particular category (in this example, it is the capability category) and then to order the evidence by week number. Statements can then be compared across sources of evidence. In this example, items of evidence have been drawn from interviews, from copies of overhead slides (for presentations) and from project documentation. Once the different sources of evidence have been organised in this way the evidence can be further analysed, for example to show contradictions between different sources of evidence, or to strengthen findings through the triangulation of evidence. In this particular example, multiple sources of evidence collected over time indicate how the planned distribution of resource (i.e. an approximate ratio of 80:20 service to development) differed from the actual distribution of resource (50:50).
16
4.2 EVIDENCE RELATING TO THE DURATION CONSTRUCT Table 7: Key milestones in the project. Milestone
First Plan Decision Checkpoint (DCP) Second Plan DCP (’comeback DCP’) Commit checkpoint Commit checkpoint System test entry - Stage 1 system test - Stage 2 system test Availability checkpoint Availability checkpoint Availability of the product Availability of the product Announcement of the product Announcement of the product
Actual or Planned Actual
Milestone week number 3
Actual
8
Planned Actual Planned Re-planned Re-planned Planned Re-planned Planned Re-planned Planned Re-planned
15 22 32 32 33 38 47 48 59 48 59
Planned variance (weeks)
+/- 4 +/- 4
+/- 4 +/- 2 +/- 5 +/- 2 +/- 5 +/- 2
Table 7 summarises some of the key milestones in the project, and some of the changes to these milestones. The table indicates that there have been increases in duration of parts of the project e.g. the Availability of the product slipped by 11 (eleven) weeks. The model would direct one to explore what changes in workload and capability have contributed to these increases in duration. Table 8: A fine-grained analysis of the duration construct. Item ID. 711 716 818
822
Item of evidence [a developer] had made useful progress on unit testing [feature number 6]... ... but [the developer] is hoping to complete unit testing of [feature number 6] by the weekend [week 33]. [the developer], offline, reported that their testing of [feature number 6] was progressing positively. [They] can now arm and read the ... device... ... [the developer] estimates that there are 2 days testing work outstanding on the [feature] if no further problems are encountered.
Week number 33 33 34
34
Similar analyses are also possible at a much finer granularity, and Table 8 provides such an example. Here, a developer plans to complete the unit testing of feature 6 by the end of week 33 (item 716 from the meeting minutes). Evidence from the subsequent meeting (item 818) indicates that the unit testing was not completed when planned, and that the earliest expected completion date is now week 34 (item 822). Given this evidence, one could now explore what changes in workload and capability could have contributed to
17
this increase in duration (e.g. one could interview the developer(s) of this feature). Such ‘individual durations’ might be also accumulated and then analysed to gain insights into the total duration increases throughout the project, and perhaps compared with high-level milestones such as those presented in Table 7. Table 9: Scheduled duration of certain features in the project. Feature number 1 2 3 4 5 6 7 8 9 10 11 12 13 Total duration
Scheduled duration of feature Weeks (Days) 7.14 (50) 4.86 (34) 2.43 (17) 7.14 (50) 17.86 (125) 12.29 (86) 7.14 (50) 8.57 (60) 5.71 (40) 1.43 (10) 4.29 (30) 7.14 (50) 17.86 (125) 103.86
(727)
Table 9 presents the scheduled duration of certain features in the project. While this information is clearly relevant to the duration construct, this information may also be used to give some insights in the workload of each feature. For example, these durations suggest that features vary considerably in size e.g. feature number 5 appears to consist of three times the work of feature number 9. Against this, one needs to be cautious about inferring workload from measures of duration, because duration does not equal effort. The evidence in Table 9 also challenges the use of features as a unit of workload. 4.3 ANALYSING THE EVIDENCE In order to provide some further insights into how evidence can be analysed, a simple example is explored. This example draws only upon the evidence presented in the previous sections of this paper. Table 6 indicates that the development resource was planned to be distributed between approximately 21% (4 of 19 people) for development of new features and 79% (15 of 19 people) for servicing the existing product (see IDs O/002 and D/002). The resource was actually distributed with approximately 50% of the total resource committed to development (see Interview ID I/009 in Table 6). Table 7 indicates that the availability of the product ‘slipped’ by 11 weeks. This is in spite of the redistribution of resource just
18
considered. While a considerable number of questions arise from this ‘behaviour’, two questions are considered here. Q1.
Was the redistribution of service resource to development because of an increase in development workload? A collection of items such as item 222 in Table 2 can be used to provide quantitative measures of the number of features being developed on the project, and the progress of those features (these measures are provided in a number of meetings in the project). It can be seen from these items that the workload was increasing for the project. In addition, items of evidence such as items 223, 224 and 228 in Table 2 provide qualitative insights into the workload on the project. Item 228, in particular, indicates that work has increased. Item 226 in Table 2 provides an insight into the difficulties the developers were experiencing ‘within’ a feature. This item indicates difficulties that emerge as a result of the design process. On the one hand this item suggests an increase in work because the design process identified serious limitations which needed to be addressed. On the other hand this item also suggests a decrease in workload because the product would not support ‘mix[ed] workstation types’.
Q2.
Was the redistribution of service resource to development because the service workload was overestimated (i.e. there was ‘redundant’ resource for service and so the resource was committed to development)? Evidence such as item 241 in Table 2 would suggest that service workload was not overestimated. Clearly, one item of evidence is only suggestive, but for the purpose of this example it will suffice.
To summarise, the increase in development resource (assumed to be an attempt to increase development capability) is taken as an indication that the project’s management believed that the originally planned development capability was no longer sufficient to complete the current development workload. Evidence is available to indicate that there has been an increase in development workload and that resources have been redistributed in response to this increase. Although a simple example, this example demonstrates how one can use the model and classification system to analyse the empirical evidence.
19
5. DISCUSSION 5.1 An evaluation of the framework The framework Table 10 Contingency table for the primary and secondary classifications and the direction of change attribute. Key to the values of the Direction of Change attribute: 0 Decrease No change + ? Increase Change undetermined ! N/A Not applicable Significant item Category Capability Duration Workload Actual Completion of Work Actual Start of Work Other Workload Planned Completion of Work Planned Start of Work Progress of Work Work still to be done Unclassified Total
Direction of change ! + ? 36 24 53 0 8 1 11 357 756 0 1 16
-
0
32 0 289 267
11 1 332 0
0 21 0
0 167 68
0 8 2
1 281 3
0 0 1 0 321
5 82 10 91 435
0 1 0 0 47
0 59 12 1 390
N/A 0 0 0 0
Total 156 10 1749 284
10 202 94
0 0 0
11 679 167
9 321 108 19 829
0 0 0 13 13
14 463 131 124 2039
Table 10 presents a contingency table of the primary and secondary classifications and the direction of change attribute for the classified project meeting minutes. As the table indicates, relatively few of the items of evidence were placed in the Unclassified category. This suggests that the framework is able to represent the variety of behaviours in a project. The table also indicates that with the Progress of Work category it is not easy to determine the direction of change of workload (e.g. whether the item indicates an increase, a decrease, or no change in the workload). With the Other Workload category, the direction of change has been easier to determine, but there are still a large number of items (202) that remain ambiguous. This suggests that although the framework is able to represent the variety of behaviours in a project, the framework is not able to exploit some of those representations. Incompatibilities between the framework and the evidence
20
The difficulty in exploiting the representations suggests that the kinds of evidence required by the framework are different to, or incompatible with, the kinds of evidence that naturally occur in the project. This is particularly evident in the fact that project members at the status meetings report on the progress of work in terms of qualitative rates of change. For example, project members report on ‘the slow progress of work’ and ‘work not progressing as expected’. Such reports of progress are not in terms of ratios of workload to duration (regardless of what units of workload and duration are used). As indicated in the secondary classifications, these kinds of evidence are classified with the Progress of Work category, which is a part of the Workload construct. It may be more accurate to place the Progress of Work category ‘under’ the Capability construct. Table 11 An example item of evidence classified as Progress of Work. ID
Item of evidence
104
“CK is currently giving his attention and priority to Trace development ...”
Week Number 8
As a more particular example, consider the item of evidence in Table 11. It is difficult to determine whether this item of evidence indicates an increase, a decrease or no change in workload on the project. The incompatibilities between the requirements of the framework and the nature of the evidence naturally occurring in the project make the use of the framework problematic. Our initial position was that although the framework was labour-intensive it would nevertheless provide a practical approach to modelling the schedule behaviour of software development projects. Upon reflection and with experience, we are no longer convinced by such a claim. We still believe, however, that the framework is an interesting approach and has the potential to provide useful insights into the behaviour of software development projects. The evidence is not ‘comprehensive’ There is also the problem that the evidence is not ‘comprehensive’. For example, the Actual Completions of Work items are not easily matched against the Planned Completion of Work items. And both of these sets of items are not easily matched with the project schedule. This suggests that the pieces of work reported on in the meeting minutes do not match the pieces of work planned in the project plan. Phrased another way, the granularity of the project plan is different to the granularity of the project status meeting minutes4.
4
This is a promising avenue for further research. A second project being studied (‘Project B’) is more structured in the way that progress is reported at the project status meetings, where a representative of each functional area reports on the progress of that functional area, and these reports are identified separately in the minutes. Project C does not exhibit such structure in its project status meetings.
21
Currently, work is being directed at understanding the weaknesses of the framework, understanding the nature of the evidence naturally occurring in the project, and revising the framework in respect of these two issues. 5.2 DEMANDS PLACED ON THE RESEARCHER WHEN USING THE FRAMEWORK The framework has progressed through a number of iterations, with attention alternating between the conceptual development of the framework and testing that framework with sample sets of empirical evidence. Having settled on the model and classification system, a considerable amount of effort was then required for identifying and separating the individual items of evidence from the meeting minutes, and then classifying these items. This effort is greatly reduced if the minutes are available in electronic format (although much effort is still required). As an estimate, with the minutes in electronic format, the identification and separation of items takes approximately one hour per meeting, and each iteration of the classification process takes a further hour per meeting. A number of iterations are desirable, not just in terms of getting the classifications correct, but also in terms of developing a ‘background knowledge’, or broad understanding, of the project. With each iteration, the time taken to classify the evidence is likely to be reduced, but this needs to be balanced against the number of iterations conducted in order to develop a sufficient comprehension of the project. For these case studies, the minutes of a meeting are first stored as a word processing document and then each statement is identified and separated in that document. The document is next imported into a spreadsheet, where each statement is classified. This is then is a suitable format to be exported to other software applications (e.g. project management software, data analysis software). The interviews also exact a high demand on one’s time and effort. For these case studies, semi-structured, open-ended interviews have been conducted. For all interviews, interview notes were taken. In addition, some were recorded. As an estimate, the transcription of one hour’s interview takes approximately one working day. Presently, few of the recorded interviews have been transcribed. Instead the recordings are available to supplement notes taken during the interviews. Many of the interviews were conducted prior to the development of the model and classification system. Clearly, if the framework had been available prior to the conduct of the interviews the structure of these interviews could have been greatly improved. 5.3 CONCLUSION This paper has presented and discussed a framework of software project schedule behaviour, consisting of a model and an associated classification system. The classification system is particularly useful for organising empirical evidence from more than one source, thus facilitating triangulation and other comparisons of evidence. The 22
model is also used to analyse the empirical evidence once the evidence has been organised. Evidence can be organised within a single source (e.g. minutes for project meetings) or across multiple sources (e.g. evidence referring to duration). An evaluation of the framework identified two particular difficulties with the framework: 1.
That evidence from the project is not compatible with the framework, and that these incompatibilities cause problems in using the framework.
2.
That the items of evidence from the meeting minutes are not ‘comprehensive’, in that they cannot be matched with other items of evidence from the meeting minutes and are not easily matched with other sources of evidence from the project.
The paper has also suggested how a time based, or dynamic, view of a project can enrich the analysis of schedule behaviour. Although the case study described is still at a relatively early stage, the authors anticipate that the approach described in this paper will prove fruitful in yielding insights into the complex phenomena of software project schedule behaviour.
23
ACKNOWLEDGEMENTS We would like to thank the project members of the anonymous organisation for their contributions to this research. We would also like to thank the anonymous reviewers for their helpful and insightful comments on an earlier version of this paper which was presented at The Empirical Aspects of Software Engineering (EASE) 1998 Conference, Keel University, UK.
REFERENCES [1]
Abdel-Hamid, T.K. and S.E. Madnick, ’Lessons Learned from Modeling the Dynamics of Software Development’, Communications of the ACM, 32(12), pp. 1426-1438, 1989.
[2]
Block, R., The Politics of Projects. Yourdon Press: New York, 1983.
[3]
Curtis, B., H. Krasner, and N. Iscoe, ’A Field Study of the Software Design Process for Large Systems.’, Communications of the ACM, 31(11), pp. 12681287, 1988.
[4]
Lockyer, K. and J. Gordon, Project Management and Project Network Techniques. 6th Ed. Pitman Publishing: 1996.
[5]
Maylor, H., Project Management. Pitman Publishing: 1996.
[6]
Meredith, J.R. and J. Mantel, S.J., Project Management: A Managerial Approach. John Wiley & Sons: New York, 1985.
[7]
Olsen, N.C., ’The Software Rush Hour.’, IEEE Software, 10(5), pp. 29-37, 1993.
[8]
Sauer, C., Why information systems fail: a case study approach. Alfred Waller Limited: Henley-on-Thames, 1993.
[9]
Taff, L.M., J.W. Borchering, and W.R. Hudgins Jr., ’Estimeetings: Development Estimates and a Front-End Process for a Large Project.’, IEEE Transactions on Software Engineering, 17(8), pp. 839-849, 1991.
[10]
van Genuchten, M.v., ’Why is Software Late? An Empirical Study of Reasons for Delay in Software Development.’, IEEE Transactions on Software Engineering, 17(6), pp. 582-590, 1991.
[11]
Yin, R.K., Case Study Research: Design and Methods. 2nd Edition ed. SAGE Publications.: 1994.
24