A Framework for Massive Twitter Data Extraction and Analysis. pp 50-67
A FRAMEWORK FOR MASSIVE TWITTER DATA EXTRACTION AND ANALYSIS ÁlvaroCuesta1, David F.Barrero2, María D. R-Moreno3 1, 2, 3
Universidad de Alcalá, Departamento de Automática, Alcalá de Henares, Spain 1
[email protected], 2
[email protected], 3
[email protected]
ABSTRACT Social networks surfaced as communication and socialization tools. The vast amount of data these networks generate has led to a growing need of automatic knowledge extraction. The popular nature of these services is ideal for trends discovery. In particular, Twitter offers an open environment where people all around the world share information and opinions, emerging as a real-time repository of knowledge that can be exploited by researchers and applications. We propose an open framework to automatically collect and analyze data from Twitter’s public streams. This is a customizable and extensible framework, so researchers can use it to test new techniques. The framework is complemented with a language-agnostic sentiment analysis module, which provides a set of tools to perform sentiment analysis of the collected tweets. The capabilities of this platform are illustrated with two study cases in Spanish, one related to a high impact event (the Boston Terror Attack), and another one related to regular political activity on Twitter. Keywords: Twitter analysis, frameworks, sentiment analysis in Spanish, data extraction
1.0 INTRODUCTION Since its birth in the late 60s, the Internet has grown from a niche market product into a day-to-day tool, with an exponential growth in the last decade. The fast pace of changes renders its future unpredictable. Since its adoption, the Internet has affected the way we think about communicating: HTTP was invented in its early stages as a way for researchers to share information and electronic mail was soon adopted as a replacement for traditional mail delivery systems. During its intense evolution, many other communication services were built: IRC and other custom-protocol chat rooms like ICQ or MSN Messenger, to name a few, bulletin boards, forums, image boards… Most of these services were run by private organizations isolated from each other, creating many small independent communities. Social networks were designed as a means of communication and socialization, not only between relatives, friends and small communities, but also as a virtual real-time “meeting hall” for strangers to meet and discuss. Their goal is to support a social structure through the Internet, in order to satisfy the need of communication between individuals or organizations. Among the diverse social networks, Twitter is one of the most successful, and eventually became the de facto, microblogging platform. Microblogging platforms emphasize short messages (below 140 characters in the case of Twitter). In Twitter, these messages are known as tweets and can be sent from a long list of devices (personal computers, cell phones), either from the web page or from official and external clients. Tweets are shown publicly in each user’s profile page, unless the user decides to limit the access to his tweets. Although users are able to follow each other in a graph-like manner, these follows serve only for subscription purposes, while tweets remain publicly available online for anyone to browse, read and reply. Tweets are available online both in static and streaming form, accessible through a public API provided by Twitter. In its static form, one can query for recent tweets based on certain search criteria. The result to these queries is always a static view in a particular instant in time. The streaming form presents an endless flow of tweets, which must be filtered by at least one criterion (with free API access) accessible from a REST endpoint. Applications may connect to this endpoint and receive data not as a single instant in time, but as a continuous stream of data. Tweets matching the filter criteria are sent from the server as soon as they are available, effectively creating a real-time feed of tweets. The public availability of such a huge amount of valuable information about any topic of interest has opened a vast field of research. This paper presents a framework designed to ease research in this field, providing a set of 50 Malaysian Journal of Computer Science. Vol. 27(1), 2014
A Framework for Massive Twitter Data Extraction and Analysis. pp 50-67
features needed to extract and analyze information on Twitter. Among the objectives, we can mention the following ones: 1) Enabling researchers to easily extract data from Twitter and store it 2) Providing easy tools for analysis on quantitative variables, 3) Building a foundation on which language-agnostic sentiment analysis can be carried out, 4) Creating tools that can deal with textual data analysis, independent of the character set, and 5) Providing researchers with Spanish sentiment analysis resources. The framework is evaluated with two study cases, one involving quantitative analysis around an event (the Boston Terror Attack) and another one covers sentiment analysis on regular Twitter activity around some Spanish politicians. This paper extends a previous work [1] in which we built a first iteration of the platform and performed some basic quantitative analysis around the Boston Terror Attacks. To carry out research about Twitter, a previously classified dataset is required. A tool for collaborative classification is provided, along with classified datasets in Spanish, which revolve around major events in politics. Finally, experimental analysis was conducted on these datasets, both on quantitative variables (such as volume of tweets per second) and opinions, on how events influence Twitter user’s behavior. This paper is structured as follows. Firstly we review some related work, followed by a description of the proposed framework. Section 4 describes in detail the sentiment analysis module. Next, we test the framework with two study cases involving two different approximations to data extraction, one related to an event and another one related to a set of Twitter users. Finally some conclusions and future work are outlined.
2.0 RELATED WORK There is a large corpus of literature leveraging social networks as a source of data with different approaches [2, 3, 4]. The network structure lends itself to graph analysis [5, 6], and specialized studies have been conducted on large-scale complex network characterization [7] that allows deeper analysis of Twitter relationships and their patterns. Social community behavior can be assessed from publicly available data [8] such as topological and geographical properties and their associated activity [9, 3]. Another approach to graph-centric approaches is to model and simulate the network [10]. Traditional Twitter usage leads to sharp outbursts of activity when events take place. This is known officially in Twitter’s platform as “Trending Topics” or “TTs”. Emerging topics can be detected in real time analyzing these outbursts and comparing them with previous activity [11]. Another research shows how to automatically determine newsworthy topics from these emerging topics, taking into account the poster’s credibility [12] based on a number of features such as message content, user behavior and topic-based measurements. Applying such techniques led to interesting results such as real-time event detection. For instance, Sakaki et al. [13] succeeded detecting earthquakes considering Twitter users as “sensors”, achieving great results. Twitter can also be used as a public health indicator [14], which allows to track illnesses over time and space, analyzing risk factors and medication usage. Sentiment analysis (also known as opinion mining) is a series of relatively novel techniques to extract the subjective information conveyed in a text. As a field of study, it joins several techniques of natural language processing, computational linguistics and text mining [15]. This kind of analysis offers a great resource for endusers. For example, the technique is applicable for product review summarization [16], which could assist customers shopping online. Businesses and organizations can also leverage its utility as a massive information source on which to estimate the opinion generated by their products or services. It also could be used by politicians and lawmakers to analyze public opinion [17]. Twitter attracted some interest from researchers due to its open nature and the possibility of gathering mass opinion via sentiment-strength detection [18]. Pak and Paroubek [19] propose a method for automatic collection of messages with positive and negative characteristic traits such as emoticons, on which they perform linguistic analysis and build a sentiment classifier. The most novel techniques apply semantic analysis [20] to extract and classify the sentiment associated to individual entities [21]. The technique is advanced enough as to be able to infer not only the sentiment as a dichotomist entity (positive vs. negative), but also extract a scaled result. The drawback is that the wider the scale, the less precise the results [22].
51 Malaysian Journal of Computer Science. Vol. 27(1), 2014
A Framework for Massive Twitter Data Extraction and Analysis. pp 50-67
The most known Twitter-related available datasets are based on movie reviews [22]. Reviews-based corpora are convenient for sentiment analysis because their metadata are explicitly filled by users. Unfortunately these data sets are only available in English. Most information about sentiment analysis is from English sources (both publications and freely-available data sets). Spanish literature on the subject is very scarce and most of it is available on informal sources such as online forums.
3.0 TWITTER DATA EXTRACTION AND ANALYSIS FRAMEWORK The goal is to provide an easy-to-use Twitter data extraction and analysis tool for research purposes. To this end, the platform is modular, with several independent modules implemented as different programs. Adding new modules or customizing them is straightforward, making easy to adapt the platform to the needs of the researcher. The central piece in this architecture is a database that keeps the tweets mined by the application and makes them available for further processing. There are several layers of processing and these modules need to interchange data among them, using open data formats such as JSON. By default, the framework includes modules for generation report and sentiment analysis, the latter will be described in detail in section 4. The platform is divided into the following components.
Miner: The core of the platform. It listens indefinitely to a filtered Twitter stream and stores the whole status update into the database. The mining module supports three modes of operation: 1) single mode, which is the standard usage pattern of the streaming API. Only one filter is available per IP address while using this mode. 2) In serial mode, several filters are defined along with a limit; Filters are sequentially run and once the limit is hit, the next filter in the list is applied. This allows several filters to be run in the same IP, although the capture presents gaps. The filter can also be configured to sleep for a predefined number of seconds. 3) The parallel mode allows for several filters at the same time without gaps in the capture. A global filter (which aggregates individual filters’ criteria) is generated and used as Twitter’s API parameters. Filters are applied locally and distributed between several collections. Classifier: A Web interface that allows collaborators to help with the supervised classification of tweets. The collaborators have to decide the tweet’s sentiment and classify it accordingly. Trainer: Simplified interface to the NLTK library, which helps building corpora and models out of tweet collections. Tester: Set of tools that help assessing the trained model’s suitability, including tools for manual classification of tweets via CLI and web interfaces, classification of a Twitter stream in real-time and cross-validation of generated classifiers. Reports generator: The report generation module assists by aggregating statistics from the database, both from quantitative and sentiment variables. Statistical analysis is carried out using a set of scripts written in R. In order to decouple the statistical analysis from the backend, an intermediate module generates a set of CSV files from the database. This module is able to handle quantitative reports, providing some basic statistics, and sentiment reports, with the result of the sentiment classification.
The chosen backend database is MongoDB, which is a good fit for our purposes since its atomic representation is JSON, just like tweets. MongoDB is known for its fast write throughput and specially for fast document access. Besides the obvious advantages, it eases congestion in Twitter’s stream reading since the blocking time writing is very low. It should also perform fast when reading data as expected from NoSQL databases. The lack of schema is also an interesting feature, since it allows a more freeform processing of documents and a broader experimentation. Although Twitter data schema is probably never going to change, a single difference in its format could ruin the data insertion process under enforced schemas.
52 Malaysian Journal of Computer Science. Vol. 27(1), 2014
A Framework for Massive Twitter Data Extraction and Analysis. pp 50-67
Fig. 1 Module integration scheme. In addition to the basic collection operations in MongoDB (i.e. selection, projection, insertion, updating and deletion), map-reduce operations can handle complex aggregation tasks using the mapReduce command and the db.collection.mapReduce() wrapper method in the shell. These operations are composed of the two main phases reflected in its name: mapping (i.e. filtering, transformation and sorting) and reduction (a summary operation such as summing, averaging...). The map reduce operation uses a transient collection during processing which is renamed at completion. It is composed of many tasks, including reads from the input collection, executions of the map function, executions of the reduce function and write to the output collection. Most tools in the framework are implemented in Python, but the Classifier and Tester web interfaces run on NodeJS and are programmed in CoffeeScript (a language which can be pre-processed into JavaScript). NodeJS is a fit platform for this job since it allows for a very fast and low-overhead asynchronous programming and has a large number of libraries, which assist in dynamic web development. The platform also includes a set of auxiliary tools, which help with database management. The modules intercommunication model is depicted in Fig. 1. The modules collaborate with each other through various standard means. MongoDB plays a central role as a persistent data store with which modules can communicate. Reports are generated in CSV format and graphed with R scripts. The usage of open formats is important, especially in research because they allow seamless integration with external tools and easy file format conversion, as well as future-proof compatibility. Trained classifiers are stored as Python pickles (Python’s serialization format). Finally, processes that print results to STDOUT can cooperate through Linux pipes just like any other program. A complete procedure of data extraction and sentiment analysis is divided into three separate steps: data acquisition, training for sentiment analysis and report generation. The first step is, obviously, gathering data from Twitter with the Miner. Then the classifier is trained and the sentiment analysis carried out. Finally, the platform generates a set of reports, including the sentiment analysis if it is enabled. Figure 2 illustrates the procedure. During the data acquisition phase, tweets are captured from Twitter’s public streams under some (optional) filtering conditions. Twitter’s filter stream allows filtering for several parameters: track (a set of phrases), follow (a set of Twitter user IDs) and locations (which, being an opt-in feature, is unfortunately only available for a very low volume of tweets). Our system is extended to support two additional filters: language (which is supposed to be implemented natively in Twitter soon) and no-retweets (which filters out retweeted tweets).
53 Malaysian Journal of Computer Science. Vol. 27(1), 2014
A Framework for Massive Twitter Data Extraction and Analysis. pp 50-67
Fig. 2: The platform’s general usage flowchart including sentiment analysis.
The training phase is separated in two branches: manual classification carried out by humans; and training, which builds a statistical model (using these manually classified tweets) where one can measure the membership probability of new tweets. Since massive amounts of data are required for proper training of classifiers, we were in a need for a large pre-classified dataset. Our approach to overcome the problem is swarm-like: a simple web interface where several collaborators can help with classification. Tweets are presented one by one to collaborators which then must decide, based on their tacit knowledge of language, the sentiment expressed in the message. Finally, the report generation phase is divided into quantitative analysis and sentiment analysis. The first one is a traditional statistical analysis involving quantitative variables like the tweet’s length, frequency or number of mentions. The latter (only possible after the statistical model is trained) involves automated analysis of the message sentiment to be analyzed later.
4.0 SENTIMENT ANALYSIS Sentiment classification can be divided into two main categories: supervised and non-supervised. The first approach requires manual work, where humans classify texts by hand. Classifiers based on this approach perform well in domains on which they were trained, but are less versatile and might become obsolete as time (and trends) goes by. Non-supervised alternatives, on the contrary, do not need manual pre-classification and perform better in general cases, but are weaker at classifying tweets for a specific domain. Our analysis is based on a pure dichotomist (i.e., non-graded) approach: each tweet is classified accordingly as either positive or negative (or neutral/undecidable, which will be ignored), depending on its sentiment and intention. We have chosen a supervised classification scheme for our research due to its higher reliability and specialization. The implementation was based on the Natural Language Toolkit (NLTK) framework [23]. The drawback of using supervised classification is the need of a training set. There are several ones available in English; however, its availability in other languages is limited, particularly in Spanish. So, there is a need to generate, manually, this training set. With this consideration in mind, the sentiment analysis module was divided into three subsystems: Trainer, classifier, and tester that will be described in the next subsections. 4.1 Trainer The trainer is a web-based tool that lets humans classify tweets as “positive”, “negative” and “neutral”. The complexity of the problem requires a large training set, making it a tedious and time-consuming task. In order to 54 Malaysian Journal of Computer Science. Vol. 27(1), 2014
A Framework for Massive Twitter Data Extraction and Analysis. pp 50-67
ease this task, the sentiment analysis tool integrates a web-based tool to let collaborative classification of the tweets. This web-based tool contains an index page informing new users about its purpose. A short message encourages collaboration and explains basic usage, and an example classification of tweets can be presented in the landing page to guide newcomers. The main screen is simple and straightforward: tweets are shown one at a time along with three buttons to classify it as either “positive”, “neutral” or “negative”. Once the user casts his vote, it is sent to the server asynchronously and a new one is fetched. As an alternate interface, the user should be able to cast votes using his keyboard, for speed and simplicity. HTTP requests take some time to complete. The delay is especially noticeable in high-latency networks such as mobile Internet providers. Tweets are stored in a local cache on the client’s web browser to minimize delays between the user voting and the next tweet’s being shown. The client side of the application should handle errors nicely, pointing the user on how to report the error if this persists. 4.2 Classifier The result of the manual classification is stored in MongoDB. As a consequence, it needs to transform MongoDB classified collections into NLTK-compatible corpora. In addition, the corpora generator strips tracked words, mentions and URLs to avoid biases. Several votes can be cast for the same tweet (and this is desirable outcome) so votes should be aggregated. Both sum and averaging operators were considered. The aggregate category of a tweet is (neutral tweets are ignored):
The tool abstracts away the trainer configuration and generation, automatically trained with several configurations. It is also able to perform cross-validation of such classifiers, and generate a report with the test results to value each configuration performance. We have evaluated several classifiers and we have finally selected Naïve Bayes with its configuration optimized for each dataset. 4.3 Testing The testing module helps assessing the suitability of classifiers trained from the different pre-classified data sets. More importantly, it helps finding the best classifier for the training set at hand. This subsystem classifies texts given a classifier and a set of ngrams. An n-gram is a contiguous sequence of n words from a given sequence of text. Words are 1-grams, pairs of contiguous words are 2-grams, and so on. The text is tokenized using tokenize [4] and then classified. The most probable category is returned (either “positive” or “negative”), along with its probability. This module also offers a web interface to facilitate testing. This web-based tool classifies a tweet given in its web interface, making it accessible for researchers to test different texts in real-time. The web interface is simple and easy to use; it is just a text box, a classifier picker (to support testing several classifiers in the same run) and a button that, once clicked, sends an asynchronous request to classify the input text. A script is executed in the backend and its result is returned and printed on the client side.
5.0 EXPERIMENTAL RESULTS In this section, we expose two case studies that we have analyzed using our framework. The first case study involves the activity on Twitter around a high impact event, the Boston Terror Attacks. In this case, we tracked a hashtag. The second case study was focused on regular Twitter usage, tracking the activity around well-known Spanish political actors, i.e. politicians, political parties, journalists and activist organizations as well. We selected controversial accounts to have a good foundation for sentiment analysis. Both study cases aimed to gather and analyze tweets in Spanish.
55 Malaysian Journal of Computer Science. Vol. 27(1), 2014
A Framework for Massive Twitter Data Extraction and Analysis. pp 50-67
5.1 Case study 1: Boston Terror Attacks The dataset discussed in this case study was analyzed in our previous paper [1] using a first iteration of the platform, where the results were crude and the process was not automated. In this work, we have carried out a more thorough inspection, including more detailed graphs that highlight relevant events and time frames, and zoom into relevant time windows to provide more details and insights. The event under study took place in Boston, Massachusetts, on Mon, 15 Apr 2013 14:49 EDT (Eastern Daylight Time, which corresponds with GMT-4 or (Europe/Madrid)-6.), killing 3 people and injuring 264 others. The Federal Bureau of Investigation (FBI) was in charge of the investigation, and asked the Marathon attendees to provide photos even hours before or after the incident. A controversial Internet witch-hunt followed shortly (on which Reddit apologized), where citizens all over the world investigated on publicly released photos of the incident found in social networks. On Thu, 18 Apr 2013 17:20 EDT, the FBI released photographs of two suspects. Later that night the suspects allegedly killed a police officer, which followed with a shooting with the police in Watertown, Massachusetts, where one of the suspects was killed and an officer was injured. The surviving (but though to be wounded) suspect fled from the scene and a manhunt ensued, concluding with his arrest on Fri, 19 Apr 2013 20:42 EDT.
Table1 Boston Terror Attacks dataset: Global quantitative characteristics.
Tweets No-retweets Retweets Geolocalized Users Words Mentions Non-replies Replies Size Index Disk
Value 28892 16029 12863 255 24989 392701 18937 18088 849 96.39MB 0.91MB 132.99 MB
Relative
Average 1.16/user
55.48% 44.52% 0.88% 13.59/tweet 65.54% 62.61% 2.94% 3.38 KB/tweet
The data extraction took place between Tue, 16 Apr 2013 00:43 GMT, roughly 4 hours after the incident took place, and Tue, 23 Apr 2013 00:43 GMT, exactly one week later. The filter tracked the phrase “Maratón de Boston” (Boston Marathon in Spanish) which was thought to be the words where most Spanish activities would take place, while still avoiding false positives. A brief overview over the global quantitative characteristics for this dataset is shown in Table 1. Approximately 45% of the tweets were actually retweets, so a lot of the activities around the event are based on re-posting information for followers. This makes sense in a news-based event. Roughly 1% of these tweets are geolocated, rendering it useless for researching. There is also a high number of mentions (around 65.54%) although most of these are actually part of the retweet header. Only 3% of the activities were replies. Twitter activity in this event was not as social as one would expect, although it is reasonable in this kind of event: Twitter was used as a unidirectional communication channel. Tweets, non-retweets and retweets are shown in Fig. 3 and look alike during the whole time series, being mostly a scaled version of each other. The activity grows and decays rapidly after the incident, to remain almost constant with a few exceptions. Depending on the language, Twitter activity uses to swing with the day/night cycle, but Spanish activity is based both on Europe and Latin America, which do not share time zones, compensating for the swings. Also, most of the new activities took place during nighttime in Spain, which reflects the high penetration level that Twitter has in Latin America.
56 Malaysian Journal of Computer Science. Vol. 27(1), 2014
A Framework for Massive Twitter Data Extraction and Analysis. pp 50-67
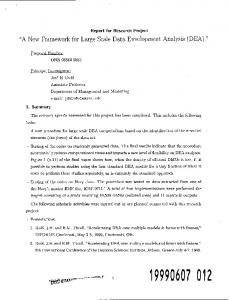
Fig. 3: Boston Terror Attacks dataset: tweets, non-retweets and retweets per hour. The bombing is shown as a dashed vertical line, the photo release as a dotted vertical line and the shooting as a solid vertical line. The manhunt is shown as gray background.
57 Malaysian Journal of Computer Science. Vol. 27(1), 2014
A Framework for Massive Twitter Data Extraction and Analysis. pp 50-67
Fig. 4: Boston Terror Attacks dataset: tweets, non-retweets and retweets per hour. Zoomed around the manhunt. The photo release is shown as a dotted vertical line and the shooting as a solid vertical line. The manhunt is shown as gray background.
58 Malaysian Journal of Computer Science. Vol. 27(1), 2014
A Framework for Massive Twitter Data Extraction and Analysis. pp 50-67
Fig. 5: Boston Terror Attacks dataset: unique tweets/user per hour. The bombing is shown as a dashed vertical line, the photo release as a dotted vertical line and the shooting as a solid vertical line. The manhunt is shown as gray background.
Figure 4 zooms into the secondary events after the incident (photo release, shooting and manhunt). There are some notable patterns:
Before the photo release (which was scheduled as an FBI news conference) the activity is rising, which means that the users were expecting the conference. The activity decays slowly during and after the press release. The activity anticipates the events. After the shooting took place, the activity grew rapidly again, reacting to the event instead of anticipating it. Once the spike goes down the manhunt is issued and expectation is built up around it, which rises slowly following the expected influx of users waking up as the morning advances. At around 01:00pm, the activity peaks and decreases slowly again. It is noticeable how the number of retweets fluctuates wildly while the tweet activity is much more smooth. Finally, near the manhunt end, the expectation builds up again reacting to the suspect finding, and rapidly decreasing again after he is captured (again, reacting a bit late to the news).
Figure 5 shows the average number of tweets posted per user for each time frame. The number remains mostly low, consistent with the 1.16 tweets/user average shown in Table 1. This means that most users just post once (probably spreading the news among friends) and do not post again. During April 17 afternoon, a peak of tweets per user is noticeable, coincident with the Internet suspect identification.
59 Malaysian Journal of Computer Science. Vol. 27(1), 2014
A Framework for Massive Twitter Data Extraction and Analysis. pp 50-67
The average tweet length is shown in Figure 6, discarding stop words. It fluctuates wildly but keeps at around 12/13 words per tweet, consistent with the results shown in Table 1. The data set served as our first test of the miner and report modules. The run was successful and a few notable characteristics can be observed in quantitative data. The difference between anticipated and reactive activity is noticeable in tweet volume. Not surprisingly, the activity is mainly centered around the event and decays rapidly afterwards. The interest remains low even during major events such as the suspects’ pursuit and detention, which shows that Twitter users react massively to stunning events but do not remain interested after the novelty decreases. Due to this dramatic topic, no sentiment analysis will be conducted on the data set, including this in the second study case, which is supposed to contain opposite feelings, and therefore, seems a more convenient dataset.
Fig. 6: Boston Terror Attacks dataset: average word count per hour (retweets and stop words ignored). The bombing is shown as a dashed vertical line, the photo release as a dotted vertical line and the shooting as a solid vertical line. The manhunt is shown as gray background.
5.2 Case study 2: Spanish political activity on Twitter In this case study, we collected tweets of users regular activity on Twitter, not associated to any particular event. To this end, we collected tweets from accounts closely related to Spanish politics. The reason that motivated the selection of this topic falls in the controversy that politics generate, with people showing a wide range of attitudes, posing an interesting case study for sentiment analysis. On the contrary to the previous case study, this one collected data following accounts owned by political parties, representatives, activist organizations and 60 Malaysian Journal of Computer Science. Vol. 27(1), 2014
A Framework for Massive Twitter Data Extraction and Analysis. pp 50-67
journalists. The complete list of accounts included in this case study is shown in Table 2. We tracked both political Twitter account mentions, as well as their own activity. Table 2: Twitter accounts included in this case study, grouped by its type. Account owner Political party Politician Journalist Activist organization
Accounts @PPopular, @PSOE, @iunida, @UPyD @aagarzon, @EduMadina, @Toni-Canto1, @RevillaMiguelA, @ccificuentes, @_Rubalcaba_ @jordievole, @iescolar @LA_PAH
The data extraction took place between Tue, 16 Apr 2013 00:00 GMT and Thu, 18 Apr 2013 04:00 GMT, when the server disconnected due to technical problems. Fortunately, the activity was high enough to be able to characterize common Twitter activity from this dataset. The data timeline overlaps with the Boston event, so a few tweets mention the issue.
5.2.1 Quantitative analysis A brief overview over the global quantitative characteristics for this dataset is shown in Table 3. Approximately 57% of the tweets were actually retweets. Consistent with global Twitter data, roughly 1% of these tweets are geolocated. Unfortunately, this means that we cannot plot a heat map of Twitter activity because the data is not representative. There is an unusually large number of mentions, but this could be explained by the fact that mentions were tracked; so most tweets are mentioning the tracked accounts. Just 18% of these mentions are actually replies, so most tweets mentioned users, not receiving a reply. This could be explained because political parties are usually addressed by voters/detractors but they are not very interested in replying back.
Table 3: Political dataset: global quantitative characteristics.
Tweets No-retweets Retweets Geolocalized Users Worlds Mentions Non-replies Replies Size Index Disk
Value 65,043 28,175 36,868 528 34,195 996,549 56,713 46,981 9,732 227.51MB 2.05MB 237.95MB
Relative
Average 1.9/user
43.32% 56.68% 0.81% 15.32/tweet 87.19% 72.23% 14.96% 3.58 KB/tweet
61 Malaysian Journal of Computer Science. Vol. 27(1), 2014
A Framework for Massive Twitter Data Extraction and Analysis. pp 50-67
Fig. 7: Political dataset: tweets, non-retweets and retweets per hour.
The evolution of tweets, non-retweets and retweets with time is shown in Fig. 7. The three time series depicted in the figure look alike during the whole time series, being mostly a scaled version of each other, which is consistent with the roughly 50% value shown in Table 3. The activity grows and decays rapidly with the day/night cycle. On the contrary to the previous dataset, the day/night cycle is clearly defined, it is because the accounts included in the dataset are relevant in Spain, but not so much in Latin America. 5.2.2 Sentiment classifier training In order to train the classifier, we manually classified a subset of the dataset, yielding 9,884 labeled tweets. Classification was done according to three classes, “positive”, “negative” and “neutral”. Neutral tweets denote both a neutral tweet from feeling perspective (for instance, a purely informative tweet with objective information), but it also labels tweets with some error or unintelligible. Unfortunately, we got a high number of neutral tweets: Only 4,739 tweets out of 9,884 are non-neutral. The dataset contains 1,062 positive and 3,677 negative tweets, which results in an unbalanced dataset. This supports the decision of using a Naïve Bayes classifier, which is known to handle well this type of datasets. We tried several Naïve Bayes classifiers using a set of ngrams in order to select the one with the best performance. In particular, we tried {1}, {2}, {3}, {1, 2}, {1, 3} and {2, 3} ngrams and minimum score of 0, 1, 62 Malaysian Journal of Computer Science. Vol. 27(1), 2014
A Framework for Massive Twitter Data Extraction and Analysis. pp 50-67
2, 3, 4, 5, 6 and 10. All these different options were tried using ten-fold cross-validation to avoid biases induced by the partition of the training set. We computed the accuracy mean and variance, precision, recall and fmeasure mean and variance. The conclusion is that the best trainers had 1-grams included and a minimum score between 2 and 4. Table 4: Political training cross-validation.
NaiveBayes-1 2-min3 NaiveBayes-1-min3 NaiveBayes-1 3-min3 NaiveBayes-1-min4 NaiveBayes-1 3-min5 NaiveBayes-1 2-min4 NaiveBayes-1 3-min4 NaiveBayes-1 3-min1 NaiveBayes-1-min6 NaiveBayes-1-min1 NaiveBayes-1 2-min5 NaiveBayes-1 3-min6 NaiveBayes-1 2-min6 NaiveBayes-1-min5 NaiveBayes-1 2-min1 NaiveBayes-2 3-min6
Accuracy 0.8543 0.8510 0.8507 0.8476 0.8474 0.8469 0.8467 0.8459 0.8452 0.8448 0.8446 0.8438 0.8436 0.8406 0.8389 0.8385
Pos.f-measure 0.6850 0.6640 0.6655 0.6643 0.6702 0.6754 0.6634 0.6586 0.6620 0.6537 0.6737 0.6619 0.6705 0.6528 0.6549 0.4776
Neg.f-measure 0.9051 0.9041 0.9038 0.9010 0.9005 0.8997 0.9006 0.9002 0.8995 0.8998 0.8977 0.8983 0.8970 0.8964 0.8947 0.9043
Table 4 shows an excerpt of the sixteen most performing configurations according to their average accuracy. The negative category has a good precision and recall, but the positive category is a bit lacking, probably due to the low number of positive tweets and imbalanced dataset. For example, when classifying nonsense words such as “asdfasdgagsd” (which means nothing in Spanish and probably in any other language) the classifier always chooses negative, due to the higher probability of guessing correctly in an imbalanced data set. Repeating the cross-validation led to similar results, which shows that results are consistent and not due to chance. Ultimately, the NaïveBayes-1 2-min3 (i.e., Naive Bayes, 1 and 2-grams, minimum 3 score) configuration showed the best performance and was chosen for the sentiment analysis phase. In any case, the performance in terms of accuracy is quite similar, and most likely they do not have statistical significance. Due to its naïve approach, the final classifier showed extraneous features. Some of them stand out among the 100 most informative features:
The bigrams {3, 000} and {1, 000} and the monogram 75 are present as positive features. Person names, such as revilla, pedro, miguel, alberto, madina or martínez. Some of these names correspond to some well-known politicians in Spain. City names like laredo, málaga, pamplona... The bigram {nazismo, propaganda} ({nazism, propaganda} in English) is detected as a positive feature although it has a clearly negative meaning. Seemingly unrelated features such as libro (book), anonymous (in English), nubes (clouds), plaza (square)... The monogram días and the bigram {buenos, días}. The second makes sense (it means “good morning” in Spanish), but días alone just means “days”, which does not express any sentiment.
On the other hand, a good portion of these features is actually informative and conveys sentiment. A larger dataset should be able to provide better results and minimize the bias.
63 Malaysian Journal of Computer Science. Vol. 27(1), 2014
A Framework for Massive Twitter Data Extraction and Analysis. pp 50-67
5.2.3 Sentiment analysis The sentiment analysis results are shown in Fig. 8 grouped by hour. Instead of showing the absolute number of positive/negative tweets, the sentiment is normalized, divided by the total number of tweets in each time frame. This results in the overall sentiment for that time frame, independent of the number of tweets posted. The line shown in the graph conforms to the normalized positive sentiment. Therefore, the area below denotes “negative” and above “positive”.
Fig. 8: Political dataset: normalized sentiment per hour.
Due to the low number of pre-classified tweets and the imbalanced nature of the set (there are 3.5 more negative tweets than positive as detailed in Table 5) the resulting graph is also biased. The results are highly skewed towards negative, leading to an almost constant 0.2 positive score. It is worth mentioning that this is probably not an error: apparently political messages are mainly negative in Twitter, hence the dataset bias, which was already present during the supervised classification, as the Table 5 reflects. Table 5: Political dataset: training set summary.
Category Positive Negative Useful Neutral TOTAL
Count 1062 3677 4739 4653 9392
Relative 11.31% 39.15% 50.46% 49.54%
This dataset allowed us to characterize normal Twitter usage apart from unique events taking place. The dataset served its purpose as a good testbed for sentiment analysis, on which further research can be conducted. 64 Malaysian Journal of Computer Science. Vol. 27(1), 2014
A Framework for Massive Twitter Data Extraction and Analysis. pp 50-67
Although the rationale behind the choice of a political dataset was that it should have a higher emotional content, it is highly skewed towards negative sentiment. A larger dataset might provide better results and minimize the bias, but the sentiment will probably remain almost negative: Twitter users express negative feelings towards politicians, as could expect in a social context where, according to all polls, citizens have a very negative perception of politics.
6.0 CONCLUSIONS AND FUTURE WORK The framework presented in this paper successfully provides researchers with a tool for Twitter analysis, on which further research can be conducted. The mining and quantitative modules are mature enough and fit for production use in their current state. Although the lack of classified corpora led to crude results in sentiment analysis, the tools served their purpose. A few surprising results surfaced, such as the quick decay in interest for long-standing events. Twitter users react massively to dramatic events but do not remain interested in how they unfold or their consequences. We analyzed how Twitter activity unfolds before and after events. Expected events build up slowly but decay rapidly after taking place. On the other hand, unexpected events show a very quick spike of interest (slightly delayed by what we could call the “Twitter reaction time”) that decays slowly as users share and discuss the event. Although the results were predictable, they serve their example purpose, and further analysis could be conducted with more powerful statistical techniques. The ability to collect data on different sets in parallel proved to be useful, providing more refined information at a very little cost. Data can still be grouped together if necessary, providing an overview as a whole. Unfortunately, supervised classification is very expensive and time consuming, which limits our ability to provide it. Another alternative would be to capture marks of sentiment such as emoticons, known words such as sad/happy... and train the classifier assuming that the marks convey the same sentiment as the message. A step that could make better sentiment analysis would be to remove accents, although it might be a doubleedged sword. On the one hand, removing accents aggregates words that have spelling errors with the correct ones, so missing accents would not skew the resulting classifier. On the other hand, Spanish relies on accents to differentiate words such as “como” (I eat) and “cómo” (how), and this information would be lost if accents were stripped. A more reliable way to improve sentiment analysis would be lemmatization, where each inflected word would be reduced to the same basic form, so they could be analyzed as a single item. Also, natural language processing could be carried out to distinguish parts of speech and assign words to specific nouns, minimizing biases. Finally, the platform could be adapted to analyze and graph results in real time, watching data as it unfolds in the stream. This could be very interesting, not only as a toy, but also as a tool: companies or individuals could analyze the data in real time and use it to predict trends or mass opinion even before it unfolds. This is especially useful for companies that could then react accordingly, adjusting their products and offer to match their customers’ needs and desires.
ACKNOWLEDGMENTS The authors would like to thank the many collaborators who participated labeling tweets.
REFERENCES [1]
M. D. R-Moreno, A. Cuesta, and D. F. Barrero, “Twitter stream analysis in spanish,” in Proceedings of the 3rd International Conference on Web Intelligence, Mining and Semantics, WIMS ’13, (New York, NY, USA), pp. 34:1–34:6, ACM, 2013.
65 Malaysian Journal of Computer Science. Vol. 27(1), 2014
A Framework for Massive Twitter Data Extraction and Analysis. pp 50-67
[2]
V. Balakrishnan, V, S. F. Guan & R. G. Raj (2011). A one-mode-for-all predictor for text messaging, Maejo Int. J. Sci. Technol. 2011, vol. 5(02), pp. 266-278.
[3]
G. Bello, H. Menéndez, and D. Camacho, “Extracting collective trends from twitter using social-based data mining,” in 5th International Conference on Computational Collective Intelligence, IEEE, 2013.
[4]
B. O’Connor, M. Krieger, and D. Ahn, “Tweetmotif: Exploratory search and topic sum- marization for twitter,” in ICWSM (W. W. Cohen and S. Gosling, eds.), The AAAI Press, 2010.
[5]
B. Hayes, “Graph theory in practice: Part I,” American Scientist, vol. 88, p. 2000, 2000.
[6]
B. Hayes, A. R. From, and B. Hayes, “Graph theory in practice: Part II,” American Scientist, pp. 200–0, 2000.
[7]
L. F. Costa, F. A. Rodrigues, G. Travieso, and P. R. V. Boas, “Characterization of complex networks: A survey of measurements,” in Advances in Physics.
[8]
J.J. Jung, “Boosting Social Collaborations Based on Contextual Synchronization: An Empirical Study,” Expert Systems with Applications, Vol. 38, No. 5, 2011, pp. 4809-4815.
[9]
G. Bello, H. D. Menéndez, and D. Camacho, “Adaptive k-means algorithm for overlapped graph clustering,” International Journal of Neural Systems, vol. 22, no. 05, 2012.
[10]
A. Gonzalez-Pardo, R. Cajias, and D. Camacho, “An agent-based simulation of christakis- fowler social model,” in Recent Developments in Computational Collective Intelligence (A. Badica, B. Trawinski, and N. T. Nguyen, eds.), vol. 513 of Studies in Computational Intelligence, pp. 69–77, Springer International Publishing, 2014.
[11]
M. Cataldi, L. Di Caro, and C. Schifanella, “Emerging topic detection on twitter based on temporal and social terms evaluation,” in Proceedings of the Tenth International Work- shop on Multimedia Data Mining, MDMKDD ’10, (New York, NY, USA), pp. 4:1–4:10, ACM, 2010.
[12]
C. Castillo, M. Mendoza, and B. Poblete, “Information credibility on twitter,” in Proceedings of the 20th international conference on World wide web, WWW ’11, (New York, NY, USA), pp. 675–684, ACM, 2011.
[13]
T. Sakaki, M. Okazaki, and Y. Matsuo, “Earthquake shakes twitter users: real-time event detection by social sensors,” in Proceedings of the 19th international conference on World wide web, WWW ’10, (New York, NY, USA), pp. 851–860, ACM, 2010.
[14]
M. J. Paul and M. Dredze, “You are what you tweet: Analyzing twitter for public health.”
[15]
Y. Mejova, “Sentiment analysis: An overview.” University of Iowa, Computer Science Department, November 2009.
[16]
M. Hu and B. Liu, “Mining and summarizing customer reviews,” in Proceedings of the tenth ACM SIGKDD international conference on Knowledge discovery and data mining, KDD ’04, (New York, NY, USA), pp. 168–177, ACM, 2004.
[17]
R. Prabowo and M. Thelwall, “Sentiment analysis: A combined approach,” Journal of Informetrics, vol. 3, no. 2, pp. 143 – 157, 2009.
[18]
M. Thelwall, K. Buckley, and G. Paltoglou, “Sentiment strength detection for the social web.,” JASIST, vol. 63, no. 1, pp. 163–173, 2012.
[19]
A. Pak and P. Paroubek, “Twitter as a corpus for sentiment analysis and opinion mining,” in Proceedings of the Seventh International Conference on Language Resources and Evaluation (LREC’10) (N. C. C. 66 Malaysian Journal of Computer Science. Vol. 27(1), 2014
A Framework for Massive Twitter Data Extraction and Analysis. pp 50-67
Chair), K. Choukri, B. Maegaard, J. Mariani, J. Odijk, S. Piperidis, M. Rosner, and D. Tapias, eds.), (Valletta, Malta), European Language Resources Association (ELRA), may 2010. [20]
M. Rico, D. Camacho, and Ó. Corcho, “A contribution-based framework for the creation of semanticallyenabled web applications,” Information Sciences, vol. 180, pp. 1850–1864, May 2010.
[21]
H. Saif, Y. He, and H. Alani, “Semantic sentiment analysis of twitter,” in Proceedings of the 11th international conference on The Semantic Web - Volume Part I, ISWC’12, (Berlin, Heidelberg), pp. 508– 524, Springer-Verlag, 2012.
[22]
B. Pang and L. Lee, “Seeing stars: exploiting class relationships for sentiment categorization with respect to rating scales,” in Proceedings of the 43rd Annual Meeting on Association for Computational Linguistics, ACL ’05, (Stroudsburg, PA, USA), pp. 115– 124, Association for Computational Linguistics, 2005.
[23]
J. Perkins, Python Text Processing with NLTK 2.0 Cookbook: Use Python’s NLTK Suite of Libraries to Maximize Your Natural Language Processing Capabilities. Packt Publishing Ltd, 2010.
BIOGRAPHY ÁlvaroCuesta received a B.Sc. in Computer Engineering from the University of Alcalá (Spain). David F. Barrero received his B.Sc. in Telecommunications Engineering from the University of Alcalá (Spain) and his PhD in Computer Science from the same university. His research interests involve Evolutionary Computation, Electronic Government and Social Networks. He has been a research visitor at NASA Jet Propulsion Laboratory and the University of Portsmouth. He is currently a lecturer in the Computer Engineering Department at the Universidad de Alcalá. María D. R-Moreno received an MS degree in Physics from the Universidad Complutense de Madrid (Spain) and her PhD in Computer Science from Universidad de Alcalá(Spain). Her research interest focuses on planning and scheduling, robotics, evolutionary computation and Social Networks. She spent one year at NASA Ames Research Center as a postdoc and nine weeks at ESA’s European Space Research and Technology Centre (ESTEC) as a research visitor. She is currently an associate professor in the Computer Engineering Department at the Universidad de Alcalá.
67 Malaysian Journal of Computer Science. Vol. 27(1), 2014