A Framework for Resource-aware Knowledge Discovery in Data Streams: A Holistic Approach with Its Application to Clustering Philip S. Yu
Mohamed Medhat Gaber
Caulfield School of Information Technology 900 Dandenong Road, VIC 3145 Melbourne, Australia +61399031402
IBM T.J. Watson Research Center 19 Skyline Drive Hawthorne, NY 10532 +19147847141
[email protected] .edu.au ABSTRACT
[email protected] amounts of streams with very high data rates. Transferring this amount of data to the ground stations to be analyzed is infeasible due to bandwidth limitation of the wireless communication [3], [8], [9]. The intuitive solution is to analyze and filter the data on-board and then transfer the generated knowledge to ground stations for further processing and analysis by human experts. Another motivating application is analyzing data generated in sensor networks. The same analogy is applied with the additional constraint that sensor nodes consume their energy rapidly with data transmission [2]. Analyzing data onboard sensors is a valid and possible solution to preserve energy consumption resulted from data transmission over wireless communication links.
Mining data streams is a field of increase interest due to the importance of its applications and dissemination of data stream generators. Most of the streaming techniques developed so far have not addressed the need of resource-aware computing in data stream analysis. The fact that streaming information is often generated or received onboard resource-constrained computational devices such as sensors and mobile devices motivates the need for resource-awareness in data stream processing systems. In this paper, we propose a generic framework that enables resource-awareness in streaming computation using algorithm granularity settings in order to change the resource consumption patterns periodically. This generic framework is applied to a novel threshold-based microclustering algorithm to test its validity and feasibility. We have termed this algorithm as RA-Cluster. RA-Custer is the first stream clustering algorithm that can adapt to the changing availability of different resources. The experimental results showed the applicability of the framework and the algorithm in terms of resource-awareness and accuracy.
The last two cases represent the need for on-board data analysis. Data received in resource-constrained environment represents a different category of applications. With the dissemination of Personal Digital Assistants PDAs, users might request sheer amounts of data of interest to be streamed to their mobile devices. Storing and retrieving these huge amounts of data are also infeasible in such an environment. Filtering and analyzing this data would be of a high interest to the user.
Keywords
Resource-aware Computing, Clustering, and Data Streams.
The above cases and others stimulate the need for data stream mining in resource-constrained environments. Most of the techniques developed so far have addressed the research issue of resource constraints with regard to the current status of the data rates through load shedding. There is an urgent need for techniques that can adapt to resource availability with regard to different factors that can preserve the scarce resources.
1. INTRODUCTION
The advances in data acquisition hardware and the emergence of applications that process continuous flow of data records have led to the data stream phenomenon. With applications varied from business to scientific to industrial ones, data stream querying and analysis have attracted researchers from different disciplines over the past few years. Systems, techniques, and strategies [6] have been proposed and implemented for data stream processing.
In this paper, we propose a generic framework to resourceaware data stream mining. The idea is to periodically change algorithm settings from the input, output, and/or processing end points. We term the input settings as Algorithm Input Granularity AIG. AIG is represented in sampling, load shedding, and creating data synopsis techniques. Algorithm Output Granularity AOG represents the output settings. Strategies for AOG include number of knowledge structures created or level of output granularity. Algorithm Processing Granularity APG is concerned with changing the processing settings of the algorithm itself to consume smaller amount of resources, e.g., changing the error rate of approximation algorithms. Changing the above settings is done according to the resource consumption pattern measurements over the last time frame and a measure of resource criticality.
Data streams are mostly generated or sent to resourceconstrained computing environments. Data generated on-board astronomical spacecrafts are one of the important examples. The sensing equipments on-board these crafts generate huge Permission to make digital or hard copies of all or part of this work for personal or classroom use is granted without fee provided that copies are not made or distributed for profit or commercial advantage and that copies bear this notice and the full citation on the first page. To copy otherwise, or republish, to post on servers or to redistribute to lists, requires prior specific permission and/or a fee. SAC’06, April 23–27, 2006, Dijon, France. Copyright 2006 ACM 1-59593-108-2/06/0004…$5.00.
649
The strategy has been applied to a micro-clustering algorithm we have termed as Resource-Aware Clustering, RA-Cluster. RA-Cluster is the first threshold-based micro-clustering algorithm designed to adapt to resource availability using algorithm granularity settings. Clustering streams of data is considered as a means to compress and summarize the data for further analysis that could be done offline [1]. Online stream clustering has been termed by Aggarwal et al. as microclustering. Evaluation of the proposed technique has been done in two directions. Resource awareness using adaptation has been evaluated for memory, battery, and CPU utilization. The effect of using the adaptation techniques over the output accuracy has been measured. The algorithm and the framework show scalability with the high rates of the streams under scarce resources. Our experimental studies showed that this scalability has only a very low impact on the result accuracy. This provides us a robust and adaptable algorithm that is aware of the current conditions of resources and performs accordingly.
run a clustering algorithm on stock market data streams and the computational device is running out of memory, the user would prefer to continue the analysis process with less but acceptable accuracy due to the infeasibility of the high accuracy. This is because of resource constraints. We can conclude that resource monitoring is the ideal solution to this problem. Resource availability measurements could be done periodically and accordingly change the algorithm settings. This process introduces two main components: resource consumption patterns and algorithm settings. Resource consumption patterns represent the change in resource consumption over a period of time which we term as time frame. The algorithm settings are the input, output, and processing settings of a mining algorithm that could be changed over time to cope with the availability of resources and current data rate. Algorithm settings could be classified as follows: Algorithm Input Granularity (AIG): It represents the process to change the data rates that feed the algorithm. The following are the definitions of techniques under this class: • Sampling: Sampling is the process of statistically choose some data records to be processed. • Load shedding: Here, we use load shedding to represent the process of dropping a chunk of data records from being processed. This could be an appropriate technique to stop the processing to enable some optimization process to be done during this time. It is considered to be a direct solution if there is a burst in data streams. We can shed the load and continue the processing after the burst. • Creating data synopsis: This is the process of summarizing or compressing the incoming data on the fly before it is being processed. Wavelets and simple statistical summarization techniques represent the typical strategies in this category. It should be noted that the process of creating this synopsis of data should be a lightweight process compared to the mining technique that will use them. Algorithm Output Granularity (AOG): It is the process of changing the output size of the algorithm in order to preserve the limited memory space. In case of data mining, we refer to this output as number of knowledge structures. For example number of clusters or rules. The output size could be changed also using level of output granularity which means the less detailed output, the higher the granularity and vice versa. Algorithm Processing Granularity (APG): It is the process of changing the algorithm parameters in order to consume less processing power. Randomization and approximation techniques represent the potential solution strategies in this category. It should be noted that there is a collective interaction among the above three. AIG mainly affects the data rate and it is associated with bandwidth consumption and battery. On the other hand, AOG is associated with memory and APG is associated with processing power. However the change in any of them affects the other resources. The process of enabling resource awareness should be very lightweight in order to be feasible in a streaming environment characterized by its scarcity of resources. Our technique is concerned with direct interaction between these techniques and resource consumption patterns. However the indirect interaction is also implicitly included as it will be discussed in section 5. The main objective of the direct interaction is to simplify the adaptation process. The adaptation
The paper is organized as follows. Section 2 reviews the related work in stream mining. A background about concepts and terminologies used within our frameworks is provided in section 3. Section 4 discusses the system architecture with a brief description of the functionalities of each component. Section 5 presents RA-Cluster algorithm that incorporates the resourceawareness framework. Experimental results are presented and discussed in section 6. Finally we conclude the paper and present the possible future research directions in section 7.
2. RELATED WORK
Data stream mining techniques have attracted the attention of data mining community over the past few years. Gaber et al. have reviewed these techniques thoroughly in their survey paper in [6]. Threshold-based clustering algorithms have been introduced in BIRCH algorithm [11]. Recently CluStream [1] and LWC [5] use a variation of BIRCH with different structures to be adapted to streaming environments. Resource-awareness in data streams has been studied in the literature in both mining and querying of data streams. Input adaptation using load shedding and data synopsis creation using wavelets have been proposed in [4], [10] respectively. However these techniques have not proposed a generic framework that combines all the possible adaptation strategies in a holistic framework that is capable to adapt to variability of different resource availability over time. Onboard analysis of data streams has been studied in [3], [8]. It has been pointed out in these studies that data generation would exceed the bandwidth to transfer these streams of data to ground stations for analysis. They necessitate the need for onboard analysis of data streams.
3. BACKGROUND
Computational resources that are affected by stream mining settings are memory, processing cycles, communication bandwidth and battery. As previously discussed, in a streaming environment we face with the challenges of resource constraints of devices that emit or receive data streams. Stream mining algorithms are typically linear or sub-linear algorithms that are characterized by being space efficient. Current state-of-the-art of these algorithms reveals that they are not designed with regard to adaptation to resource availability. For example, if we
650
technique is mainly an iterated process that is repeated over fixed time frames. Having discussed the basic concepts that compose our framework, the following section depicts the big picture of this framework.
The above algorithms use some threshold as a way to develop a one-pass algorithm that can be adapted. We propose RA-Cluster that combines resource-awareness, adaptation and real-time all in a holistic approach. The process starts with using an initial threshold to run the algorithm and after a fixed time frame. We assess the resource consumption patterns of the CPU, memory, and battery given that we run in a resource constrained environment. According to the above assessment, the algorithm settings are changed to cope with the data rate. In the following subsections, we show the used notation in the algorithm and the resource-aware framework followed by RA-Cluster algorithm and strategies of algorithm settings’ adaptation respectively.
4. THE PROPOSED FRAMEWORK
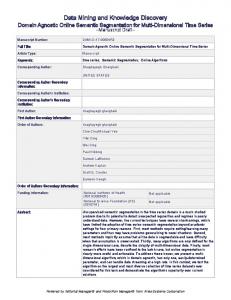
Figure 1 shows a simplified system architecture of our framework that shows the workflow within the system. The system is composed from the following components: resource monitoring, algorithm granularity settings, and the mining technique. The following is a description of each component. Resource monitoring: is the component responsible for computing all the required statistical measurements about resource consumption over the most recent time frame. This process is done periodically over fixed time frames. The resources that are required to be monitored are: memory, CPU, and battery. The measurement of each of these resources is given in details in the following sections. Algorithm granularity settings: is the change in AIG, AOG, or APG parameters according to the output of the resource monitoring component. This change is done according to the pattern of resource consumption and the status of the resource in terms of degree of availability. Mining algorithm: is the mining technique that adapts to AG settings. In our case, we use our resource-aware clustering RACluster. However any mining algorithm could be adopted to enable resource-awareness using this framework.
5.1 Notation
RA-Cluster is an incremental online micro-clustering algorithm that has all the required parameters to enable resourceawareness. The following symbols and their corresponding definitions are used to define our proposed algorithm and the framework. DS: a Data stream. NoFBatt, NoFMem, NoFCPU: estimated number of time frames to consume the remaining battery, use up the available memory, and fill up CPU processing with unprocessed data items accumulated from previous time frames, respectively, under the current data rate. RTMem, RTBatt, RTCPU: These are the memory, battery and CPU consumption thresholds, respectively, representing critical situation that resource adaptation action needs to be done to the corresponding component. Radiushreshold: threshold value on the radius of a microcluster.
Resource Monitoring
Using the above symbols, a full description of our proposed algorithm and adaptation framework are discussed and formalized in the following subsections. In addition to these parameters, each micro-cluster maintains certain summary statistics on the micro-cluster similar to those in [1].
Algorithm Granularity Settings
Mining Algorithm
5.2 Algorithm Description
Figure 1. System Architecture
RA-Cluster is a threshold-based algorithm that adapts the algorithm settings over fixed time frames according to resources consumption patterns in the most recent time frame. The time frame should be determined by the user given that the longer the time frame, the less the resource-awareness overhead. On the other hand we might face the problem of dramatic change in resource consumption and the algorithm runs out of one or more of these resources. In contrary, the shorter the time frame, the higher the resource-awareness overhead, but at the benefit of being more able to handle the dramatic resource consumption changes. Figure 2 depicts the RA-Cluster algorithm.
The big picture of the adaptation framework is presented in this section. The following sections provide detailed discussions about each of these components and how it has been implemented and evaluated.
5. RA-Cluster ALGORITHM
Threshold-based algorithms represent a family of clustering techniques characterized by being online. The first thresholdbased algorithm was BIRCH [11]. The main objective behind the technique is to let the results of a very large datasets to fit into the memory. It uses an initial threshold that can be adapted if the algorithm runs out of memory. It stores statistical measures about each cluster that are enough to update the results that are represented in a tree structure. Recently, BIRCH was adopted in a new algorithm called CluStream [1] which uses the same structure with other features added to the cluster information in order to be adapted to the streaming environment.
To fully understand the proposed algorithm, we need to discuss the algorithm adaptation settings that represent the main part of the algorithm. The adaptation of these settings according to resource consumption patterns and its formalization are given in the following subsection.
5.3 Algorithm Granularity Settings
651
The adaptation strategies are concerned with different resources and their affecting parameters. These parameters have an interaction in their effects on resources. The procedure of adaptation starts with resource assessment of memory consumption, CPU demand and remaining battery charge. The adaptation starts with memory and according to the pattern of consumption, the threshold value (Radiusthreshold) on the micro-cluster radius (i.e., the maximum distance to the cluster center) of the algorithm is changed to encourage or discourage the creation of new micro-clusters. Increasing that threshold will discourage the formation of new micro-clusters. Two main factors affect the memory consumption: sampling rate and new clusters created over the last time frame. Outlier detection to free memory is done before calculating the new threshold in order to keep the threshold change as low as possible. The outlier detection is done using a novel approach that depends on the size of the already created clusters. Given an outlier selection factor that represents the minimum ratio between the number of points in the smallest and largest micro-clusters, all the micro-clusters that are less than that factor and are also inactive are removed. A micro-cluster is considered to be inactive if there is no new data points assigned to it in the recent time period. Also a dormant micro-cluster that does not receive new data points for a while will be thrown away, even if it contains many data points. This process of memory adaptation is followed by CPU demand adaptation.
micro-clusters to be examined is made randomly based on the randomization factor. This process is done according to the change in the demand pattern of the CPU. When the randomization factor is equal to 1 during low load condition, it means all micro-clusters will be examined to make the microcluster assignment for the newly arriving data point. As the load condition increases, the randomization factor will be reduced so only a fraction of the current micro-clusters will be (randomly) selected as candidates for the new data point to join. By cutting down the number of micro-clusters examined during the assignment process, we reduce the CPU consumption. Certainly, this may lead to a sub-optimal assignment as the closest microcluster to the data point may not be selected by the randomization process. The lower the randomization factor, the more likely the miss is going to occur. Nonetheless, even if the nearest micro-cluster is not selected, the data point will get assigned to a reasonably closed micro-cluster. As we shall see in the experimental section, the effect of suboptimal micro-cluster assignment on the final clustering results tends to be minimal. Followed this process, the battery adaptation is performed. The main factor that affects the battery is the receiving or emitting of data streams. The adaptation is done by changing the sampling rate according to the pattern of change of the battery consumption over the most recent time frame. This procedure has three main features that bound the accuracy loss of the adaptation process: 1- For all the adaptation factors, including the algorithm threshold value on micro-cluster radius, randomized microcluster assignment factor, and sampling rate, we have a lower and upper bound settings. Among the upper and lower bounds, one of them is implied: for sampling rate and randomized factor, 1 is the upper bound and for micro-cluster radius, the mean distance to the center is the lower bound. The other bounds are referred to as adaptor threshold bounds that need to be set by the user. When any of the adaptor factors reaches its threshold bound, it will not go beyond that value. By providing these bounds, we can limit the accuracy loss due to the adaptation process.
Repeat Repeat Get next DS record DSRec Find ShortDist which is the shortest distance between DSRec and micro-cluster centers If ShortDist < Radiusthreshold Assign DS record to that micro-cluster Update micro-cluster statistics Else Create new micro-cluster End Until (END-OF-TIME-FRAME) Calculate NoFMem, NoFCPU, NoFBatt If NoFMem < RTMem Reclaim outlier memory Increase Radiusthreshold (discourage micro-luster creation) ElseIf if available memory increases Decrease Radiusthreshold (encourage micro-cluster creation) End If NoFCPU < RTCPU Decrease randomization factor (less processing per unit) ElseIf unused CPU power increases Increase randomization factor (more processing per unit) End If NoFBatt < RTBatt Decrease sampling rate (slower consumption pattern) ElseIf remaining battery life increases Increase sampling rate (faster consumption pattern) End Until (END-OF-STREAM)
2- The adaptation process is done only if the resource is currently started to be in its critical consumption pattern. That means if the resource would continue in the same consumption behavior, the application will run out of the resource after a prespecified small number of time frames. Once the resource is characterized by this feature, the adaptation process starts. At the other hand, once we have freed up some resources, the process starts to restore the parameters in order to get the highest possible accuracy.
Figure 2. RA-Cluster Algorithm To assess the CPU demand, we use the ratio of the number of input records sampled to that of records processed in a given time period. Here the sampled records mean the records from the data stream that get received and processed, while the other records are dropped. The higher that ratio is, the higher the overloading will be. It has to be noted that this also affects the memory consumption as pointed out before. The CPU demand is considered to be balanced if the numbers of sampled records and processed records over a time frame are equal. The strategy of adapting the CPU demand is done using a novel approach that we term Randomized assignment. When making the microcluster assignment for a new data point, only a pre-specified fraction of the current micro-clusters is examined. The choice of
3- Outlier detection and elimination process is an adaptation strategy that in addition to its function of freeing up memory, it contributes to solving the outlier problem in online clustering. 4- The data streams are often evolving over time. Eliminating inactive micro-clusters is essential to catch the dynamics of data streams. We use this approach to identify the outliers and adapt to memory availability. That means we can get better accuracy using the adaptation process.
652
6. EXPERIMENTAL RESULTS
100
The algorithm was developed using Matlab 7.0.4.365, we run the experiments on a Pentium 4 with 3.00 GHz CPU and 504 MB of RAM. The resources were measured using special routines to simulate the scarce resource availability of small devices such as PDAs and sensors. We used both synthetic and real-datasets to run the experiments. Synthetic datasets are generated with 10,000 data points, where each data point has 3 features generated randomly with normal or uniform distributions with different domains of continuous variables around some randomly selected cluster centers. Each dataset is mapped onto a data stream with varying data rates, where the data rate at each time period is determined by a base rate multiplied by a scale factor 0.5/r which r is a uniformly distributed random number between 0 and 1. This would certainly cause some period to be with very high rate regardless of the average rate. We also used a real astronomical dataset to validate the idea: shuttle dataset from UCI Machine Learning Repository [7]. It has 43500 records with 9 continuous attributes. There are two main objectives for running these experiments:
Remaining memory
80
60
40
RA-Cluster
20
Without Adaptation 0
-20 0
50
100
150
200
250
300
Time
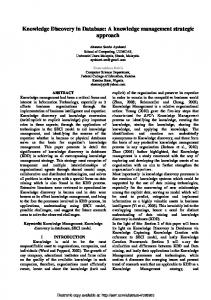
Figures 3. Remaining Memory over Time 1
Remaining battery
RA-Cluster
a) Assessment of resource-awareness: that is to show that running the algorithm with adaptability can scale up with scarce resources which form the typical environment of streaming systems as discussed earlier. To achieve this objective we run the experiments over the real dataset and observe the resource consumption over time.
0.9
Without Adaptation
0.8
0.7
0.6
0.5
b) Loss of accuracy: that is to assess the accuracy loss due to the adaptation process and show that it provides us with similar results compared to applying the kmeans over the dataset directly in batch mode. Furthermore, we compare RA-Cluster with load shedding and static micro-clustering algorithm. We also show the effect of relaxing the threshold bounds of the algorithm settings over the result accuracy.
0.4 0
200
400
600
800
1000
1200
1400
1600
1800
Time
Figures 4. Remaining Battery over Time 1
Randomization Factor
0.98
6.1 Resource-awareness Assessment
The assessment of memory, battery, and CPU is given in details based on the real dataset. As mentioned before, the data rates are changed randomly up and down at the beginning of each time frame. High data rates affect the memory in two ways: increase the number of micro-clusters or the need to store the data that could not be processed by the algorithm during the time frame. Data rates affect the battery in a direct way. The more data the device receives the higher the consumption of the battery will be. High data rate increases the CPU utilization and can result in some of the data items not being able to be processed in time. The adaptation strategies discussed in the previous section have been applied to cope with the variability of the data rates. Figure 3 shows the memory consumption. When disabling our memory adaptation module, memory runs out quickly. However, when we apply the proposed strategy, it shows the effect of adaptability on the memory consumption pattern. Similarly, Figures 4 shows the battery consumption without and with adaptation. The proposed strategy is able to better maintain the battery life. Figure 5 shows the randomization factor over time in order to keep the CPU as highly utilized as possible while keeping up with the sampling rate under varying data rates. It shows that only during critical time the randomization factor dropped under average.
0.96 0.94 0.92 0.9 0.88 0.86 0.84 0.82 0.8 0
100
200
300
400
500
600
700
800
900
Time
Figure 5. Randomization Factor over Time The above results provide evidence of adaptation over time. The tradeoff of the adaptation process and output accuracy is an important issue that needs to be assessed to prove the validity of the approach.
6.2 Accuracy Assessment
Creating online micro-clusters is mainly used to summarize the incoming data followed by further analysis over these created compressed structures [1]. We run kmeans clustering over the output of the online micro-clustering results and compare it with the case using kmeans over the whole dataset directly. The latter
653
one provides the true answer corresponding to the case without resource constraints and the need for resource adaptation. Figure 6 shows the running of this experiment over synthetic datasets. We picked one of the attributes and showed the attribute values of the 10 clusters under kmeans for the RA-Cluster and that over the whole dataset directly. Similar results are observed for other attributes. The x-axis is the cluster index, where the clusters are indexed according to increasing attribute values of their cluster centers, while the y-axis is the attribute value of the cluster center, where the centers are equally spread. Figure 6 clearly shows that the clustering results to create 10 clusters using kmeans over our approach leads to very similar results with the traditional kmeans over the whole dataset directly. This indicates that our adaptation strategies can provide similar results to the case when re-clustered offline with no resource constraints. We have also measured the quality using result deviation with a gradual relax of the threshold bounds of the adaptation factors. Relaxing these bounds will provide greater adaptability to resource constraints, but can also reduces accuracy. During the relaxation process, for the sampling rate and randomized factor, we reduce their bounds from 0.9 to 0.5, while for the radius threshold, the increase will be from 2 to 4 times of the initial value. For each case, we run the experiments 20 times with the same adaptation thresholds. Each time the experiment is run on a different synthetic dataset. We then relax these threshold bound parameters gradually and run the experiment for the same number of times. The generated microclusters were passed to the kmeans algorithm and the average result deviation over the different clusters was computed. For each cluster, the result deviation was calculated as the sum of the normalized deviation along each dimension averaged over the number of dimensions, where the normalized deviation along a dimension is obtained by dividing the difference of the cluster center values (between the one using kmeans over microclustering and the true one calculated by kmeans over the whole dataset) by the spread of the true cluster along that dimension. The results are shown in Figure 7. It shows that the result deviation is increasing with relaxing the threshold bounds; however the result deviation is still low.
0.1
Result deviation
0.09
0.07
0.06
0.05
0.04
0.03 1
2
3
4
5
6
7
8
9
10
Relaxing in threshold bounds
Figure 7. Result Deviation with Relaxing of the Threshold Bounds We run an additional set of experiments to compare RA-Cluster with the load shedding approach which could be viewed as an intuitive solution in the streaming environment [4]. We use the synthetic data, but with an additional change to stress test the robustness of the different algorithms. Here during the bursty time periods with high data rates, a small fraction (10%) of the data is replaced with data generated from some new cluster center not appearing during the other non-bursty periods. This corresponds to the typical situation in data streams, where the data during bursty periods may show different characteristics. An example will be in a flow of IP addresses for an intrusion detection application, where the burst represents a possible intrusion, thus with different characteristics. We have run the experiment for 10 cases with the same settings of algorithm adaptor threshold bounds for each case and calculated the average result deviation over the identified clusters. This experiment has been repeated over a gradual relaxing of the threshold bounds as in the previous example. Each point in the curve represents a case with 20 runs under 20 different synthetic datasets with the same threshold bound settings. Figure 8 shows the results where the upper curve represents the load shedding performance and the lower curve represents RA-Cluster over the same datasets. It shows that RA-Cluster outperforms load shedding by a wide margin under different settings of adaptor threshold bound.
150
RA-Cluster Traditional K-means
0.24
100
0.22
Result deviation
Cluster center value
0.08
50
0
-50 1
2
3
4
5
6
7
8
9
10
0.2
0.18
RA-Cluster
0.16
Load Shedding
0.14
0.12
0.1
0.08
Index of clusters
0.06 1
2
3
4
5
6
7
8
9
10
Index of different runs
Figure 6. Result Deviation as Compared with Kmeans
Figure 8. RA-Cluster and Load Shedding Accuracy over Time
654
To study the effect of data rates over the algorithm accuracy, Figure 9 shows that the robustness of the RA-Cluster, where the upper curve represents the average normalized data rates and the lower one represents the deviation measure over time. Not unless the data rate is extremely high, there is little impact to the accuracy. The higher the data rate, the lesser the accuracy will be, however not with the same pace.
where the upper curve represents the deviation from the static micro-cluster algorithm and the lower one represents RACluster algorithm. That is because the memory adaptation can recognize the outliers and inactive micro-clusters and release them from memory. The most recent results are therefore always represented in the micro-clusters maintained by RACluster. However the static micro-clustering does not take care about the history of the stream and the outdated micro-clusters.
Result deviation & data rate
18
The above experiments prove that adaptability to resource availability is achievable with highly acceptable performance results. These results open a new view to the area of adaptation. Algorithms in the streaming environment should be designed with sensibility to availability of resources in order to scale and perform efficiently in such a resource constrained environment.
16
14
12
10
8
7. CONCLUSION
6
4
Result Deviation
2
Normalized Rate
0 1
2
3
4
5
6
7
8
In this paper, we have proposed a generic framework to enable resource-awareness in data stream mining. This feature is essential due to two facts: (a) the unpredictability of the data stream rate; (b) the resource constraints of streaming environments. The proposed approach tracks relationship between the resource consumption patterns and algorithm granularity settings that include input, output, and processing settings. The settings are bounded to limit the accuracy loss due to the adaptation process. Adaptation strategies used include: algorithm threshold on micro-cluster radius, outlier removal, randomized assignment, and sampling rates. The framework has been implemented using RA-Cluster algorithm. The experimental results show the feasibility and validity of the approach.
9
Time
Figure 9. The Effect of Data rates over RA-Cluster accuracy 1.4
Result deviation
1.2
1
8. REFERENCES
0.8
[1] C. Aggarwal, J. Han, J. Wang, P. S. Yu, A Framework for Clustering Evolving Data Streams, Proc. of VLDB 2003. [2] R. Bhargava, H. Kargupta, and M. Powers, Energy Consumption in Data Analysis for On-board and Distributed Applications, Proc. of the ICML 2003 workshop on Machine Learning Technologies for Autonomous Space Applications. [3] B. Castano, M. Judd, R. C. Anderson, and T. Estlin, Machine Learning Challenges in Mars Rover Traverse Science, Proc. of the ICML 2003 workshop on Machine Learning Technologies for Autonomous Space Applications. [4] Y. Chi, P. S. Yu, H. Wang, R. R. Muntz, Loadstar: A Load Shedding Scheme for Classifying Data Streams, Proc. of SIAM SDM 2005. [5] Gaber, M, M., Zaslavsky, A., and Krishnaswamy, S., A Cost-Efficient Model for Ubiquitous Data Stream Mining, Proc. of IPMU 2004. [6] Gaber, M, M., Zaslavsky, A., and Krishnaswamy, S., Mining Data Streams: A Review, ACM SIGMOD Record, Vol. 34(2), June 2005. [7] Hettich, S., Blake, C.L., Merz, C.J. UCI Repository of machine learning databases, 1998 [8] A. Srivastava and J. Stroeve, Onboard Detection of Snow, Ice, Clouds and Other Geophysical Processes Using Kernel Methods, Proceedings of the ICML’03 workshop on Machine Learning Technologies for Autonomous Space Applications
0.6
RA-Cluster
0.4
Static Microclustering 0.2
0 1
2
3
4
5
6
7
8
9
Time
Figure 10. RA-Cluster over Evolving Data Stream Another set of experiments has been performed to show how RA-Cluster responds to the evolving nature of the stream. We created a composite stream dataset which is a concatenation of 9 different synthetic datasets with different imbedded clusters. Each time period is covered by a different dataset. Hence the micro-clusters will change drastically when moving from one time period to another. For comparison, we run the experiments with all the adaptation strategy disabled and measure the accuracy of the results using the above accuracy measure over time. This is referred to as the static micro-clustering, where no time based micro-cluster elimination is performed as in RACluster. We also run the experiments over the same stream using RA-Cluster. We then run kmeans over each of these result datasets. At each time, we compare the results between the RACluster and static micro-clustering. Figure 10 shows that RACluster outperforms the static micro-clustering substantially,
655
[9] S. Tanner, M. Alshayeb, E. Criswell, M. Iyer, A. McDowell, M. McEniry, K. Regner, EVE: On-Board Process Planning and Execution, Earth Science Technology Conference, Pasadena, 2002
[10] W. Teng, M. Chen, and P. S. Yu, Resource-Aware Mining with Variable Granularities in Data Streams, Proc. of SIAM SDM 2004. [11] T. Zhang, R. Ramakrishnan, and M. Livny, BIRCH: an efficient data clustering method for very large databases. SIGMOD Record, vol. 25(2), June 1996.
656