May 5, 1990 - IEEE TRANSACTIONS ON SOFTWARE ENGINEERING. VOL. 16, NO ... pared to the relevant rules in engineering graphics. We also outline fhe.
IEEE TRANSACTIONS ON SOFTWARE ENGINEERING. VOL. 16, NO. 5. MAY 1990
543
A Framework for the Automated Drawing of Data Structure Diagrams CHEN DING
AND
PRABHAKER MATETI,
Abstract-Data structure diagrams are two-dimensional figures made up of lines that aim to pictorially indicate the interrelatiomM elements of a data structure. This paper collects the various ru factors of aesthetics that go into the way we draw data struct grams. We formulate the various subjective factors into computable objectives and numeric parameters. These are dis number of data structure drawings as found in var reveal that the rules used have not reached a level pared to the relevant rules in engineering graphics. We also outline fhe internal architecture of a (sub)system that we are building that helps draw data structure diagrams.
Index Terms-Aesthetics, data structure diagrams, documentation systems, line drawings, visual debugging.
1. INTRODUCTION
A picture is worth a thousand words.
I
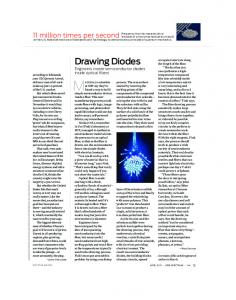
T is unlikely that there are any English-speaking adults who have not heard the above sentiment. Designers of all disciplines throughout the ages have always graphically sketched before proceeding to symbolic or language-oriented expression of their ideas. The sketches of Leonard0 da Vinci and those found in the book Programmers at Work [29] are but two modern examples. Diagrams help us form clear and “correct” mental images of the structure and function of the design of an artifact. Diagrams are often easy to understand and convey the essence of an idea far more quickly than do prose with mathematical expressions. They transcend the differences among cultures and languages. Accurate and meaningful drawings of objects are an integral part of training in all engineering fields and one finds extensive literature on the subject (e.g., [18]). In the context of programming, diagrams appear in various guises, such as data structure diagrams, block diagrams, histograms, structure charts, and flow charts. Pedagogy: Programming texts contain numerous line drawings that depict the abstraction implemented by a concrete data structure (Fig. 1). These data structure diagrams help us concentrate on concepts and quickly explain key operations. It is a rare book on computer science that does not have any diagrams. Manuscript received January 17, 1989; revised October 15, 1989. Recommended by C. G . Davis. The work of C . Ding was supported by the K. C. Wong Education Foundation of Hong Kong. C. Ding is with the Department of Computer Engineering and Science, Case Western Reserve University, Cleveland, OH 44106. P. Mateti is with the Department of Computer Science and Engineering, Wright State University Research Center, Kettering, OH 45420. IEEE Log Number 9034389.
MEMBER, IEEE
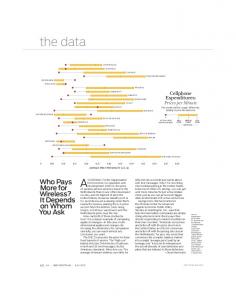
Debugging: In debugging, pictorial representations of data often make it easier to locate problems and reasons for them [25], [34]. Program Understanding: Dynamic properties of programs may be understood through animated diagrams in animation systems [22], [lo], [ 121, [311. They pictorially display the contents of interesting variables and update the display as the values change. Program Design: During the exploratory period that precedes detailing the chosen design, people draw pictures of the data structures they are considering, and various other diagrams that capture the architecture of the system. [32] is a book on such diagrams and their conventions. Program Visualization is an emerging area [2 11, [28], [39], [48], [53] that brings picturization to various activities of programming. Visual Programming researchers [9], [ 111, [ 141, [ 191, [41], [45] advocate programming via pictures. Pictorial support for activities other than programming are also receiving wide attention [6], [7], [81, [131, [361, [471, [511. Even though diagrams are used widely in programming, only a few papers consider the systematic drawing of them, and address topics such as 1) what makes the displays look pleasant or unpleasant, 2) how to draw diagrams aesthetically and automatically, 3) how do diagrams affect our productivity. Traditional fields have developed standards for their drawings (e.g., [18], [2]). Diagrams of data structures are drawn quite variedly, and, more often than not, by hand. Sometimes the pencil-andpaper is replaced with mouse-and-screen, and instead of actually drawing them we may write other programs (in languages such as pic [26]) that drive a device to draw them, but it is essentially a manual process. Manually drawn diagrams are problematic [20], [2 11, [27], [341 in producing, maintaining, communicating, and documenting them which in turn make it practically impossible to take full advantage of using pictures in programming. Automatic drawing of good looking diagrams is a surprisingly difficult task [6], [50].The difficulty is partially caused by the fact that a diagram of a data structure is determined not only by its declaration, but also by its intended usage. For example, a variable declared as an array may be understood in different ways: as an ordinary array [Fig. 2(a)], a stack [Fig. 2(b)], a binary tree [Fig. 2(c)], a ring [Fig. 2(d)], a hash table [Fig.2(e)], and so
0098-5589/90/0500-0543$01.OO
0 1990 IEEE
544
IEEE TRANSACTIONS ON SOFTWARE ENGINEERING, VOL. 16. NO. 5 . MAY 1990
(cr)
[Reingold and Hansen 19831
[Standish 19831
Y-J [Standish19831 Fig. 1 . Examples of diagrams.
(e) (d) Fig. 2. Different applications need the diagrams to be drawn differently.
on. This problem does not disappear with modern programming languages supporting abstract data types either
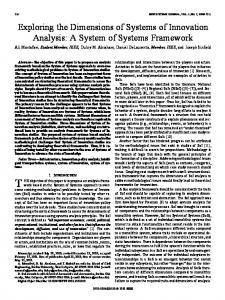
WI. Another reason for the difficulty is that aesthetics is a highly subjective matter. People with different education levels and cultural backgrounds have different aesthetic tastes. Researchers in VLSI, for example, draw graphs using boxes and straight or angular lines (Fig. 3) while
Fig. 3. Traditional way of drawing is also important in understanding diagrams.
those in the graph theory area draw edges as curves or straight lines, and nodes as circles or ellipses. Aesthetic rules exist in drawing diagrams [34], [52]. To reduce the visual complexity of a diagram, for example, good diagrams are typically drawn with few edge crossings and geometrically short paths. People use such rules, perhaps unconsciously, to guide and simplify the drawing
DING AND MATETI: DRAWING DATA STRUCTURE DIAGRAMS
and the process. Finding these rules and coding them will make it possible to build a system to automatically draw (in most cases) pleasing pictures. In this paper, we study issues relating to the automation of the process of drawing data structure diagrams. We contribute a framework in which different tastes of what makes a diagram look good, etc. can be discussed. We formulated some commonly-used rules which are obtained by examining diagrams in many textbooks on data structures, computer programming, and algorithm design. We also examine the feasibility of implementations based on these rules. 11. TERMINOLOGY A data structure diagram (DSD) is a pictorial representation of the underlying data structure. Just as sentences of a language can be studied at three levels-words, syntax (grammar), and semantics-we can study diagrams at three corresponding levels: figure elements, figure objects, and meaningful diagrams. The terminology that we need to discuss these matters is still evolving. We offer the following as strictly tentative suggestions for the purposes of this paper. A . Figure Elements
AJigure element is a member of a small set of geometrically defined open and closed curves. Some commonly used figure elements are shown in Fig. 4.Figure elements correspond to words in languages, but they are two-dimensional objects. They represent the smallest semantically meaningful elements in a display of data structures. An arrow, for example, consists of two geometrical entities: head and tail. It semantically represents a pointer. Its tail (or head) alone does not represent the semantics of a pointer. Thus, an arrow is a figure element whereas its head or tail, by themselves, are not. Conceptually, a figure element is an abstract object that captures certain attributes of the elements of a diagram. No rigid notions of dimensions, geometrical shapes, color or fill-texture are associated with it. Attributes are such things as content, label, and descriptions of how the content is to be displayed.
B. Semantics of a DSD While words in a language may mean what we choose them to mean, diagrams do not have that liberty. They have to corroborate with the real objects they are depicting through shape resemblance, action simulation, abstract extension, etc. Traditional values must also be respected. Figure elements indicate semantics. For example, a square or a circle may represent a node, an ellipse a procedure, an edge a binary relation, an arrow a pointer, etc. Semantics so indicated is achieved through symbolisms. The semantics of figure elements are affected by so-called visual vocabulary [35]. Bertin [5] described six visual vocabulary: size, direction, texture, form, and color. Another indication of semantics comes from the layout of
545
0
Fig. 4. Samples of figure elements. connecting arc
I
(a) ib) Fig. 5 . The definition of turns: (a) smooth turn: (b) sharp turns
figure elements. For example, a hierarchical structure is represented by a tree or a layered graph, a ring buffer is represented by a ring of boxes, a linked list is represented by a linked list of boxes, etc. The intended semantics of a diagram dictates the “look” of a diagram. The way we draw a pointer, its origin, and target objects conveys considerable meaning. The traditional way of drawing is also important. For example, a tree drawn to satisfy certain unusual requirements may look quite different and be hard to recognize (Fig. 3).
C. Other Terms By the term “drawing a diagram,” we refer to the process by which the figure elements chosen for the data element are laid out to visualize the meaning of the data structure. “Automated drawing” implies that the process of drawing, sometimes guided by the user, is essentially done by the system. Legalistically speaking, any diagram can be generated automatically if we ignore aesthetics. But by “automated drawing” in this paper, we always mean automated drawing of nice diagrams, which is another story. A number of our rules regarding aesthetics deal with the way arrows and edges are drawn. A point on a curve is called a break point if the derivative of the curve is not continuous at that point. A turn consists of three (possibly empty) parts: two straight line segments and a connecting arc whose tangents at its two ending points are colinear with its two sides. A smooth turn has no break points; an angular turn does. The turn angle is defined as 1 a - 01, where a and 0 are the angles that the sides of the turn make (counterclockwise) with the x-axis (Fig. 5). We use the terms angular/smooth edge and arrow analogously. When the sides are missing, we draw tangents at the end points of the connecting arc and use them as the sides.
546
IEEE TRANSACTIONS ON SOFTWARE ENGINEERING. VOL. 16. NO. 5. MAY 1990
(b)
(a)
Fig. 6 . A comparison of the recognizability of the same diagram drawn in different ways.
The origin of an arrow is the far end of its tail, and its target is the sharp point of its arrow head. Analogously, we refer to the origin figure element and target figure elements of an arrow as the figure elements that the arrow connects. If two figure elements are connected by an (undirected) edge, then either can be called origin or target figure element. 111. WHAT MAKESA DIAGRAMLOOKGOOD? Webster’s English dictionary defines the word aesthetics as “a branch of philosophy with beauty and the beautiful especially with judgments of taste concerning them. This is a section about the aesthetics of data structure diagrams. The question “What is a good diagram?” is a highly subjective one. Different people and different areas have different answers to it. Also we prefer answers that are “potentially algorithmic. ” Factors such as visual complexity, regularity, symmetry, consistency, modularity, sizes, shapes, separation, and traditional ways of drawing affect our judgment of whether a diagram is good. We discuss these terms in greater detail in the subsections below. ”
A. Visual Complexity Visual complexity is a negative measure of the ease with which a diagram is communicated. The lower the visual complexity is, the easier the diagram is to understand. Visual complexity is not the same as geometrical complexity. For example, geometrically, Fig. 6(a) is complicated. But since the figure elements in it are well arranged, its connections are visually very clear: visually, it is simple. But, on the other hand, geometrical complexity has heavy impact on the visual one, particularly on figure elements. The simpler a figure element is, the faster it can convey its information and the simpler the diagram will be. Straight lines, for example, are better than curves (Fig. 7).
ulllma Fig. 7. Comparison of straight and angular lines
We are able to identify three factors-namely, ambiguity, recognizability, and geometrical complexity-that contribute to the visual complexity of a diagram. I ) Ambiguity: Often a diagram lends itself to misinterpretation and ambiguity (Fig. 8). 2) Recognizability is the ease with which the drawn object is recognized geometrically and semantically. There are two recognizing activities corresponding somewhat to microscopic and macroscopic views. a) Physical Recognizability: People usually do not have problems in identifying figure elements as long as they are neither “too big” nor “too small.” But improper drawings may still make the identifying process difficult. First, the lengths of edges are important for identifying. Generally, the shorter they are (up to a threshold), the easier they are to identify. Longer edges increase visual as well as geometrical complexity. Length becomes unimportant if it is short enough so that the entire edge falls into the focus of our eyes. The size of a node could also affect the complexity, but not as much as the lengths of edges. Straight lines are easier to follow than curves be-
541
DING A N D MATETI: DRAWING DATA STRUCTURE DIAGRAMS
l l lil
cally. For example, the structure regularity in G ( V , E ) defined in Fig. 6 can be expressed as:
+
Vi: V(edge ( i , ( i 1 ) mod edge ( i , ( i - 1 ) mod edge ( i ,( i + 4 ) mod edge(i,(i + 5 ) m o d edge ( i ,( i + 7 ) mod
12) E E & 12) E E & 12) E E & 1 2 ) ~ E & 12) E E &
and its display regularity can be stated as follows. The nodes in V ( G ) = { 1, 2, , n } are positioned equidistant on a circle and for i E V an edge is drawn between every pair of nodes
n
(d) Fig. 8 . Some examples of high misunderstanding possibility diagrams: (a) a chain is drawn like a binary tree; (b) the node represented by a box could be misunderstood as a special node; (c) too closely drawn arrows could cheat our eyes; (d) two diagrams are drawn together which could be misunderstood as one diagram.
cause the origin and destination of a straight line are more direct than those of curves (Fig. 7). b) Semantic Recognizability is the ease with which the interconnection patterns among figure elements of a diagram are visually recognized. Semantic recognizability is more important than the physical recognizability. The physical recognizability affects the semantic recognizability somewhat, but the layout of figure elements affects it the most (Fig. 6). 3) Geometrical Complexity: The first impression that a diagram makes is a geometrical one: the simpler it looks, the simpler its components are geometrically, the easier it can be understood. Factors affecting the geometrical complexity include the number of edges and nodes, the lengths of edges, and the sizes of nodes.
B. Regularity Regularity is an important feature of data structures and their displays. There are two types of regularity: structure regularity and display regularity. The structure regularity manifests in the connections of a subset of data elements of a data structure by being expressible in a mathematical way. Each element of this subset is connected to others in the subset by the connections defined by an expression. The display regularity is the visualization of the structure regularity. Regularity plays a very important role in improving the readability of complicated diagrams because regular interconnections are easy to recognize and remember. For example, it is easy to tell which node is connected to which in Fig. 6(a) compared to Fig. 6(b). Display regularity requires that figure objects be systematically arranged by certain patterns such that the underlying structure regularity can be formulated geometri-
+ + + + +
i, i 1 mod 12, i , i - 1 mod 12, i , i 4 mod 12, i , i 5 mod 12, i , i 7 mod 12, i, i 8 mod 12 To visualize what regularity there is, we first need to discover it from the underlying data structure. It is usually very difficult for an algorithm to discover it without being given some sort of hints. Then we need to find an appropriate way to present the regularity. This is achieved by using regular polygons or drawing the diagram in a systematic way: to place the nodes evenly along a circle, to draw the (sub)diagram symmetrically, etc. Although this is not as difficult as the first step, we must be careful since regularity can be represented in different ways (Fig. 3). A regular diagram is more beautiful when its figure elements are well-organized than when drawn randomly (Fig. 6 ) . Some diagrams are drawn in such a pleasing way that regularity is present “everywhere.” For example, Fig. 9 [23], [24] has isosceles triangles: (1, 2, 6 ) , ( 1, 6, 5 ) , (2, 3, 6 ) , ( 3 , 6, 4), ( 6 , 4, 5); parallelograms: ( 1 , 2, 3, 6 ) , (1, 2, 4, 5 ) , ( 2 , 6 , 4, 3), ( 3 , 4, 5, 6 ) ; trapezoid: (2, 3, 4, 5 ) .
C. Symmetry Symmetry is the correspondence in size, form, shape, and arrangement of figure elements on opposite sides of a plane, line, or point. It is also a kind of regularity (the regularity of form or arrangement with corresponding parts). Like regularity discussed above, it too conveys information more quickly, and makes displays more beautiful.
D. Consistency Consistency means that all figure objects which have the same connectivity and semantics and geometrical structure are drawn in the same way. In Fig. 10, for example, each node consists of figure elements for fields LLink, Info, and RLink and figure elements for pointers LLink and RLink. All the figure elements for LLink’s in Fig. 10 have the same meaning (they all are left pointers) and geometrical structure (they are all drawn as ar-
548
IEEE TRANSACTIONS ON SOFTWARE ENGINEERING. VOL. 16. NO. 5 . MAY 1990
Fig. 9. Good diagrams present regularity everywhere.
A
-
XI
xz
4
rows). It would have been inappropriate to draw the Llinks and Rlinks inconsistently. Consistency increases readability. In a diagram which contains nodes and edges, if all nodes are represented by rectangles and edges by lines with the same thickness, then when we read this diagram, all rectangles and lines are understood in the same way. But if a circle is used to represent one of the nodes or a line with a thicker line to represent one of the edges, then we expect them to be indeed different.
E. Modularity Modularity in diagrams refers to the construction of subdiagrams using some standard pattern or plan, thus reducing the number of linkages that a reader need consider. Modularity can be viewed as the dual of connectivity. Properties a modular display should have are: 1) figure elements that are semantically close are positioned close together; 2) figure elements in different subdiagrams are physically separated. Two principles are used in modular displays: coupling and cohesion. Coupling is aimed at reducing the number and types of interconnections that exist between two subdiagrams so that each subdiagram can be understood rather independently, thus reducing the visual complexity. Cohesion is aimed at keeping the relationship among semantically related figure elements in a single subdiagram. The stronger the binding is, the better is our perception of the entire diagram as a single entity.
F. Sizes Figure element and object sizes affect the appearance of a diagram directly. Large figure elements make diagrams awkward, while tiny ones are hard to read. Also, figure element sizes should be kept consistent. The consistency makes them not only beautiful, but also reduces the visual complexity. Factors that influence the choice of sizes include the size of the entire diagram itself, the num-
I
I ,i’ Fig. 11. Two perpendicular straight lines are easy to distlnguisHeven when they intersect. I
ber and kind of nodes, regularity, consistence, symmetv, etc.
G. Separations Line separation influences the degree of ease with which two lines are differentiated. The larger it is, the easier they can be identified. Large separation does not necessarily mean that lines are geometrically separated far away from each other. For example, two perpendicular straight lines are very easy to distinguish even though they intersect (Fig. 11). The portions of the lines that are quite far from each other do not affect the separation. It is determined only by those segments which are “close” to each other. In Fig. 12, the distance between points A and B in (a) and (b) is the same. But points other than A and B are quite far away from each other which tend to make the separation appear wider, while points other than A and B in (b) are closer to each other which make the separation seem narrower than the one in (a). H . Shapes We prefer to use standard figure elements such as regular polygons, circles, ellipses, trapezoids, and diamonds unless special figure elements are required. Figure element shapes should be kept consistent. Different shapes often have different meanings. For example, diamond nodes are usually used to represent decisions and circular
DING A N D MATETI: DRAWING DATA STRUCTURE DIAGRAMS
:I
Fig. 12. Line separation is affected by its surrounding points.
nodes represent rules in AI. If no special meaning is implied, it is advisable not to use different shapes for the same kind of nodes.
I. Traditional Ways of Drawing People understand diagrams better when diagrams are drawn in a familiar way. The familiar ways are affected by the traditional ways of drawing. So sticking to the traditional ways of drawing will decrease the possibility of being misunderstood (Fig. 3). IV. AESTHETICOBJECTIVES, FACTORS,AND RULES It is commonly believed that people use certain aesthetic rules in drawing graphs. They learn these rules by experience and use them intuitively. Finding these Ales and coding them into algorithms is a key step towards the automated drawing of data structures. We endeavor to formulate rules of drawing that yield diagrams perceived as “good” according to the criteria discussed in Section 111. Doubtless they need to evolve. As the rules now stand, our rules not only yield pathological cases but conflict often. In Section V, we suggest ways of arriving at acceptable compromises algorithmically. These “rules” are divided into three categories: rules, factors, and objectives. A rule is informally defined as the way in which figure elements are expected to be arranged to meet certain aesthetic requirements. Examples of rules include “no two diagrams should overlap,” or that “edges in a tree are drawn as straight lines or arrows.” A factor describes a numerical range for a certain variable whose value makes a critical difference in the appearance of the diagram. For example, two related edges should be neither too far or too close to each other. An objective describes the goals we would like to achieve such as “regularity of structure should be apparent,” or that “symmetrical figure elements should be positioned symmetrically.” Objectives do not say how the goals are achieved.
A. Objectives Regularity of structure should be apparent. Figure elements should be drawn consistently. Symmetrical figure
549
elements should be put symmetrically. Unrelated edges should be kept separated from each other; related edges should be kept close together. The number of edge intersections should be minimized. The length of edges should be minimized. The number of turns should be minimized.
B. Factors 1 ) Thickness of Lines: The range of thicknesses for lines (of edges, arrow, or node boundaries) is influenced by many considerations. It is, for example, not reasonable to choose one inch thick lines for just making a diagram on 8” X 11” paper, while we may have to use that thickness in making a huge poster. In this sense, line thickness depends on the size of the diagram. Line thickness is also a function of viewing distance, the distance between the eyes of the viewer and the diagram. In our opinion, viewing distance affects line thickness more directly than the diagram size does. No matter how far or close we are to the diagram, the viewing angle should be kept the same. If we define the area in which objects can be clearly sensed without intentionally moving our eyeballs as the “sensing area,” then we find that size of diagram affects the choice of line thickness only when the diagram is within the sensing area. Within this sensing area, the smaller the diagram is, the thinner the lines should be. But if the diagram is bigger than the sensing area, then it will only affect line thickness in a mild way. Line thickness is also affected by its neighbors, more specifically, by the separations of figure elements. This is about as important as the viewing distance. Numerous samples [e.g., comparing Fig. 8(a) and 8(b)] suggest that the smaller the separations, the thinner the lines should be for the sake of both aesthetics and easy recognizability. Finally, since the eye cannot distinguish tiny variations in line thickness, and for the sake of figure element consistency, line thickness should be chosen from a small set of discrete values. On the other hand, we often use thicker than normal lines to show emphasis. 2) Size and Shape of Arrow Heads: For the same reasons given above, the size of the arrow heads is affected by the sizes of diagrams, the viewing distance, the separation of neighboring figure elements, and consistency. Also, we find that an arrow head is more pleasing to the eye when the ratio of its height (the distance from the tip to the base) to the base is close to the golden ratio, 1.61803. (See [15] for a related discussion.) 3) Turns: If the distance between two adjacent turns is small and the sides other than the one between the two turn points are long, both turn angles should be as small as possible (Fig. 13). The adjacent turn angles should be about the same (Fig. 14). 4) Separation: Let us first make the notion of separation (Section 111-G) precise. The constant CY appears frequently in the factors below. A proper value for it is hard to pin down, but it is influenced mainly by the distance between the eyes and object, and secondarily by the resolution of the display medium, and the nature of the dia-
550
-
IEEE TRANSACTIONS ON SOFTWARE ENGINEERING, VOL. 16, NO. 5, MAY 1990
c
I
(a) (b) Fig. 13. (a) Large turn angles look bad. (b) Small turn angles look good.
I Fig. 14. Good: the turn angles are kept the same. (b) Not too bad: turn angles are slightly different. (c) Bad: turn angles differ too much.
gram. A system may permit CY to be changed by users to reflect their preferences. Given a constant CY, two lines, 1, and I,, and a point p E l , , we define two new lines 1; and 1;. 1; is the longest segment of l1 containing p such that no point on I ; is farther than a from 1,. Similarly, I; is the longest segment of l2 such that no point of 15 is farther than a from I , . Let a , and b , be the end points of 1; and a, and b2 the ends of 1;. Then the affected area with respect to point p , a a ( p , l 1 , 12) is defined as the area enclosed by 11, I;, and lines connecting b , , b2 and a l , a2 (Fig. 15). The line separation is now defined as: figel-sep ( lI, /,)
2 where a , , a,, b , , and b2 are defined as above with respect to point p and lines I, and E2. List-separation (list,, list,) is defined as the smallest separation between boxes in list, and boxes in list2. Diagram-separation ( diagram,, diagram,) is defined as the smallest figure element separation between figure elements in diagram, and figure elements in diagram,. The level separation in a tree is defined assuming that all nodes of one level are drawn along a straight line and lines defining levels are parallel to each other. The distance between these lines is called level separation. 1) separation (edge,, edge,) L a * size(diagram). 2) separation(line, box) 1 a * size(box). 3) separation(edge, circle) L CY * size(circ1e). 4) separation(circle,, circle,) L a * (the size of the bigger circle). 5 ) separation (box,, box2) = 0 or, separation(box,, box:) 2 CY *‘(size of the bigger box).
\
\
Fig. 15. The definition of line separation.
6 ) The box separations in a link list: box-separation(box,, box,) = list-sep Ia * (size of the bigger box). 7) The separation between parallel link lists: list-separation ( list,, list,) 2 a * (size of the bigger box). 8) The separation between two diagrams: diagram-separation (diagram,, diagram,) 2 a * (size of the bigger diagram). 9) The level separation in a tree: level-separation (level,, level, + ) 2 CY * (size of the biggest node).
,
C. Rules A rule takes one or more aspects into account and tells us a good way (as far as these aspects are considered) to draw the diagram. Unless explicitly credited to other researchers, the rules given in this subsection were formulated by us after examining the diagrams in numerous textbooks. Because of space considerations, we can only give a bare minimum of rules and example diagrams to support our rules. In a practical system, we expect several thousand rules. I ) Nodes: Nodes of one kind in a diagram should use the same shape and size. Different kinds of nodes in the same diagram should use different shapes. Different kinds of nodes in different diagrams could use the same shape. 2) Edges: Edges of one kind in a diagram should use the same shape and thickness. Different kinds of edges in the same diagram should use different shapes and/or thicknesses. Different kinds of edges in different diagrams could use the same shape and thickness. a) Drawing Single Edges: Edges must never cross nodes other than the origin and target ones. Tree or quasitree edges are drawn as straight lines or arrows. Edges in rectangular diagrams which are not trees or quasi-trees are drawn as straight lines o r arrows if the origin and target points are on the same horizontal or vertical line which
55 I
DING AND MATETI: DRAWING DATA STRUCTURE DIAGRAMS
11 I
W Fig. 18. 1231
Fig. 16. [24]
(b)
(a) Fig. 19. Drawing multiple edges. Fig. 17. [43]
6
does not cross other nodes. Otherwise, they are drawn as orthogonal edges or arrows (Figs. 16 and 17). Short rectangular edges are drawn as curves (Fig. 10). Edges in circular diagrams are drawn as straight lines or arrows if they do not cross or very close to other nodes. Or otherwise, they are drawn as arcs or curves [Fig. 18 edge (2, 611. Arrows between adjacent nodes in a double link list are drawn as curve arrows (Fig. 10). b) Drawing Multiple Edges: If the number of edges between two nodes is even and the origin and target nodes ' are circles or ellipses, then edges are so drawn that all arc centers are on the line which is perpendicular and passes the center of the line connecting the centers of the two nodes (Fig. 19). If the number is two, one of the edges could be drawn as a straight line. The straight edge is sometimes used to keep consistency among other edges(Fig. 20). If the number of edges is odd and the origin and target nodes are circles, then one of these edges is drawn as a straight edge, and the others are drawn as above (Fig. 19). Two long edges are drawn along the same path (Fig.
Fig. 20. [23]
I (
Jl Fig. 21. [43]
21). 3) Pointers: a) Origins: Pointers whose origin nodes are boxes should originate from a point on the center line (Figs. 22 and 16). Pointers whose origin nodes are circles or el-
Fig. 22. The definition of the center line
lipses should originate from the border of the node in such a way that the tangent of the edge, at the point of departufe, passes through the center (Fig. 18). Pointers whose origin nodes are boxes filled with text should originate at the center of the origin side (Fig. 23). Pointers whose
origin node is a diamond usually originate from the diamond's comer (Fig. 24). b) Destinations: If the target node is a circle or ellipse, pointers should point to the nearest point on the circle in such a way that its tangent at the border passes
I I
552
IEEE TRANSACTIONS ON SOFTWARE ENGINEERING, VOL. 16. NO. 5. MAY 1990
Fig. 23. [23]
Fig. 25. Abbreviation of tree branches (231.
Binary tree
Fig. 24. [49]
through (one of) the center(s) of the circle or ellipse (Fig. 18). If the origin and target nodes are boxes and the centers of the origin and target sides are on the same horizontal or vertical line which does not cross any other nodes, then the pointer should point to the center of theqafget side (Fig. 16). If the origin and target nodes are boxes and the centers of the origin and target sides are on the same horizontal or vertical line which does cross other nodes or if the centers are not on the same horizontal or vertical line, then i) if the arrow is composed of strictly horizontal and/ or vertical lines only then the arrow should point to the center of the target side (Fig. 17), ii) if the arrow is curved, then the arrow should point to one of the target side ends (Fig. 10). If the target node is a diamond, then the destination should be one of the diamond comers (Fig. 24). 4) Turns: When nodes other than boxes are present, a 90” turn can be replaced by two smaller turns. These two turns should be as far as possible, while not getting too close to other figure elements. Consecutive turns that are close together should use as small angles of turn as possible (Fig. 13). 5) Repetitive Structures: The following structures are called repetitive structures for the obvious reason that their diagrams are composed of repetitions of figure objects representing the elements: arrays, trees, stacks, queues, rings, and linked lists. Abbreviation of repetitive structures is an important issue. When there is not enough space to put all figure elements in, or some of the figure elements are not important to the user, the structures can be abbreviated by the following rules: a) If it is a finite repetition, the figure objects from the third to the last second one in the repetition series could be omitted. b) If it is infinite, the figure ob-
... ...
... ...
Fig. 26. Abbreviation of tree levels 1491
jects from the third in the series could be omitted. We give more specific rules for special data structures. * 6) Trees: Trees are abbreviated by omitting ’the intermediate branches, if there are too many branches (Fig. 25), by omitting the intermediate levels, if there are too many levels (Fig. 26). a ) Binary Trees: Nodes at the same level should lie on a straight line, and straight lines defining the levels should be parallel. A left son should be positioned to the left of its father and a right to the right. A father should be centered over its sons [52], [42]. Levels should be equidistant. Higher levels are drawn below lower levels. b) Ordinary Trees: Nodes at the same level of the tree should lie along a straight lines, and straight lines defining the levels should be parallel. A father should be centered over its sons. c) B-Trees are drawn in the same way as that of ordinary trees except that arrows originate from beside or between elements in nodes (Fig. 27). d) Quasi-Tree is a diagram containing one or more trees as subdiagrams (Fig. 28). A chosen tree subdiagram is drawn as an ordinary tree with the rest of edges being drawn curved usually with a different shape or thickness (Fig. 28). e) Heaps are visualized as binary trees. 7) Miscellaneous Data Types: a ) Scalars: Strings, integers, reals, booleans, characters, enumerated types are among the most common scalar types. They are “drawn” showing their values, with or without enclosing boxes (Fig. 29). b) Records: A record is drawn as a horizontal or vertical stack of rectangles, each of which corresponds to one
DING A N D MATETI: DRAWING DATA STRUCTURE DIAGRAMS
553 a:3 b: '@ ca: -2 cb: This is a test internalREC: cc: T R h
Fig. 30. [38]
Fig. 27. B-tree 1491.
I
- 1
(a)
(b)
Fig. 3 1. Multidimensional arrays
IThis is a test SlWNG
1 ENUMERAlED
PROCEDURE
Fig. 29. [38]
of its fields. If the field is also a record, then it is recursively drawn as a record (Fig. 30). c) Arrays: One-dimensional arrays are drawn as a vertical or horizontal stack of boxes. Two-dimensional arrays are drawn as arrays of boxes [Fig. 31(a)]. Threedimensional arrays are drawn as arrays of two-dimensional arrays [Fig. 31(b)]. Arrays of n dimensions, n > 3, are drawn as linear arrays of ( n - 1 )-dimensions. d ) Linear Lists are drawn horizontally or vertically, with arrows originating from the center line and pointing to the center of target side (Fig. 16). e) Doubly Linked Li;ts are drawn horizontally or vertically, with arrows originating from the center line and pointing to the nearest corner of the target box (Fig. 10). f) Rings are drawn as circles of boxes. g) Stacks are drawn as a one-dimensional array, with or without an arrow or number indicating the top element. h) Queues are drawn either as 1) a one-dimensional array, or as 2) a ring. Arrows or numbers indicate the head and tail of the queue. i) Hash Tables: Chained hash tables are drawn as a set of linear lists connected by a head array (Fig. 16). Other hash tables are drawn as one-dimensional arrays where elements receiving the same hashing addresses are connected by arrows [Fig. 2(e)].
V . AUTOMATION CONSIDERATIONS Previous efforts in drawing systems can be categorized as: Those that concentrate on building a system to automatically draw diagrams [17], [37], [381, [lo], [401, [34]. Due to a lack of an appropriate theory and the difficulties in drawing nice diagrams automatically, aesthetic issues were not addressed systematically in these systems. Those that concentrate on automated drawing of diagrams for specific classes of data structures [20], [ 121, [52], [42], [3]. Efforts were made in both aesthetics and automation issues, but they are typically restricted to a small range of data structures such as binary trees. Those that concentrate on a particular drawing strategy [46], 141, [30], [ 161. These strategies have the potential to be incorporated in the systems (like those listed above) to achieve our goals. In our framework, rules and factors are explicitly represented while objectives are implicit in the way the rules are weighted and applied by the driver (Fig. 32). The database, shown in the dashed box, is the result of combining the builtin rules and factors, such as those discussed in the previous section, with those contributed by the user. When a data structure is being diagrammed, the work area consists of three parts: 1) a (partially-constructed) representation of the pictorial view of the data structure, 2) a representation of the abstraction of the data structure constructed from its memory image, and 3) a subset of the data base of rules and factors that the driver deemed relevant and cached for the data structure. A . Memory Image to Abstractions In this subsection, we briefly describe a phase of processing that occurs prior to any attempt at drawing a diagram. Where and how do we get the contents of the data structure that we are drawing? The drawing system described in this paper is intended as a component in debugging systems as well as in documentation systems. In a debugging system, the contents are retrieved from the address space of the program being debugged.
554
IEEE TRANSACTIONS ON SOFTWARE ENGINEERING. VOL. 16. NO. 5. MAY 1990
W o k Area
Fig. 32. Structure of the drawing system.
Gathering the memory contents of a data structure is a nontrivial process. In the case of variables of primitive types, arrays, and records, the contents are typically found in a contiguous block of memory. When pointers are involved, we must collect the contents of all cells (transitively) reachable via these pointers. It is also necessary to tag the contents as to its type whether the data represents integers, reals, characters, strings, boolean values, etc. Unfortunately, declarations in typical languages such as Ada, and C are such that we cannot readily deduce that a certain data structure is a linked list, a binary tree, etc. given only the declarations and the memory image of the data structure. Even more difficult to deduce are such abstract relationships as the father-son relationships in a heap structure, or the element relationship in a hash table. Also, it is quite common to compose data structures out of several individual variables. Examples of such “connections” include arrays and their indexes, pointers, and the pointed objects, etc. We can employ various heuristics in guessing the abstractions. These tend to be quite time-consuming, and are impractical in debugging systems, but usable in documentation systems. In debugging systems, we expect the user to make additional declarations to the debugger that certain root pointers point to dynamically linked lists, trees, stacks, etc. The abstraction so obtained, along with the memory image, and typetags, is itself represented as a data structure of the drawing system. We refer to this structure as the representation of the abstract value. It is stored in part two of the work area (Fig. 3 2 ) . When this drawing system is used as a component in a documentation system, we provide with an editor-like user interface to directly construct the representation of the abstract value.
B. Abstract Values to Diagrams The subject matter of this paper can now be described as “given a representation of an abstract value, construct a good pictorial view of it.” This pictorial view is represented as a data structure of the drawing system. It consists of graphical information such as shapes of figure elements, the layout of nodes, edges, and arrows, the origin and destination points of an arrow, etc. It collects all the geometrical objects that make up the diagram. We conI
struct this geometric representation of the diagram without considering the limitations of display devices. It is then a simple matter to actually draw a diagram on a physical medium using an appropriate device driver. We refer to this data structure as a figure object. It is stored in the first part of the work area (Fig. 3 2 ) . This information is accessible to all rules. The goal of the driver is to finish the construction of this representation. Figure objects are hierarchically composed. At the bottom level, they are sets of related figure elements, which form a composite (sub)figure. Each figure element describes a primitive such as a rectangle of size w X h , a circle of radius r , an ellipse of major radius a , minor radius b , an arrow from (x,,y , ) to (x2,y 2 ) ,etc. At higher levels, they are made up of related figure objects. Each figure object has its own x-y coordinate system, within which it specifies various attributes of its constituent figure objects. Some example attributes are the location of the origin, thickness of lines, etc.
C. Representation of Rules A rule has several components. A class is a key word used as a basis for clustering the rules into groups. Classes are hierarchical. Its primary use is in reducing search time as the system begins to draw a diagram subject to the rules. An applicability condition is a symbolic boolean expression. The rule is applicable only if this condition evaluates to true. The expression may involve factors, function calls, etc., such as length(edge(x)) > 20&nintersections( edge (x)) L 3 . An action list is a sequence of calls to functions that cause certain actions (computations) to occur. Free variables list the names and types of formal parameters in a rule. There are two further components, called weight and badness function, that we discuss later. It is possible to represent each rule as a procedure in the implementation language of the system, with components embedded in the procedure. There are two immediate disadvantages in this scheme. It becomes difficult for the user to add or change rules in the system. It is also hard to maintain these algorithms, particularly because not all users will be disciplined enough to avoid burdening these procedures with computations irrelevant to the rules but otherwise useful to the system. In our framework, each rule is represented as a data structure that has a field for each of the components of the rule. These data structures are then “interpreted” by a driver. An example representation of part of Rule 2 is: class params applicability actions weight badness
= arrow-origin =
n: node
= is-box(n) = apply-rule(arrow-box-origin) - ... - ...
The rule-base is organized as a tree. Each major rule is represented by a set of subrules based on the applicability conditions. To reduce search time, if a set of rules share
DING A N D MATETI: DRAWING DATA STRUCTURE DIAGRAMS
some conditions, a new parent rule is constructed with the common applicability conditions.
D . Applying the Rules In applying the rules, we must resolve conflicts, evaluate their relative importance, and consider many ways of combining them. Conflicts arise, for example, in drawing the edge from 1 to 3 of Fig. 33. That edge should not cross 2 as required by our rules, but the edge length minimization objective causes the edge to cross the node. Conflicts arise because many aesthetic requirements are not logically consistent and also because each rule addresses only a few of the aesthetic requirements. We believe rule conflicts to be inevitable in a system such as this. To obtain an overall optimal result, in the face of conflicts, decisions can be made only after having considered all possible choices. However, the number of possible choices is typically exponential in the number of nodes or edges in the graph and the number of rules applicable. We propose a schema that uses rule weights, badness functions, and control variables to solve rule conflicts. I ) Rule Weights: Each rule, of course, affects the drawing in its own way, and yet not all of them are equally important. For example, “edges should never cross nodes” has a heavier impact on the result than “the number of edges intersections should be minimized” does. The relative importance of a rule is formalized as its weight, given as a number. Obviously, weight assignment is subjective and depends on the assigner’s preference. 2) Badness Functions: A badness function computes a figure of merit of the proposed diagram based on its constituents and how they are laid out. (The badness numbers of TEX [54] are widely known and experienced.) Discovering appropriate badness functions is an art, and is critical to the success of the system. The following two examples are illustrative of the issues involved. a) Badness of Arrow Destination: Suppose we need to draw an arrow pointing at a box. Assume further that our subjective preferences are as follows. The perfect position for the arrow head is the center of the target side. The next best position is either end of the side. If none of these three positions is possible, then the arrow head should be positioned as close as possible to these preferred points. Based on this observation, a badness function may look like:
badness(x) =
-
r
0,x +
ifa
Ix Id
K~
ifd
Ix 5
K~
i f c Ix 5 e
K,
+ 09 + 04x + K4 09
if e
Ix 5
c b
where a , b , * * , e are points, Oi are the slopes, and K~ are the offsets (Fig. 34). b) Badness of a Diagram Due to Edge Intersections: It is ideal to have no intersections. Otherwise, badness is proportional to the number of intersections.
1
(b) Fig. 33. Rules conflict sometimes.
b
Fig. 34. The definition of badness function for arrow head position.
badness (edge-crossing)
=
nintersections(edge)
where c is the badness factor assigned by the system and changeable by the user. The badness functions need to be combined together to generate an overall badness functions which meaningfully reflects the appearance of the whole diagram. 3) Conflict Resolution: In part one of the work area (Fig. 32), a data structure representing the graphical layout and structure of the diagram is created. Each node of this data structure represents one figure element of the diagram. In each node is a collection of ways of drawing the figure element as arrived at by applying different and possibly conflicting rules. If this collection has conflicting information, a merger algorithm is called. This algorithm arbitrates among the conflicts and gives a final position and layout for the figure element attempting to reduce the badness of the whole diagram.
E. EJJiciencyIssues The drawing system described in this paper is intended as a component in debugging systems as well as documenting systems. In a debugging system, diagram drawing is on-line and interactive. Some systems of this kind are [17], [38], [40], [34], [ 2 5 ] . Many diagrams are used only for the purpose of debugging. The user can only wait for rather short period of time to compute the diagrams. A perfect but very time consuming picture is not desirable. In systems such as this, the optimal solution is attempted only if it does not take a long time. Otherwise, an approximate solution is generated. In contrast, in documentation preparation systems, diagrams are no longer the intermediate products and the requirements for the goodness are much higher than those in debuggers. Users now wish the diagram to be drawn as
556
I E E E TRANSACTIONS O N SOFTWARE E N G I N E E R I N G . VOL. 16. NO. 5 , MAY IYYO
perfectly as possible. The computing time, while still not infinite, is not very limited here. There are numerous optimization problems in drawing diagrams such as the minimization of the number of intersections, of the number of turns, of the length of edges, etc. Most of these optimization problems have exponential complexity. Since time is a very important factor in drawing diagrams, most optimization problems can only be solved approximately. Another strategy is to use multiple steps in drawings, i.e., the diagram is drawn at different levels of badness depending on the available amount of time. The system tries its best to draw it within the specified timespan. If the user is not happy with the result, more’time is then given and the system further refines the drawing.
F. Customization Customization is always needed to the diagrams generated by the system. The reasons for the need are numerous. Users have their own preference and aesthetic tastes. One of the typical examples for customization is the orientation of one dimensional arrays. Some users like them to be drawn vertically, while others horizontally; some applications need them to be drawn vertically, while others horizontally. We also find that different communities of computer science have different preferences. Lispers, for example, have their “peculiar” way of drawing [12] lists. Users in programming area and researchers in graph theory area draw graphs in different ways. A programmer likes to draw nodes as a stack of boxes and have the field names and values expressed explicitly. But graph theorists prefer drawing nodes as circles or ellipses. VLSI researchers like using straight lines and view the line intersections more seriously than do users in other areas. There are several ways to allow users to have their preference: The system allows the user to gather his own rules into a file, and the system will overwrite the corresponding builtin rules. Rules in the system are modifiable by the user. Most rules have default values or actions which are changeable by users. VI. CONCLUSION Data structure diagrams convey technical information. While subjective preferences may prevail as to how an arrow or an array should be drawn, the overall concern ought to be the clarity with which this information is communicated. Based on some commonly agreed principles, we have discussed what factors make a diagram look good and convey its information easily and consistently. We divided the aspects that govern the drawing of these figures into rules, factors, and objectives. While there are some aspects that apply to all diagrams, most of the rules and objectives are specific to the abstraction that a data structure represents.
We also formulated how the aesthetic rules and objectives can be represented in a system. We are in the process of building a (sub) system based on these ideas.
REFERENCES A. V. Aho, J. E. Hopcroft, and J . D. Ullman, The Design and Analysis of Computer Algorithms. Reading, MA: Addison-Wesley, 1974. J . Amstein, The International Dictionary of Graphic Symbols. London: Century, 1986. M. Augenstein and Y. Langsam, “Graphic displays of data structures on the IBM PC,” SIGCES Bull., vol. 18, no. I , pp. 73-81. Feb. 1986. R . I . Becker and S . R. Schach, “Drawing labeled directed binary graphs on a grid,” in Proc. ACM 20th Southeast Regional Conf., Knoxville, TN, 1982. J . Bertin, Semiologie Graphique: Les Diagrammers, Les Reseaux, Les Cartes. Paris: Mouton, 1967. H.-D. Bocker, G. Fisher, and H. Nieper, “The enhancement of understanding through visual representation,” in CHI ’86 Proc., Apr. 1986, pp. 44-50. H. D. Boecker and H. Nieper, “Making the invisible visible: Tools for exploratory programming,” in Proc. First Pan Pacijic Computer Conf., Australian Comput. Soc., Melboune, Australia, Sept. 1985. P. R . Bono, “A survey of graphics standards and their role in information interchange,” Computer, vol. 18, no. 10, pp. 63-75, Oct. 1985. A. Borning, “The programming language aspects of ThingLab. a constraint-oriented simulated laboratory,” ACM Trans. Program. Lung. Syst., vol. 3 , no. 4,Oct. 1981. M. H. Brown and R . Sedgewick, “A system for algorithm animation,’’ ACM Comput. Graphics, vol. 18, no. 3, pp. 177-186, July 1984. S.-K. Chang, Ed., Visual Language. New York: Plenum, 1986. M. S. Dionne and A. K. Mackworth, “ANTICS: A system for animating LISP programs,” Comput. Graphics Image Processing, vol. 7, pp. 105-119, 1978. S . Feiner, S. Nagy, and A. van Dam, “An experimental system for creating and presenting interactive graphical documents,” ACM Trans. Graphics, vol. 1, no. I , pp. 59-77, 1982. W. Finzer and L. Gould, “Programming by rehearsal,” Byte, vol. 9, no. 6, pp. 187-210, June 1984. J . Gait, “An aspect of aesthetics in human-computer communications: Pretty windows,” IEEE Trans. Software Eng., vol. SE-11, no. 8. DD. 714-717. Aug. 1985. 1161 E. R., Gansner, S. North, and K . P. Vo, “DAG-A program that draws directed graphs,” Software-Practice and Experience, vol. 18, PP. 1047-1062, Nov. 1988. no. 11, .. S . L. Getz, G. Kalligiannis, and S . R . Schach, “A very high-level interactive graphical trace for the Pascal heap,” IEEE Trans. Software Eng., vol. SE-9, no. 2, pp. 179-185, Mar. 1983. F. E. Giesecke, Engineering Graphics, 4th ed. New York: Macmillan 1987. E. P. Glinert and S . L. Tanimoto, “Pict: An interactive graphical programming environment,” Computer, vol. 17, no. 11, pp. 7-25, Nov. 1984. G. Hain and K. Hain, “A general purpose automatic flowcharter,” in Proc. Fourth Annu. Meeting UAIDE, New York, Oct. 1965, pp. iv- 1-iv- 12. C. F. Herot et a l . , “An integrated environment for program visualization,” in Automated Tools f o r Information Systems Design, H. J . Schneider and A. I. Wasserman, Eds. Amsterdam, The Netherlands: North-Holland, 1982, pp. 237-259. F. R. A. Hopgood, “Computer animation used as a tool in teaching computer science,” in Proc. I974 IFIP Congr., Applications volume, 1974, pp. 889-892. E. Horowitz and S . Sahni, Fundamentals of Computer Algorithms. ’ Woodland Hills, CA: Computer Science Press, 1976. [24] -, Fundamentals of Data Structures. Woodland Hills, CA: Computer Science Press, 1976. [25] S . Isoda, T. Shimomura, and Y. Ono, “VIPs: A visual debugger,” IEEE Software, pp. 8-19, May 1987. [26] B. W. Kernighan, “PIC-A language for typesetting graphics,” in Proc. of the ACM SIGPLAN SIGOA Symp. Text Manipulation, Portland, OR, 1981, pp. 92-98. I
..
5.
DING A N D MATETI: DRAWING DATA STRUCTURE DIAGRAMS
[27] D. E. Knuth, “Computer drawn flowcharters,” Commun. ACM, vol. 6, no. 9 , pp. 555-563, Sept. 1963. [28] D. Kramlich et a l . , “Program visualization: Graphics support for software development,” in Proc. 20th Design Automation Conf. , 1983, pp. 143-149. [291 S . Lammers, Programmers at Work. Microsoft Press, 1986. [30] R. J. Lipton, S . C. North, and J. S . Samdberg, “A method for drawing graphics,” in Proc. ACM Symp. Computational Geometry, Baltimore, MD, 1985, pp. 153-160. [31] R. L. London and R. A. Duisberg, “Animating programs using Smalltalk,” Computer, vol. 18, no. 8, pp. 61-71, Aug. 1985. [32] J . Martin, Recommended Diagramming Standards for Analysts and Programmers: A Basis for Automarion. Englewood Cliffs, NI: Prentice-Hall, 1987. 1331 P. Mateti, Visualization of Abstract Data Types, to be published. [34] P. Mateti and G. M. Radack, “Automated drawing of data structure diagrams,” in Proc. 4th Annu. Nat. Con$ Ada Technology, Mar. 1986, pp. 165-172. [35] G . F. McCleary, Jr., “An effective graphic vocabulary,” IEEE Comput. Graphics Applications, pp. 46-53, Mar./Apr. 1983. [36] F. S . , Montalvo, “Diagram understanding: Associating symbolic descriptions with images,” in Proc. Second IEEE Workshop Visual Languages, Dallas, TX, June 1986. [37] B. A. Myers, R. Chandhok, and A. Sareen, “Automatic data visualization for novice Pascal programmers,” in Proc. 1988 IEEE Workshop Visual Languages, Pittsburgh, PA, Oct. 1988, pp. 192-198. [38] B. A. Myers, “Incense: A system for displaying data structures,” Comput. Graphics, vol. 17, no. 3, pp. 115-125, July 1983. [39] W. M. Newman, “A graphical language for display programming,” in Proc. Int. Conputer Graphics Symp., Brunel Univ., Uxbridge, England, Aug. 1968. [40] F. J . Ojeda, “DDS: A subsystem for displaying data structures for interactive debugging,” M.S. thesis, Dep. Comput. Eng. Sci., Case Western Reserve Univ., Aug. 1985. [41] M. C. Pong and N. Ng, “PIGS-A system for programming with interactive graphical support,” Software-Practice and Experience, vol. 13, no. 9 , pp. 847-855, Sept. 1983. 1421 E. M. Reingold and J. S . Tilford, “Tidier drawings of trees,” IEEE Trans. Software Eng., vol. SE-7, pp. 223-228, 1981. [43] E. M. Reingold and W. J. Hansen, Data Structures. Boston, MA: Little Brown, 1983. [44] S . P. Reiss, “PECAN: Program development systems that support multiple views,” IEEE Trans. Sofware Eng., vol. SE-11, no. 3, pp. 276-285, Mar. 1985. “Graphical program development with PECAN program devel[45] -, opment systems,” in Proc. ACM SIGSOFT/SIGPLAN Software Engineering Symp. Practical Sojiware Development Environments, Pittsburgh, PA, Apr. 1984, pp. 30-48. [46] M. I. Shamos and D. Hoey, “Geometric intersection problems,” in Proc. 17th Annu. Symp. Foundarions of Compurer Science, Houston, TX, 1976, pp. 208-215.
557 [47] B. Schneiderman “Direct manipulation: A step beyond programming languages,” Computer, vol. 16, no. 8, pp. 57-69, Aug. 1983. [48] B. Schneiderman, P. Shafer, R. Simon, and L. Weldon, “Display strategies for program browsing,” in Proc. Conf. Sofware Maintenance, IEEE Comput. Soc., Washington, DC, 1985. [49] T. A. Standish, Data Structure Techniques. Reading, MA: Addison-Wesley, 1980. [50] D. Thalmann, “An interactive data visualization system,’’ Software-Practice and Experience, vol. 14, no. 3, pp. 277-290, Mar. 1984. [51] E. R. Tufte, The Visual Display of Quantitative Information. Cheshire, CT: Graphics Press, 1983. [52] C. Wetherell and A. Shannon, “Tidy drawings of trees,” IEEE Trans. Sofware Eng., vol. SE-5, pp. 514-520, 1979. [53] E. Yarwood, “Toward program illustration,” Univ. Toronto Computer Systems Research Group, Rep. CSRG-84, Oct. 1977. [54] D. E. Knuth, The TEXbook. Reading, MA: Addison-Wesley, 1984.
Chen Ding received the B.Sc. degree in computer science from the University of Science and Technology of China, Hefei, Anhui, People’s Republic of China, in 1984. He received a fellowship from K. C. Wong Education Foundation, Hong Kong, in 1986 and is currently completing his Ph.D. dissertation at Case Western Reserve University, Cleveland, OH. His research interests include user interfaces, program visualization, and computer animation.
Prabhaker Mateti (S’75-M’76) received the Bachelor’s degree in electrical engineering from Regional Engineering College at Warangal in 1969, the M. Tech degree in electrical engineering from Indian Institute of Technology at Kanpur in 1972, and the Ph.D. degree in computer science from the University of Illinois at UrbanaChampaign in 1976. He is an Associate Professor of Computer Science and Engineering at Wright State University, Dayton, OH. His research interests include programming language design, formal aspects of software engineering, graph algorithms, and man-machine interaction. His recent work is aimed toward constructing a computer-aided environment for the precision design of software. Dr. Mateti is a member of the IEEE Computer Society.