Printed in the United Kingdom. 425. A frequency lock-in mechanism in the interaction between wind and crop canopies. By CHARLOTTE PY1, EMMANUEL de ...
c 2006 Cambridge University Press J. Fluid Mech. (2006), vol. 568, pp. 425–449. � doi:10.1017/S0022112006002667 Printed in the United Kingdom
425
A frequency lock-in mechanism in the interaction between wind and crop canopies By C H A R L O T T E P Y1 , E M M A N U E L d e L A N G R E1 A N D B R U N O M O U L I A2 † 1
´ D´epartement de M´ecanique, LadHyX, CNRS-Ecole Polytechnique, 91128 Palaiseau, France 2 ´ Unit´e d’Ecophysiologie des Plantes Fourrag`eres, INRA, 86600 Lusignan, France
(Received 7 October 2005 and in revised form 23 May 2006)
The interaction between wind dynamics and the waving of crop canopies is explored. On-site experiments with wheat and alfalfa fields have allowed us to quantify the motion of a large set of plants subject to wind, using an image-correlation technique. The coherent part of the waving motion is extracted by a bi-orthogonal decomposition of the spatio-temporal velocity field of the crop surface. It is shown that the corresponding space and time features cannot be explained using predictions from the mixing-layer analogy of wind above canopies, which is the most common model for perturbations in this environment. We show that the plant bending stiffness plays an important role in the frequency and wavelength selection for the coherent motion of the canopy. A fully coupled model, where the wind fluctuations and the plant dynamics interact through a drag term, is then proposed. This model allows us to demonstrate a lock-in mechanism, similar in principle to what is found in vortexinduced vibration, whereby the frequency of the instability deviates from its expected value when approaching the natural frequency of the oscillating medium. This finding is then compared with data from on-site experiments, and good agreement, in both the frequency and wavelength of the propagating patterns observed on the canopy surface, is found.
1. Introduction The wind-induced motion of crop canopies may result in crop damage, namely the phenomenon of lodging (or windthrow), which is responsible for a massive loss in grain yield worldwide (Baker 1995). Moreover, wind-induced motion is known to influence plant growth and biomass production. This latter effect is referred to as thigmomorphogenesis (Jaffe 1973), and its practical application in agronomy has only recently been demonstrated (Moulia & Combes 2004). For both lodging and thigmomorphogenetic analyses, an accurate description of the strong coherent motion of the crops under wind and a better understanding of the coupling between wind and canopy dynamics is necessary. Wind turbulence within and over plant canopies has long been viewed as a perturbed version of the turbulence present in the atmospheric boundary layer. However, over the last three decades our knowledge of canopy turbulence has steadily advanced, as reported in the two reviews by Raupach & Thom (1981) † Present address: PIAF, INRA, 234 avenue du Br´ezet, 63039 Clermont-Ferrand, France.
426
C. Py, E. de Langre and B. Moulia U
δ Λx
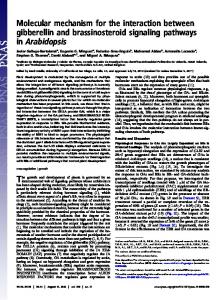
Figure 1. Schematic diagram of the mixing layer instability in wind over plant canopies, adapted from Finnigan (2000); δ is the vorticity thickness and Λx is the dominant streamwise length scale.
and Finnigan (2000). This has been motivated by such problems as: the transport of pollen and other particles; CO2 , heat and vapour exchanges between vegetation and the atmosphere including their role in canopy microclimates; and wind damage to forests and crops. A major development has been the recognition that wind turbulence is dominated by large coherent structures that scale with the canopy height. Single-point statistics of turbulence in the roughness sublayer occupied by the canopy and the air layer just above differ significantly in many respects from those in the surface layer: the mean velocity profile is inflected at the canopy top (figure 1), second-order moments are strongly inhomogeneous with respect to height, skewness and correlation coefficients are large and velocity moments are proportional to a unique length and time scale throughout the layer (Finnigan 2000). Comparison with the statistics and instability modes of a plane mixing layer shows that the latter, rather than the boundary layer, is the appropriate model for canopy flow and that the dominant vortices result from an inviscid instability associated with the inflection of the mean velocity profile; see Raupach, Finnigan & Brunet (1996). For canopies ranging from grass to forests, the dominant streamwise length scale Λx of canopy turbulence was shown by Raupach et al. to be controlled by a unique shear length scale, proportional to the canopy height and equivalent to the vorticity thickness δ commonly used to describe the inflection of mixing-layer profiles (Huerre 2000); see figure 1. Following the work of Raupach et al. (1996) on terrestrial canopies, a recent study by Ghisalberti & Nepf (2002) showed that the mixing-layer model was also applicable to the flow through and above submerged aquatic vegetation. The wavelike motion of crops on windy days, called honami (Inoue 1955), provides striking visualizations of the propagating coherent structures of wind resulting from the above-mentioned mixing-layer of type instability, if one assumes that the canopy simply behaves as a passive vibrating medium excited by the wind fluctuations. However, several aspects of the wind dynamics and its coupling with the plant canopies remain unclear. First, it is surprising that vortex structures resulting from a Kelvin–Helmholtz instability may form in the wind over canopies in the presence of naturally high levels of noise, whereas convective mixing layers are known to be highly sensitive to external noise (Huerre 2000). The instability over plant canopies seems to be less sensitive to noise than classical shear-layer instabilities. It was suggested by J. J. Finnigan (2004, private communication) that the plant motion may affect the flow dynamics and promote vortex roll-up, through a mechanism that remains to be clarified. Second, the dominant frequencies measured in the wind over waving
Lock-in in wind–crop interaction
427
Videocamera
Wind measurement
ey ex
ez
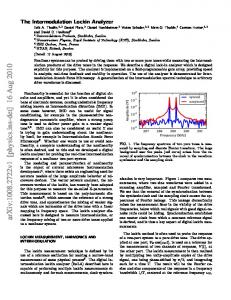
Figure 2. Experimental setup for the measurement of the wind-induced motion of crops.
wheat were found to match closely the free-vibration frequency of the wheat plants (Finnigan 1979). This is incompatible with the mixing-layer model, which predicts a dominant frequency that is set by the vorticity thickness of the mean wind profile. This therefore suggests a non-negligible influence of the plant vibrations on the flow dynamics. These two features, namely the low sensitivity to noise and the selection of a dominant frequency, both suggest that the canopy does not behave as a passive vibrating medium but rather plays a role in the instability itself. Consequently it is necessary to study wind flow over canopies and the wind-induced motion of plants in a fully coupled way. Despite intensive field studies of wind flow over canopies, little qualitative information (Finnigan 1979) and no quantitative data are available regarding the coherent motion of plant canopies. The experimental technique recently developed by Py et al. (2005) allows characterization of the spatiotemporal motion of crops subject to wind under field conditions. In the first part of this paper, § 2, we present experimental results of in-situ measurements of the motion of two crops under wind. Then, in order to explain the features revealed by the experiments, a model is proposed in § 3 that couples wind flow and canopy motion. A temporal linear stability analysis allows us to compute the characteristics of the coupled instability underlying both the coherent structures of wind and the waving of the canopy, and an insight into the wind–crop coupling is gained. In § 4, the predictions of this model are compared to the experimental results of § 2. 2. Experimental characterization of the waving of crop canopies The goal of the experiments described below is to describe quantitatively the global motion of crop canopies under wind and, more specifically, to identify the wavelike motion that can be observed on crops on windy days. The spatio-temporal features of these waves are investigated with the aim of understanding the underlying instability mechanism. 2.1. Experimental approach For completeness, we recall the main features of the experimental technique used to measure the motion of waving crops, which are detailed in Py et al. (2005). The motion of two crop canopies of alfalfa and wheat is video-recorded at 25 frames per second from the edge of the field under various wind conditions; see figure 2. In the current work, a network of thin ranging-poles, planted in the crop with a spacing of 1.5 m, was used as reference marker for subsequent image-distortion correction; this differed from Py et al. (2004). During each sequence of video-recording, lasting 10 to
428
C. Py, E. de Langre and B. Moulia
30 seconds, the wind velocity is measured with a hot wire anemometer located just above the crop surface. This allows one to relate the patterns of the crop motion to the wind intensity. The spatio-temporal motion of the upper crop surface can be deduced from a sequence of images, after correcting for perspective distortion, by a correlation analysis: the computation is based on standard particle image velocimetry (PIV) algorithms (Raffel, Willert & Kompenhans 1998), the small-scale heterogeneities of the plants playing the role of natural tracers. This measurement technique yields a two-dimensional spatio-temporal horizontal velocity field V (x, z, t) of the canopy surface with high spatial and temporal resolution. In order to extract the coherent structures of the canopy motion, we then use a bi-orthogonal decomposition (BOD, see Aubry, Guyonnet & Lima 1991) of the crop velocity field V (x, z, t). This bi-orthogonal decomposition reads V (x, z, t) =
N � √ αk µk (t) Ψk (x, z),
(2.1)
k=1
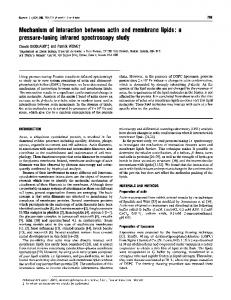
where the Ψk , referred to as topos, are the spatial modes and the µk , referred to as chronos, are the temporal modes. See H´emon & Santi (2003) for a recent review on BOD, and Py et al. (2005) for the application of BOD in the context of crop motion. In practice, topos and chronos are, respectively, velocity maps and time functions. They form a set of normalized orthogonal functions, and the spatio-temporal modes (Ψk , µk ) in (2.1) are ranked in descending order of their kinetic energy αk . A typical set of BOD modes is shown in figure 3 with the two most energetic topos and associated chronos derived from a sequence of motion of a wheat field under wind. The topos, figures 3(a) and 3(b), display patterns of motion. A two-dimensional Fourier transform of Ψk (k = 1, 2) yields the characteristic wavenumbers kx and kz in the x- and z-directions. The corresponding wavelengths of the topos, � λ = 2π/ kx2 + kz2 , (2.2) characterizing the spatial structure of the topos, may then be deduced; see figure 3(a, b). The associated chronos, figure 3(c), display a regular oscillatory behavior. The oscillation frequencies f are measured using a Fourier transform of µk (k = 1, 2). We notice that the two topos display similar wavelengths λ and seem phase-lagged in space and that the two chronos have similar frequencies f and seem phase-lagged in time; see figure 3. Consequently, the combination of these two phase-lagged spatiotemporal modes leads to a pattern propagating in the direction of the main wavelength vector, i.e. θ = arctan(kz /kx ), with phase velocity c = λf . The BOD analysis of the velocity field of the plant surface thus allows us to extract the propagating pattern of the crop canopy from a complex signal. In addition to the measurements of crop motion, the mechanical properties of the individual plants, for both canopies, are also measured. The mechanical properties of the stems are derived from free-oscillation tests as proposed by Flesch & Grant (1992) and Doar´e, Moulia & de Langre (2004). A single plant is isolated and clamped at its foot; the stem is displaced from its equilibrium position, then released, and its in-plane motion is video-recorded. From the resulting sequence of images, the oscillation of the stem can be measured by tracking its position along a horizontal line versus time; see figure 4. The natural vibration frequency f0 of the plant is then derived via a Fourier transform. The spacing l between neighbouring stems in a canopy, their height h and the mass distribution along the stem are also measured (figure 4).
429
Lock-in in wind–crop interaction (a)
(b)
ez
ex
0.2
0
–0.2
(c) 0
2
4 t (s)
6
8
Figure 3. Velocity field and isocontour of modulus of (a, b) the two most energetic topos and (c) the associated chronos (—, chronos 1; - -, chronos 2) derived from the BOD analysis of a sequence of motion of a wheat field under wind. The wavelengths of the topos, derived from two-dimensional Fourier analysis, (2.2), and represented by the straight line, are λ1 = λ2 = 1.4 m, and the oscillation frequencies of the chronos are f1 = f2 = 2.2 Hz. These values lead to a phase velocity for the coherent structures of c = 3.1 m s−1 in the direction of the line.
Both the video-recording of the crop motion and the measurement of the mechanical plant properties have to be performed within a few days, so that the maturity of the plants, and thus their stiffness, does not vary significantly. 2.2. Experimental results The following experiments took place in May 2004 in Lusignan, France. The crops consisted of separate alfalfa (Medicago sativa L. cv Mercedes) and wheat (Triticum aestivum L. cv Apache) fields. The properties of six individual plants taken from the
430
C. Py, E. de Langre and B. Moulia 1
Q(t)
1
2
mi
3 0
(b) (a)
(c)
t (s)
Figure 4. (a) The free oscillation test, showing the instantaneous positions of a stem of alfalfa. (b) Oscillation of the stem as a function of time measured by tracking its position along a horizontal line. (c) Mass distribution measurement of a plant in 10 cm segments: mi is the mass of the ith segment.
Alfalfa Wheat
f0 (Hz)
h (m)
1.05 (0.8–1.5) 2.50 (2.0–3.0)
0.69 (0.47–0.84) 0.68 (0.54–0.76)
m −3
(10
kg)
4.6 (1.3–6.2) 1.5 (0.7–1.8)
l (m)
r (N m−1 )
0.05
0.17
0.05
0.41
Table 1. Measured properties of the crops of wheat and alfalfa (mean value and data interval); f0 is the eigenfrequency, h the canopy height, m the modal mass (see (3.1)), l the spacing between plants and r the flexural stiffness deduced from f0 and m (see (3.2)).
alfalfa field and four plants from the wheat field were measured, and the averaged results together with the corresponding range are given in table 1. These two crop species were chosen for this study because they display different stiffness characteristics but have similar heights, at the growth stages at which they were sampled. About 30 image sequences of the canopy motion under wind were recorded on both crops and analysed with the image correlation and BOD techniques described above. The values of the wavelength λ of the topos and frequency f of the chronos for the two most energetic modes were obtained for different values of the corresponding wind velocity U , measured during each sequence of motion. Only the normalized results, λ/ h and f/f0 , as a function of the reduced velocity Ur are presented here; see figure 5. The reduced velocity Ur , a classical non-dimensional parameter in fluid– structure interactions (see for instance Blevins 1990), relates a characteristic velocity of the fluid, U , to a characteristic velocity of the solid, in our case based on the free vibration frequency f0 and the canopy height h. We obtain Ur =
U , f0 h
(2.3)
where f0 and h are values measured for the individual plants of each canopy; see table 1. For both canopies, the normalized wavelength λ/ h was found to increase
431
Lock-in in wind–crop interaction 2 (a)
(b)
4
λ h
f 1 f0
2
0
2
4 Ur
6
0
2
4
6
Ur
Figure 5. Wave properties of the first two modes of the BOD analysis of the measured canopy motion: (a) the characteristic wavelength of the topos normalized by the canopy height h, and (b) the frequency of the chronos normalized by the frequency of the plants f0 , both as functions of the reduced velocity Ur . *, alfalfa field; 䊊, wheat field.
with the reduced velocity Ur ; see figure 5(a). For a given value of the dimensional wind velocity U , the dimensional wavelength λ was two to three times larger for alfalfa than for wheat. Therefore, since f0 is the only parameter in the normalization whose value significantly differs between wheat and alfalfa, the similarity of the data for both canopies regarding their dependence on Ur demonstrates that plant rigidity must be accounted for when determining the wavelength of the coherent crop motion. The normalized frequency of the chronos, f/f0 , was found to be approximately independent of the reduced velocity Ur for both canopies; see figure 5(b). The mean value of f/f0 was close to 1 for alfalfa (1.06) but was slightly less than 1 for wheat (0.81). However, figure 5(b) does not take into account the variability of f0 ; see table 1. A detailed statistical analysis accounting for both the variability on f and f0 , based on the first analogue of Fieller’s theorem, the use of Berhens distributions and the Sukhatme d-test (Finney 1964), showed that the confidence limits of f/f0 were not significantly different for the two canopies and that f/f0 was close to 1 in both cases. The apparently lower value of f/f0 for wheat, seen in figure 5(b), is likely to have resulted from an underestimation of f0 in our plant sample owing to the large spread of f0 values resulting from the plants’ biological variability. In conclusion, our experimental data demonstrate that the coherent motion of the crop under wind occurs near the natural vibration frequency of the plants, independently of the wind velocity. 2.3. Discussion The experimental results shown above are the first quantitative and extensive measurement of the coherent waving of crop canopies under wind. The most energetic modes of the BOD revealed large-scale coherent structures in space. Such a large correlation length does not appear naturally in a set of adjacent oscillating stems and thus suggests the existence of an underlying instability mechanism. The identification of large coherent structures in the motion of the crops provides evidence that the shearlayer-type instability governing the wind dynamics over plant canopies (Raupach et al.) also drives the motion of the canopy. Moreover, the measured wavelengths of the topos, scaled by the height of the plants (1 < λ/ h < 4), are of the same order as
432
C. Py, E. de Langre and B. Moulia
the size of the coherent structures of wind measured over wheat and corn canopies, 3 < λ/ h < 5; see Raupach et al. (1996) and Finnigan (2000). In shear-layer instabilities, the wavelength is governed by the vorticity thickness of the mean flow profile (Huerre 2000). In the context of wind-driven plant canopies, the vorticity thickness δ (figure 1), which is mainly linked to the leaf-area density of the canopy, is known to be independent of the wind velocity U ; see Brunet & Irvine (1999). Following the mixing-layer analogy of Raupach et al. (1996), the wavelength would thus be expected to be independent of U . On the present study, however, the wavelength characterizing the coherent wave patterns of the crop was shown experimentally to increase significantly with U while the associated frequency was independent of U ; see figure 5. This fact cannot be explained by the mixing-layer analogy of Raupach et al. (1996). Moreover, the bending rigidity of the plants, via their natural frequency f0 , was shown to play a dominant role in the scaling of wavelength and frequency, as extracted from the measured motion of the wheat and alfalfa crops. In particular it is striking that the coherent wave motion occurs at the free vibration frequency f0 of the plants, independently of the wind velocity. This frequency selection of the coherent motion of the crop suggests that the dynamics of the plants plays an active role in the underlying instability mechanism. Finnigan (1979) also found peaks in the velocity spectra of wind over waving wheat that matched the free-vibration frequency of the wheat stems; this fact suggests that the coherent oscillation of the plants may perturb the wind flow over and inside the canopy. The mixing-layer model proposed by Raupach et al. (1996) does not provide an explanation for the role of the canopy dynamics suggested by both our results and those of Finnigan (1979). To remedy this, a model that couples wind dynamics and canopy motion is proposed and analysed in the following section.
3. A model coupling mixing-layer dynamics and crop motion 3.1. Description of the model Here we investigate the effect of the plants’ dynamics on the instability that simultaneously causes large-scale vortical structures of the wind and coherent wave motion of the crop canopies. A coupled model is proposed in which both the wind flow over and inside the canopy and the motion of the plants are considered and where both media interplay. A preliminary version of this model was presented in Py, de Langre & Moulia (2004). Crop plants are commonly modelled as mechanical oscillators; see for instance Flesch & Grant (1991), Farquhar, Zhou & Haslach (2003) or Doar´e et al. (2004) The vibration tests performed on the wheat and alfalfa stems, see § 2, confirmed that most of the dynamics of the plant may be represented by such a model. We describe the crop canopy as an infinite row of identical oscillators; see figure 6. Elastic interactions may be introduced to model the contacts between neighbouring plants (Doar´e et al. 2004; Py et al. 2004), but these interactions were found to have only a small effect and are neglected for the sake of clarity. Following Doar´e et al. (2004), the crop canopy is modelled as an equivalent continuous medium, figure 6, and its motion is described by the horizontal displacement X(x, y, t) = χ(y)Q(x, t)ex , where χ represents a mode shape and Q denotes the corresponding generalized displacement. In what follows, only the fundamental mode of vibration of the stems is considered, using a simplified linear mode shape χ = y/ h. The inertia of the plant is taken into account via the
433
Lock-in in wind–crop interaction ey U1
h+δ X
h U2
ex
Ub
Figure 6. Basic flow Ub and model of the crop canopy. The spacing of the stems along the x-axis is l.
modal mass,
�
h
mi (y)χ 2 dy,
m=
(3.1)
0
where mi is the mass distribution measured in segments; see figure 4(c). The modal stiffness of the stem is then defined as r = (2π)2 mf0 2 .
(3.2)
The damping of the mechanical oscillators will be neglected as dissipation is not expected to play a dominant role in the instability mechanism. We assume that the canopy movement results from a local streamwise drag force acting on the equivalent surface of each plant that depends on the difference between the local horizontal wind velocity U and the horizontal plant velocity V = ∂ X/∂t. This drag force is then projected onto the mode shape χ (Blevins 1990). The dynamics of the canopy is thus governed by � h ∂ 2Q 1 ρCD [(U − V ) · ex ]2 χ dy, (3.3) m 2 + rQ = 2 ∂t 0 where CD is a dimensional drag coefficient assumed to be uniform along the plant height and independent of the wind velocity magnitude U . This coefficient may be estimated from the static deflection of the plant under wind load. The wind velocity U is governed by the Euler equations within and above the canopy; again, the effect of fluid viscosity is neglected since the mixing-layer instability mechanism, expected to play a major role in the wind dynamics (Raupach et al. 1996), is known to be essentially inviscid (Huerre & Rossi 1998). A source term representing the effect of the drag load on the fluid flow is added to the x-momentum equation inside the canopy (y < h). In order to model the inflectional mean wind profile, see figure 1, we use a piecewise linear profile Ub (y), defined by a vorticity thickness δ and a shear parameter R = (U1 − U2 )/2U based on the mean velocity U = (U1 + U2 )/2, see figure 6. This type of profile is commonly used to model mixing-layer configurations and, despite its simplicity, has been shown to capture the main characteristics of the instability (Huerre & Rossi 1998).
434
C. Py, E. de Langre and B. Moulia
To investigate the stability of a given basic state, composed of a basic velocity profile Ub and pressure Pb together with the corresponding equilibrium position of the canopy Qb , we introduce associated small perturbations u, v, p, q. The momentum and mass balance for the flow and the dynamic equation for the canopy may then be expanded to first order in terms of the perturbations, which yields the following set of coupled equations: � � ∂u ∂Ub 1 ∂p CD ∂q ∂u + Ub + v=− − 2 U2 u − χ , (3.4) ∂t ∂x ∂y ρ ∂x l ∂t ∂v ∂v 1 ∂p + Ub =− , (3.5) ∂t ∂x ρ ∂y ∇ · u = 0, (3.6) � � � h ∂ 2q ∂q m 2 + rq = ρCD U2 u − χ χ dy, (3.7) ∂t ∂t 0 where the drag coefficient CD in (3.4) is set to zero outside the canopy (y > h). Using the vorticity thickness δ, the advection time δ/U and the mass ρδ 3 , we may define the non-dimensionalized variables r m ¯ = CD , ¯ = h , ¯l = l , C ¯ = 3 , ¯r = , h m ρδ ρδU 2 δ δ δ v p x tU u q ¯= ¯ = , v¯ = , p . u , q¯ = , x¯ = , ¯t = U U ρU 2 δ δ δ ¯x −¯ ω¯t ) ¯ , q¯ ) = Re[(u, ˆ vˆ , p, ˆ q)e ˆ i(k¯ A travelling-wave solution (¯ u, v¯, p ] is then sought. Assuming irrotational flow (Drazin & Reid 1981), the corresponding dispersion relation is eventually obtained as ¯ ω ¯ ) = (Dsolid + A)(Dfluid + E) + G = 0, D(k, (3.8)
where the terms on the right-hand side are given in Appendix A. In the above expression Dfluid and Dsolid are, respectively, the dispersion relations of the fluid flow and of the canopy motion without coupling and A, E and G are coupling terms ¯ For the sake of clarity the overbars on k¯ involving the drag-coupling coefficient C. ¯ will be omitted from now on. and ω For the analysis of the model, we use the mechanical and geometrical properties measured on the alfalfa crop, see table 1, a mean flow velocity U = 3 m s−1 and the flow-profile characteristics given in Raupach et al. (1996) for this type of canopy, ¯ = 2.9 × namely, R = 0.5 and δ = Rh. For the drag coefficient we use CD = 10−2 m (C 10−2 ), corresponding to a static deflection of the plants of 10 cm at their top for a wind velocity U = 3 m s−1 . These parameter values are used in the following analysis, except when specified otherwise. 3.2. Temporal-stability analysis of the coupled model The temporal stability of propagating waves in the wind and of the canopy motion is analysed by numerically calculating the complex frequency ω associated with a specified real wavenumber k. This is done by solving the dispersion relation (3.8) with the parameter values given above. Four temporal branches ω(k) result from the dispersion relation (3.8) with ωi = Im(ω) as the instability growth rate and ωr = Re(ω) as the temporal frequency. As k is varied a pocket of instability with ωi > 0 is found. Only the branch with the most amplified growth rate is considered, and this is illustrated in figure 7.
435
Lock-in in wind–crop interaction (a)
0.2 ωi ωimax 0.1
0
0.5
1.0 k max
1.5
2.0 (b)
2
ωr 1 ωrmax
0
0.5
1.0
1.5
2.0 (c)
0.4
ωr – k 0.2
0 0
0.5
1.0 k
1.5
2.0
Figure 7. The most unstable temporal branch derived from the model: the growth rate ωi , the frequency ωr and the effective frequency ωr − k (the same as ωr but without the advection) ¯ = 0, Kelvin–Helmholtz in a bounded domain; · · ·, vs. wavenumber k. —, coupled model; - -, C ¯ = 0 and h ¯ → ∞, Kelvin–Helmholtz in an infinite domain (Huerre & Rossi 1998). C
We first investigate the origin of the instability of the coupled system by varying ¯ and the canopy height h, ¯ figure 7. When decreasing C, ¯ the drag-coupling coefficient C ¯ the most unstable ωi (k) branch deforms and, for C = 0, coincides with the unstable branch of the Kelvin–Helmholtz instability in a bounded domain, i.e. the solution of Dfluid (k, ω) = 0; see figure 7(a). Then, as the non-dimensional canopy height ¯ = h/δ tends to infinity, the temporal Kelvin–Helmholtz branch for a piecewise h linear profile in an infinite medium is recovered, the most amplified wavenumber being at k max = 0.8 (Huerre & Rossi 1998). We may thus state that the unstable branch of the coupled model stems from the unstable Kelvin–Helmholtz branch. This shows that the mixing-layer instability remains the main instability mechanism over plant canopies when the wind and canopy dynamics are coupled.
436
C. Py, E. de Langre and B. Moulia (b)
(a) y
h+δ h
0
1
2 x
3
0
1
2
3
x
Figure 8. Velocity map of the flow perturbation {u, v} associated with the most unstable ¯ = 0; (b) coupled model, C ¯ = 2.9 × 10⁻² . In each case the wave: (a) uncoupled model, C ˆ normalization condition is taken to be u(h) = 1.
In addition, the mode shapes of the flow perturbation associated with the most unstable wave (k = k max , ω = ωrmax + iωimax ) of (3.8) are displayed in figure 8 for the coupled and uncoupled cases: the velocity field {u, v}(x, y) is slightly modified by the coupling but inherits the characteristics of the Kelvin–Helmholtz instability. The fact that the coupled wind–canopy instability is driven by a mixing-layer-type instability is in agreement with the experimental results and the theory proposed by Raupach et al. (1996). The wavelength of the instability is thus governed principally by the vorticity thickness δ of the mean wind profile, as found experimentally by Raupach et al. (1996). However, as the most unstable branch is deformed when the coupling ¯ is varied, see figure 7, the properties of this instability are modified coefficient C by taking into account the motion of the canopy. The wind and the wind-induced motion of the canopy are thus governed by a modified Kelvin–Helmholtz instability. Coupling by a drag force decreases the growth rate ωi (k) of the instability and, in particular, the maximum growth rate ωimax , see figure 7(a); dissipative effects in mixing layers are indeed known to be stabilizing, see for instance Panton (1996). The coupling also decreases the most amplified wavenumber k max , in our case by about 15%, figure 7(a). The decrease in k max due to the coupling is associated with a decrease in the temporal frequency ωrmax = ωr (k max ) of the unstable wave, see figure 7(b). It is therefore important to notice that the characteristic frequency resulting from the coupled instability is smaller than the frequency that would be predicted if only the stability of the flow profile were taken into consideration. Moreover, the peak in the temporal growth rate in figure 7(a) is narrower in terms of wavenumbers for the coupled model than it is for the uncoupled case. As a consequence, the instability is more selective in terms of wavenumbers when the fluid and solid dynamics are coupled. As in the case of the most unstable branch, the origin of the three other branches ¯ When of the coupled model may be understood by decreasing the drag coefficient C. ¯ C = 0, the dispersion relation (3.8) is reduced to Dfluid Dsolid = 0 and in this limit it can be shown that two branches correspond to the Kelvin–Helmholtz solution in a bounded domain and the √ two remaining branches correspond to the solution of the canopy equation, ω = ± r/m. Each of the four temporal branches is then deformed when coupling is taken into account.
Lock-in in wind–crop interaction
437
The stability analysis of the coupled fluid-structure model has shown that wind and wind-induced motion of the canopy are governed by a modified shear-layer instability. Taking into account the dynamics of the plants through a drag term does modify the instability characteristics. 3.3. Effect of the frequency of the canopy: a lock-in mechanism In this section we study the influence of the canopy parameters on the properties of the coupled instability. Keeping all other parameters constant, we vary the nondimensional flexural stiffness ¯r of the plants. Varying ¯r modifies the four temporal branches of the dispersion relation (3.8) and, in particular, it affects the shape of the most unstable ωi (k) branch shown in figure 7. We may therefore follow the paths of the most amplified wavenumber k max and of the corresponding growth rate ωimax and frequency ωrmax as the stiffness of the canopy is varied. The evolutions of ωimax and ωrmax as functions of the dimensionless frequency of the canopy, � ¯r 2πδ 1 = , (3.9) f¯0 = ¯ h Ur m are shown in figure 9. For completeness we also show the reference values corresponding to the uncoupled model of the pure mixing-layer instability with ¯ = 0. Note that the evolution of k max as a function of f¯0 (not shown) is equivalent C to that of ωrmax since k max and ωrmax are quasi-proportional to each other (exactly proportional in the pure Kelvin–Helmholtz instability); see figure 7(b). While the frequency ωrmax , figure 9(b), is found to be nearly constant for small and large values of f¯0 , there exists a range, in our case from f¯0 = 0.36 to 1.24, where it varies almost linearly with f¯0 , thus deviating from its asymptotic values. We may state that in this range the frequency of the instability locks onto the frequency of the plants as its value approaches and follows that of the plants. This is identical in form, but distinct in mechanism, to what is observed in vortex-induced vibrations (Williamson & Govardhan 2004), and the term ‘lock-in’ will be used from now on. In this same lock-in range the growth rate of the instability, ωimax , figure 9(a), also strongly deviates from its asymptotic regime and reaches a maximum near f¯0 = 0.8. The evolutions of ωrmax and ωimax described above result from the deformation of the most unstable branch of the dispersion relation (3.8) as we vary the parameters. In particular, the jumps of ωrmax shown in figure 9(b) occur as the most unstable ωi (k) branch displays two almost equally amplified bumps: varying f¯0 further, one bump, initially less amplified, becomes suddenly more amplified than the other, leading to a jump in k max and, consequently, in ωrmax . This also explains why these abrupt variations in the frequency are associated with a smooth variation in the growth rate. The selectivity of the instability in terms of wavenumbers is also affected by the variation in the canopy frequency f¯0 , as illustrated in figure 9(c). This selectivity, which we call S, is defined as the inverse of the passing band of wavenumbers for which the growth rate is above a certain threshold, say ωi /ωimax > 0.9, measured in terms of normalized wavenumbers k/k max . Figure 9(c) reveals that S is significantly increased in the lock-in interval when compared with the asymptotic values or those of the ¯ = 0). Moreover, the frequency f¯0 for which S is a maximum, i.e. uncoupled model (C for which the coupled instability is the most selective, is approximately equal to the frequency of the canopy leading to the maximum amplification of the growth rate (f¯0 = 0.8); see figures 9(a) and 9(c). The variation in S and the lock-in mechanism are therefore linked. In other words, the modification of the shear-layer instability by the frequency lock-in leads to a more selective coupled instability.
438
C. Py, E. de Langre and B. Moulia 0.11 (a)
0.10 ωimax 0.09
0.08
0
0.5
1.0
1.5
2.0
1.2 (b)
ωrmax
0.8
0.4 0
0.5
1.0
1.5
5
2.0 (c)
4 S 3
2 0
0.5
1.0 f0
1.5
2.0
Figure 9. Evolution of the growth rate ωimax , the frequency ωrmax and the selectivity S of the coupled instability with the natural vibration frequency of the plants f¯0 , showing a lock-in ¯ = 0); −.−, perfect frequency mechanism. —, present coupled model; · · ·, uncoupled model (C lock-in, where the instability frequency would be that of the plants (ωrmax ≡ f¯0 ).
3.4. Robustness of the lock-in mechanism The influence of the canopy stiffness on the characteristic frequency, growth rate and selectivity of the coupled instability was shown above using a fixed set of parameters for the model, namely, the properties of alfalfa plants given in table 1 and a drag ¯ = 2.9 × 10⁻² . Yet, depending for instance on the maturity of the plants, coefficient C
439
Lock-in in wind–crop interaction (a)
(b)
0.16
1.6
0.12
ωmax i 1.3 ω∞ i
ωmax i
0.08
1.0 0
0.5
1.0
1.5
2.0
0
1
0
1
2
1.2 1.5 1.0 1.0 ωmax r
0.8
ωrmax ω∞ r 0.5
0.6
0
0.5
1.0 f0
1.5
2.0
2 f0 / ω∞ r
Figure 10. Effect of the canopy mass and of the drag-coupling coefficient on the evolutions ¯ = 0.25; −.−, low mass, m ¯ = 0.01. (b) −.−, low of ωimax and ωrmax vs. f¯0 . (a) —, high mass, m −2 −2 ¯ ¯ drag, C = 1.4 × 10 ; · · ·, high drag, C = 4.3 × 10 .
their mass and geometry may vary. This variation is even more dramatic when plants from different species are compared: see for instance the difference in mass between alfalfa and wheat (table 1). In order to check whether the frequency lock-in shown above is an effect specific to the alfalfa crop or a more general mechanism, we now explore the effect of varying the parameters of the model. Two major effects on the evolutions of ωimax and ωimax are illustrated in figure 10: that of the inertia of the canopy, given by the non¯ and that of the level of coupling between the wind dynamics dimensional mass m, ¯ As far as the and the motion of the canopy, given by the drag-coupling coefficient C. ¯ mass is concerned, the influence of f0 is shown in figure 10a for a heavy and a light canopy by taking a mass three times higher than that of alfalfa (solid lines) and a mass two times smaller than that of wheat (dashed lines). In both cases, a behaviour similar to that before is found for the evolutions of ωrmax and ωimax : for intermediate values of the frequency of the canopy f¯0 the instability frequency locks onto f¯0 , with a marked increase in the growth rate. The frequency lock-in is more pronounced when the mass of the plants is high but persists over a larger interval of f¯0 when the
440
C. Py, E. de Langre and B. Moulia
canopy is light. The corresponding increase in growth rate in the lock-in interval is weaker for the heavy canopy. Considering a fixed mass of the canopy, we now study the effect of varying the drag¯ In the previous section, C ¯ = 2.9 × 10⁻² was considered; one coupling coefficient C. ¯ = 1.4 × 10⁻² and higher and one lower value are now taken into account, namely C −2 ¯ = 4.3 × 10 . The evolutions shown in figure 10(b) for both cases are normalized by C the asymptotic values of the growth rate and frequency, denoted ωi∞ and ωr∞ , obtained ¯ In this way, only the effect of C ¯ on the lockas f¯0 → ∞ for the particular value of C. in mechanism is investigated. First, figure 10(b) shows that the lock-in mechanism ¯ = 2.9 × 10⁻² persists at smaller and larger drag coefficients. described previously at C The lock-in range as well as the rate of change of ωrmax with f¯0 increase with the ¯ Moreover, the associated increase in the growth rate is stronger coupling coefficient C. ¯ increases. All this suggests that the more strongly the fluid and as the coupling C solid dynamics are coupled, the more the canopy oscillation is able to perturb, via the lock-in mechanism, the Kelvin–Helmholtz instability resulting from the inflectional wind profile. In the four cases shown in figure 10, the variations in the frequency and growth rate of the instability are associated with an increase in the selectivity S in the lock-in interval (not shown). An increase in S linked to the lock-in mechanism, as shown in figure 9(c), therefore persists at different mass and drag-coupling coefficients. We have shown that taking into account the motion of the canopy via the drag load affects the coupled instability. Not only does the canopy dynamics modify the properties of the Kelvin–Helmholtz waves, it also dominates the instability mechanism over a range of parameters. When the frequency of the canopy is close to the natural frequency of the instability, the latter deviates from the expected value and locks onto the free oscillation frequency of the plants, thus inducing an intensification of the instability and an increase in its selectivity. This mechanism must be robust, as it was shown to persist for plants of different mass and over a wide range of drag-coupling coefficients. 3.5. Elementary lock-in model In an attempt to clarify the lock-in mechanism by which the vibration frequency of the canopy dominates the instability frequency, we propose a simplified coupled model. In the complete model, § 3.1, the canopy is treated as a continuum of mechanical oscillators and is linked to the wind flow by a dissipative drag coupling. This model was shown to be governed by a modified Kelvin–Helmholtz instability. In a fixed point in space, the Kelvin–Helmholtz waves correspond to a temporal oscillation whose amplitude increases exponentially with time. The temporal flow dynamics may thus be represented schematically by an unstable fluid oscillator, denoted ϕ(t), with a characteristic mass, eigenfrequency and amplification rate, as in other analyses of lock-in, such as in the field of vortex-induced vibrations (Facchinetti et al. 2004; de Langre 2006). This fluid oscillator and the solid oscillator, q(t), which represents the canopy, are then coupled by a dissipative force, corresponding to the linearized drag load in (3.4) and (3.7) and dependent on the difference between their respective velocities. After normalization by the mass and frequency of the fluid oscillator, the simplified model is thus governed by the following set of coupled linearized equations: � � ∂ϕ ∂q ∂ϕ ∂ 2ϕ − ξ + ϕ = α − , (3.10) ∂t 2 ∂t ∂t ∂t
441
Lock-in in wind–crop interaction 1.05 0
1.00 ωmax r
–0.02 ωmax i
–0.04 0.5
1.5
1.0 Ω
0.95 0.5
1.0 Ω
1.5
Figure 11. The most amplified growth rate and the corresponding frequency derived from the elementary lock-in model as a function of the solid frequency Ω (α = 0.1, ξ = 0.02 and µ = 1).
� µ
∂ 2q + Ω 2q ∂t 2
�
�
� ∂q ∂ϕ = −α − , ∂t ∂t
(3.11)
where ξ is the instability growth rate of the fluid oscillator, µ and Ω are the nondimensional mass and eigenfrequency of the solid respectively and α is a coupling coefficient. ˆ −iωt ], the frequency equation is easily obtained as ˆ q)e Considering (ϕ, q) = Re[(ϕ, � � α2 α 2 2 2 (3.12) D(ω) = (−ω − i(α − ξ )ω + 1) − ω − i ω + Ω + ω2 = 0. µ µ A typical plot of the most unstable solution (ωimax , ωrmax ) derived from (3.12) as a function of the frequency Ω of the solid oscillator is shown in figure 11 for an arbitrary set of parameters. The essential characteristics of the frequency lock-in obtained for the complete wind–canopy model are captured by this elementary model: within a certain range of solid frequencies Ω, the most unstable frequency ωrmax deviates from its asymptotic regime and increases linearly with Ω, figure 11(b), while simultaneously the growth rate ωimax increases substantially, see figure 11(a). The maximum growth rate, obtained at the centre of the lock-in interval of Ω, is always reached for Ω = 1, which means that the most intense coupled instability occurs when the solid and fluid frequencies coincide. Outside the lock-in interval, for Ω small or large with respect to 1, the most unstable solution tends toward the solution of (3.10) when ∂q/∂t is neglected; in other words, the instability in this regime is governed by the fluid mode modified by the coupling coefficient α. The frequency lock-in persists as the parameters of the elementary model are varied. The width of the lock-in range increases with the coupling coefficient α and decreases with the mass µ of the solid. The rate of change of ωrmax with Ω as well as the relative amplification of ωimax both increase with α and µ. These results are qualitatively in agreement with what was found for the complete wind–canopy model, where Ω in the simple model played the role of f¯0 . This elementary model, in which two oscillators, one unstable and one neutral, are coupled together, recovers the main features of the frequency lock-in mechanism governing the wind–canopy interaction of our general model. We may therefore state that the modification of the shear-layer-type instability, when taking into account the canopy motion, mainly results from a coupling between two frequencies, the natural
442
C. Py, E. de Langre and B. Moulia (a)
λ h
(b)
4
2
2
f f0 1
0
2
4 Ur
6
0
2
4
6
Ur
Figure 12. The experimental results for the motion of alfalfa (*) and wheat (䊊) (reproduced from figure 5) with for comparison the predictions of the coupled model (—): (a) normalized wavelength and (b) normalized frequency, vs. reduced velocity. The dotted line (· · ·) represents the graphs resulting from the uncoupled mixing-layer-instability model, following Raupach et al. (1996).
frequency of vibration of the canopy and the frequency of the Kelvin–Helmholtz unstable waves related to the inflectional base flow. Note that although the mechanism of lock-in is often attributed to nonlinear phenomena, as in Facchinetti, de Langre & Biolley (2004), see also Williamson & Govardhan (2004), it corresponds in our case to a linear mechanism which may more simply be described by the coupling of two oscillators, as in de Langre (2006). 4. Comparison between the model and experimental results The predictions of the coupled wind–canopy model will now be compared with the experimental results for the coherent wave motion of crops under wind derived in § 2. In figure 12 the values of wavelength and frequency characterizing the coupled instability of the model are compared to the corresponding experimental values derived from the BOD analysis of the motion of the wheat and alfalfa crops. For the model, the characteristic wavelength was derived from the most unstable wavenumber k max and the frequency from ωrmax , both computed from the dispersion relation (3.8) using the experimental parameter values of alfalfa given in table 1 and varying the reduced wind velocity Ur = U/f0 h. For the sake of clarity only, we use the plant characteristics of alfalfa in the model for both crops. Figure 12 shows good qualitative and quantitative agreement between the experimental and theoretical dependences of λ/ h and f/f0 on Ur . Note that the apparent shift on both axes of the data points from the experiments on wheat mainly results from an overestimation of the value of f0 for wheat, as discussed in § 2.2. Moreover, the experimental points are mainly located in an interval of the reduced velocity Ur where the model predicts a lock-in of the instability frequency to the free-vibration frequency f0 of the plants. It is thus the lock-in mechanism suggested by the analysis of the coupled model that explains why the coherent wave motion of the crops occurs at their eigenfrequency independently of U , as revealed by the experiments. Note that the combined parameter c = λf , which is the phase velocity, would not show any lock-in behaviour: we have globally c ≈ U as in a Kelvin– Helmholtz instability. The vortical structures in the wind and the coherent motion of the plants are indeed due to a shear-layer-type instability linked to an inflectional
Lock-in in wind–crop interaction
443
wind profile. This Kelvin–Helmholtz mechanism would predict a wavelength set by the vorticity thickness of the profile, and thus independent of U , and furthermore a temporal frequency that increases with U (see the curves of the uncoupled model in figure 12). However, within the range of wind velocities from the experiments, the natural Kelvin–Helmholtz frequency is close to the free-vibration frequency f0 of the plants and, therefore, the instability frequency locks onto f0 via the mechanism described in § 3.3 and 3.5. As a consequence the frequency, see figure 12(b), and the wavelength, see figure 12(a), characterizing the wind and canopy motion are, respectively, constant and increasing with U ; both are dependent on the canopy rigidity. 5. Discussion and concluding remarks 5.1. On the consequences of lock-in The frequency lock-in of the shear-layer-type instability to the natural frequency of the canopy provides new insight into some features of the wind dynamics over waving wheat (Finnigan 1979) and into characteristics of the coherent wave motion of crops under wind. These new findings remained unexplained by the mixing-layer analogy of Raupach et al. (1996). The lock-in also confirms and clarifies the role of plant oscillations in the instability mechanism suggested by Finnigan (2004). Moreover, we showed in § 3.3 that the lock-in mechanism increases the growth rate of the instability as well as its selectivity. When locked onto the oscillation frequency of the plants, the coupled instability is thus stronger and more efficient in selecting a specific wavelength and frequency from the turbulent-disturbance environment. This intensification of the modified mixing-layer instability by the frequency lock-in might explain how this instability is able to develop over plant canopies in the presence of natural noise. Indeed the central frequency of the Kelvin–Helmholtz instability is known to be very sensitive to external noise (Huerre 2000): even in controlled laboratory experiments, the observation of the Kelvin–Helmholtz roll-up requires a forcing of the flow at the Kelvin–Helmholtz frequency. Questions have thus arisen about how the shear-layer instability can develop and persist in the wind over crops (Finnigan 2004). The role played by the oscillation of the plants, via the frequency lock-in mechanism, and its influence on the growth rate and selectivity of the instability make a valid contribution to explaining the occurrence of shear-layer-type instabilities on plant canopies. 5.2. On the behaviour outside the lock-in range Our experimental data fall within the range of the reduced velocities where lockin occurs (figure 12). Yet, if the plant canopy is very stiff or very compliant or, equivalently, if the wind velocity is very low or very high, in other words for extreme values of the normalized canopy frequency f¯0 or the corresponding reduced velocity Ur , the coupled instability falls outside the interval required for lock-in. We may explore, in particular, the behaviour of the coupled instability when the dynamics of the canopy is inhibited by very high plant stiffness (¯r → ∞). In this case, the dispersion relation (3.8) reduces to Dfluid + E = 0.
(5.1)
The instability properties derived from the analysis of (5.1) are not identical to those of the uncoupled instability, i.e. the Kelvin–Helmholtz instability solution of Dfluid = 0. To understand the nature of the coupled instability in this limit, an asymptotic
444
C. Py, E. de Langre and B. Moulia 0.9
0.2
0.1 ω∞ i 0.8
ω∞ r
0 0.7
0
0.02 C
0.04
0
0.02 C
0.04
Figure 13. Frequency and growth rate of the limit model (5.1) versus the drag-coupling ¯ the asymptotic approach (- -) and the exact solution (—) are shown for coefficient C: comparison. The evolution of the wavenumber is equivalent to that of the frequency.
analysis of the stiff dispersion relation (5.1) is needed, where we assume the effect of the coupling term E to be small. This asymptotic analysis is detailed in Appendix B. The most amplified frequency and growth rate derived from the asymptotic analysis, ¯ may be compared to the exact (B 9), as a function of the drag-coupling coefficient C solution of (5.1) in figure 13. The asymptotic analysis provides a good estimation of ¯ ≈ 0.03. The accuracy of the asymptotic the frequency ωr∞ and growth rate ωi∞ up to C approach shows that in the limit ¯r → ∞ the instability is principally governed by the Kelvin–Helmholtz mechanism (Dfluid ) but modified by the coupling term E. The major effect of the coupling is to decrease the instability growth rate (figure 13). The coupling also yields a small increase in the frequency (and wavenumber) of the instability. The reason for this is rather complex; the frequency is expected to decrease with dissipation rather than increase as is the case here. If we consider the stiff model ¯ → ∞, which weakens the impact of the impermeability boundary (5.1) in the limit h condition on the ground, the coupling no longer has an effect on the instability ¯ whereas ωi∞ still decreases with C, ¯ frequency: ωr∞ is found to be constant with C, although at higher values. The modification of the Kelvin–Helmholtz frequency by the coupling for the case of a stiff canopy is thus related to the finite height of the canopy. We note that Dfluid itself is also affected by the canopy height (see the decrease ¯ → ∞ to finite h ¯ in figure 7a). The most amplified frequency of Dfluid , of ωimax from h ¯ however, is not modified by h. To conclude, the instability for the case of a stiff canopy may be seen as a shearlayer instability in a bounded domain modified by a dissipative term. Taking into account the presence of a stiff canopy induces a damping of the growth rate and a positive shift of both the frequency and the wavenumber of the instability that is related to the finite height of the canopy. These coupling effects are also present to various degrees in the general model for a flexible canopy but are small compared with the variations induced by the lock-in. Note that the behaviour of the instability obtained for the limit f¯0 → 0 or Ur → ∞ is less realistic, since in this limit the assumption of small canopy deflection becomes questionable. 5.3. On possible extensions of the model The model considered in this study is linear and, consequently, finite amplitudes of the unstable modes cannot be reached. In the experiments presented in this paper the
445
Lock-in in wind–crop interaction 0.15
(a)
(b)
0.06
0.10 W ___ ωih
W (m s–1) 0.03
0
0.05
2 U (m s–1)
4
0
2
4 Ur
Figure 14. Intensity of the motion of the crop canopy as a function of the wind velocity. (a) Dimensional data, (b) normalized data. *, alfalfa; 䊊, wheat.
amplitudes of the motion of the crop under wind can be measured. For each recorded sequence the amplitude may be expressed as a space-averaged velocity W , defined by Ns 1 � σ 2 (Mj ), W = Ns j =1 2
(5.2)
where σ (Mj ) is the standard deviation of V (t) at a point Mj (x, z), and Ns is the number of spatial nodes. The results are presented in figure 14(a) as a function of the mean wind velocity U for both canopies. To normalize the data we use the growth rate ωimax of the coupled instability resulting from the respective parameter values for wheat and alfalfa and the given value of U . The growth rate derived from the linear model is expected to show some influence on the amplitude, whatever the limiting mechanism may be. The plot of W/ωimax h as a function of the reduced velocity Ur , depicted in figure 14(b), shows reasonably good agreement between the data for the two canopies, once again demonstrating the role of the plants’ rigidity on the characteristics of their motion. The apparent shift of a few data points for wheat is likely to be caused by an underestimation of f0 for wheat, owing to the biological variability of the plants’ properties, as already discussed § 2.2, and by the linearity of the model providing the instability growth rate. These experimental results can be used to validate nonlinear models, which should include nonlinearities in the equations for both the fluid and the solid. They can also be used by themselves as input data for thigmomorphogenetic analyses. We note that other fluid–structure interaction problems, such as the vibration of sets of elastic rods in cross flows, studied by Moon & Kuroda (2001) and, more recently, by Br¨ ucker & Smith (2005), may help us to understand these nonlinear aspects. Another limit of the present model is its focus on only two-dimensional primary instabilities. The mixing-layer instability of wind over plant canopies rapidly becomes three-dimensional; however, the main spatio-temporal characteristics of the twodimensional primary waves are known to be preserved in three dimensions (Finnigan 2000). The extension of the present model to include an additional degree of freedom for the plants and flow motion would constitute an interesting topic for future work. In the experiments described here we have focused only on the principal streamwise wavelengths of the spatial structures, but data is available to characterize the complete horizontal motion of the canopy. The full coupling between the three-dimensional
446
C. Py, E. de Langre and B. Moulia
instability of the wind and the two-dimensional horizontal motion of the canopy surface remains an open problem. A plant canopy with homogeneous properties has been considered in this study although crop plants are known to display a high variability in their properties. It is thus remarkable that an agreement between the results of the model and those of the experiments was reached despite the data dispersion in the sampled plants and despite the artificial homogeneity of the canopy in the theoretical model. A further extension of the model would incorporate a statistical variability of the mechanical parameters in the canopy. 5.4. Concluding remarks The mechanical system considered in this study is quite complex in many aspects. The wind dynamics near the top of a crop canopy can be expected to behave differently from that over more classical boundaries. The canopy, modelled as a vibrating continuum made up of a large number of plants, significantly differs from structures usually considered in flow-induced vibration analyses. Each plant is mechanically unique, and the interactions between plants can be highly nonlinear and dissipative. Moreover, the two mechanical components, fluid and solid, are naturally coupled through an interface of considerable complexity, consisting of the leaves and stems of all plants. Notwithstanding this complexity, regular propagating patterns have routinely been observed on canopies, such as honamis in waving wheat. First steps toward understanding this striking simplicity were made in the pioneering work of Raupach et al. (1996), when measurements of wind over crops and forests showed that a mixing-layer instability plays a dominant role. We have shown, both experimentally and theoretically, that the crop dynamics also plays an important role in the build-up of these propagating patterns, through a lock-in mechanism. The experimental approach and the model proposed here can build the foundation for the characterization and understanding of the flow-induced motion of many types of systems: natural or grown canopies under wind; submerged aquatic vegetations under sea and river currents; and, more generally, dense sets of flexible systems transversely bounding a flow. We acknowledge the help of Didier Combes and Christophe de Berranger from INRA (UEPF), as well as Antoine Garcia and Pascal H´emon from LadHyX, for the experimental work. We also thank Yves Brunet from INRA (EPHYSE) for fruitful discussions, Nigel Peake (DAMTP, Cambridge) for help and suggestions in the asymptotic analysis, and Peter J. Schmid from LadHyX for careful reading and correction of the paper. The support of a Monge scholarship from Ecole Polytechnique for the first author is also acknowledged. Appendix A. Dispersion relation Below we give the terms of the dispersion relation (3.8): ¯ 2 + ¯r , Dsolid = −mω ¯ h(R ¯ − 1)ω/3, A = −iC � � � ¯ ¯ Dfluid = 4k 2 −e−2k R 2 + e−2hk R (R + 1)k − ω − R − e−2(1+h)k R (1 − R)k
− ω − R + R 2 + k 2 (R 2 − 1) − 2k(R 2 − ω) − ω2 ,
Lock-in in wind–crop interaction � � � 2 ¯ ¯ ¯ 2 (R − 1)e−2(1+h)k ¯l , E = −2iCk (1 + e2hk ) R + e2k (R + 1)k − ω − R � ¯ ¯ ¯ ¯ ¯ + ehk ¯ 2 ωe−2(1+h)k (ehk − 1)(R − 1)2 1 + hk (−1 + hk) G = −2C � � � 2 ¯¯l . × R + e2k (R + 1)k − ω − R h
447
Note that these differ slightly from Py et al. (2004), where one of the terms was incorrectly integrated. Appendix B. Asymptotic analysis The asymptotic analysis of the coupled model for a stiff canopy (§ 5.2), detailed below, uses an approach introduced by Peake (1997). We assume that the stiff model (5.1) is governed by the following dispersion relation: D(k, ω) + �E(k, ω) = 0,
(B 1)
with � � 1 and where D is Dfluid . Let (k0 , ω0 ) be the most unstable solution of D, so that ∂ωi D(k0 , ω0 ) = 0 and (B 2) (k0 , ω0 ) = 0. ∂k Including the effect of the coupling term E, the most unstable point becomes k = k0 + ��k, ω = ω0 + ��ω, with � � 1, and solves the equations ∂ωi (k, ω) = 0. (B 3) ∂k The first-order expansion of (B 1) near (k0 , ω0 ) gives a first equation for �k and �ω, (B 4) �kDk + �ωDω + E = 0, where Dj denotes the derivative of D with respect to j . Differentiating (B 1) with respect to k leads to Dk + �Ek ∂ω , (B 5) =− ∂k Dω + �Eω which, in turn, may be expanded to first order around (k0 , ω0 ) (Peake 1997): � � �kDkk + �ωDkω + Ek Dk (�kDkω + �ωDωω + Eω ) Dk ∂ω . +� − + (k, ω) = − ∂k Dω Dω Dω2 (B 6) D(k, ω) + �E(k, ω) = 0 and
Condition (B 3) requires that the imaginary part of ∂ω/∂k is zero at (k, ω). By the definition (B 2) of (k0 , ω0 ), together with (B 4), we see that the imaginary part of −Dk /Dω = (∂ω/∂k)(k0 , ω0 ) is zero. We thus obtain a second equation for �k and �ω: � � Dk (�kDkω + �ωDωω + Eω ) �kDkk + �ωDkω + Ek = 0. (B 7) + Im − Dω Dω2 Solving equations (B 4) and (B 7) finally leads to �� Im EDkω Dω − EDk Dωω − Ek Dω2 + Dk Eω Dω /Dω3 �� , �k = − Im − Dkk Dω2 + 2Dk Dkω Dω − Dk2 Dωω /Dω3 E + �kDk �ω = . Dω
(B 8) (B 9)
448
C. Py, E. de Langre and B. Moulia REFERENCES
Aubry, N., Guyonnet, R. & Lima, R. 1991 Spatiotemporal analysis of complex signals: theory and applications. J. Statist. Phys. 64, 683–739. Baker, C. J. 1995 The development of a theoretical model for the windthrow of plants. J. Theror. Bio. 175, 355–372. Blevins, R. D. 1990 Flow-Induced Vibration. Van Nostrand Reinhold. ¨ cker, Ch. & Smith, M. 2005 Wake interaction of arrays of flexible cylinders in boundary Bru layer flows. In Fourth Conference on Bluff Body Wakes and Vortex-Induced Vibrations (ed. T. Leweke & C. H. K. Williamson), Santorini, Greece, 21–24 June, pp. 291–294. Brunet, Y. & Irvine, M. R. 1999 The control of coherent eddies in vegetation canopies: streamwise structure spacing, canopy shear scale and atmospheric stability. Boundary-Layer Met. 94, 139–163. Doare´ , O., Moulia, B. & de Langre, E. 2004 Effect of plant interaction on wind-induced crop motion. Trans. ASME: J. Biomech. Engng 126, 146–151. Drazin, P. G. & Reid, W. H. 1981 Hydrodynamic Stability. Cambridge University Press. Facchinetti, M., de Langre, E. & Biolley, F. 2004 Coupling of structure and wake oscillators in vortex-induced vibrations. J. Fluids Struct. 19 (2), 123–140. Farquhar, T., Zhou, J. & Haslach, H. 2003 A possible mechanism for sensing crop canopy ventilation. In Sensors and Sensing in Biology and Engineering (ed. F. Barth, J. Humprey & T. Secomb), Ch. 15. Springer. Finney, D. J. 1964 Statistical Method in Biological Assay. Charles Griffin, London. Finnigan, J. J. 1979 Turbulence in waving wheat. I. Mean statistics and honami. Boundary-Layer Met. 16, 181–211. Finnigan, J. J. 2000 Turbulence in plant canopies. Annu. Rev. Fluid Mech. 32, 519–571. Flesch, T. K. & Grant, R. H. 1991 The translation of turbulent wind energy to individual corn plant motion during senescence. Boundary-Layer Met. 55, 161–177. Flesch, T. K. & Grant, R. H. 1992 Corn motion in the wind during senescence: II. Effect of the dynamic plant characteristics. Agronomy J. 84 (4), 748–751. Ghisalberti, M. & Nepf, H. M. 2002 Mixing layers and coherent structures in vegetated aquatic flows. J. Geophys. Res. 107 (C2), 1–11. He´ mon, P. & Santi, F. 2003 Applications of biorthogonal decompositions in fluid-structure interactions. J. Fluids Struct. 17, 1123–1143. Huerre, P. 2000 Open shear flow instabilities. In Developments in Fluid Mechanics: A Collection for the Millenium (ed. G. K. Batchelor, H. K. Moffatt & M. G. Worster). Cambridge University Press. Huerre, P. & Rossi, M. 1998 Hydrodynamic instabilities in open flow. In Hydrodynamics and Nonlinear Instabilities (ed. C. Godr`eche & P. Manneville), pp. 81–294. Cambridge University Press. Inoue, E. 1955 Studies of the phenomena of waving plants (”honami”) caused by wind. Part 1: Mechanism and characteristics of waving plants phenomena. J. Agric. Met. (Japan) 11, 71–82. Jaffe, M. 1973 Thigmomorphogenesis: the response of plant growth and development to mechanical dioica. Planta 114, 143–157. de Langre, E. 2006 Frequency lock-in is caused by coupled-mode flutter. J. Fluids Struct. 22, 783–791. Moon, F. C & Kuroda, M. 2001 Spatio-temporal dynamics in large arrays of fluid-elastic, Toda-type oscillators. Phys. Lett. A 287, 379–384. Moulia, B. & Combes, D. 2004 Thigmomorphogenetic acclimation of plants to moderate winds greatly affects height structure in field-gown alfalfa (medicago sativa l.), an indeterminate herb. Comp. Biochem. Physiol. A: Molec. Integrative Physiol. 137 (3-S1), 77. Panton, R. L. 1996 Incompressible Flow . Wiley-Interscience. Peake, N. 1997 On the behavior of a fluid-loaded cylindrical shell with mean flow. J. Fluid Mech. 338, 347–410. Py, C., de Langre, E. & Moulia, B. 2004 The mixing layer instability of wind over a flexible crop canopy. C. R. M´ec. 332, 613–618. Py, C., de Langre, E., Moulia, B. & He´ mon, P. 2005 Measurement of wind-induced motion of crop canopies from digital video images. Agric. Forest Met. 130, 223–236.
Lock-in in wind–crop interaction
449
Raffel, M., Willert, C. E. & Kompenhans, J. 1998 Particle Image Velocimetry: A Practical Guide, 3rd edn. Springer. Raupach, M. R., Finnigan, J. J. & Brunet, Y. 1996 Coherent eddies and turbulence in vegetation canopies: the mixing layer analogy. Boundary-Layer Met. 78, 351–382. Raupach, M. R. & Thom, A. S. 1981 Turbulence in and above plant canopies. Annu. Revi. Fluid Mech. 13, 97–129. Williamson, C. H. K. & Govardhan, R. 2004 Vortex induced vibrations. Annu. Rev. Fluid Mech. 36, 413–455.