J Neurophysiol 113: 1819 –1830, 2015. First published December 24, 2014; doi:10.1152/jn.00472.2014.
A function for binaural integration in auditory grouping and segregation in the inferior colliculus Kyle T. Nakamoto,1,2 Trevor M. Shackleton,1 David A. Magezi,3 and Alan R. Palmer1 1
Medical Research Council Institute of Hearing Research, University Park, Nottingham, United Kingdom; 2Department of Anatomy and Neurobiology, Northeast Ohio Medical University, Rootstown, Ohio; and 3Laboratory for Cognitive and Neurological Sciences, Neurology Unit, Department of Medicine, Faculty of Science, University of Fribourg, Fribourg, Switzerland Submitted 27 June 2014; accepted in final form 21 December 2014
Nakamoto KT, Shackleton TM, Magezi DA, Palmer AR. A function for binaural integration in auditory grouping and segregation in the inferior colliculus. J Neurophysiol 113: 1819 –1830, 2015. First published December 24, 2014; doi:10.1152/jn.00472.2014.—Responses of neurons to binaural, harmonic complex stimuli in urethaneanesthetized guinea pig inferior colliculus (IC) are reported. To assess the binaural integration of harmonicity cues for sound segregation and grouping, responses were measured to harmonic complexes with different fundamental frequencies presented to each ear. Simultaneously gated harmonic stimuli with fundamental frequencies of 125 Hz and 145 Hz were presented to the left and right ears, respectively, and recordings made from 96 neurons with characteristic frequencies ⬎2 kHz in the central nucleus of the IC. Of these units, 70 responded continuously throughout the stimulus and were excited by the stimulus at the contralateral ear. The stimulus at the ipsilateral ear excited (EE: 14%; 10/70), inhibited (EI: 33%; 23/70), or had no significant effect (EO: 53%; 37/70), defined by the effect on firing rate. The neurons phase locked to the temporal envelope at each ear to varying degrees depending on signal level. Many of the cells (predominantly EO) were dominated by the response to the contralateral stimulus. Another group (predominantly EI) synchronized to the contralateral stimulus and were suppressed by the ipsilateral stimulus in a phasic manner. A third group synchronized to the stimuli at both ears (predominantly EE). Finally, a group only responded when the waveform peaks from each ear coincided. We conclude that these groups of neurons represent different “streams” of information but exhibit modifications of the response rather than encoding a feature of the stimulus, like pitch. inferior colliculus; pitch; harmonic complex; binaural integration IN A QUIET ROOM, speech can be understood with one ear and there is little additional benefit of using two ears; however, in noisy environments, or when there are multiple speakers, there is a significant advantage to binaural hearing (Dirks and Wilson 1969; Hawley et al. 1999; MacKeith and Coles 1971; Peissig and Kollmeier 1997). One advantage is the ability to compare and contrast the signal entering each ear (binaural unmasking: Hirsh 1948; binaural squelch: MacKeith and Coles 1971). While there have been psychophysical studies measuring the manner in which complex sounds are integrated between the ears, there have been fewer physiological studies (Chen and Sinex 1999; Shackleton et al. 2009). In this report we investigate the physiology underlying binaural integration of harmonic complexes.
Address for reprint requests and other correspondence: K. T. Nakamoto, Northeast Ohio Medical Univ., 4209 State Rt. 44, PO Box 95, Rootstown, OH 44272-0095 (e-mail:
[email protected]). www.jn.org
Harmonic complexes are important components of speech, music, and some animal communications (including guinea pig calls: Berryman 1976; Grimsley et al. 2012). Harmonic complexes create a perception of pitch, a perceptual grouping feature that has received particular attention (reviewed in Plack et al. 2005; Wang and Bendor 2010). A harmonic complex is composed of a tone at the fundamental frequency (f0) and tones at integer multiples of the f0 (e.g., 125, 250, 375, etc.). Perceptually the components of the harmonic complex fuse and create a perception of a pitch at the f0; this occurs even when the component at the f0 is missing (Von Helmholtz 1863). Pitch stimuli are particularly useful for studying binaural integration. There are two lines of evidence indicating that pitch perception can occur after binaural integration. First, there are several pitch phenomena that depend on binaural processing (reviewed in Culling et al. 1998a, 1998b). Second, the ear of presentation of components of a sound does not make a substantial difference in pitch perception, i.e., the auditory system handles monaural pitch information in a manner similar to binaural pitch information (Bernstein and Oxenham 2003; Houtsma and Goldstein 1972). Since presenting the components of pitch stimuli to opposite ears avoids interactions between the components before binaural integration occurs, this means that more central (after binaural integration) processing is necessary to identify the pitch in such dichotic stimuli. To study the temporal representation of pitch, and avoid place cues, we recorded from cells with characteristic frequencies (CFs) ⬎ 2 kHz. Multiple components of the harmonic complex at high frequencies (e.g., 4,375, 4,500, 4,625 Hz) fall into a single auditory filter (analogous to a tuning curve) and are considered to be “unresolved” (Glasberg and Moore 1990; Shackleton and Carlyon 1994). In humans, the pitch percept caused by “unresolved” components is substantially weaker than the pitch percept caused by “resolved” components (when only a single component falls within an auditory filter). However, some authors have proposed that “resolved” components are “neither necessary nor sufficient to support accurate pitch perception” (Bernstein and Oxenham 2008), and because of poor frequency selectivity, hearing-impaired listeners and cochlear implant users may rely more on unresolved components to determine pitch (Moore and Carlyon 2005). Plack et al. (2005) list further reasons why “unresolved” components are worthy of attention. The inferior colliculus (IC) is a near-obligatory relay for monaural and binaural ascending auditory information (excep-
0022-3077/15 Copyright © 2015 the American Physiological Society
1819
BINAURAL INTEGRATION IN INFERIOR COLLICULUS
tions: Anderson et al. 2006; Schofield et al. 2014), but little is known about the relationship between binaural integration and pitch perception at this level. A substantial number of neurons in the IC are affected by binaural cues. Specifically, ⬃50% of the neurons are excited by a contralateral stimulus and inhibited by an ipsilateral stimulus (EI) and 7–22% are excited by both a contralateral and an ipsilateral stimulus (EE) (Irvine and Gago 1990; Schreiner and Langner 1988; Semple and Aitkin 1979). Given the abundance of binaural neurons in the IC, it seemed likely that they would be involved in binaural integration and the processing of pitch. For this report, harmonic complexes with different f0s were presented to each ear in order to further investigate the effect of the ipsilateral stimuli on the responses of IC units. The response to these dichotic harmonic complexes suggests that different neurons serve to compare and contrast periodicity information between the ears, thereby enhancing the differential representation of one or another harmonic complex. The implications for pitch processing, auditory grouping, and segregation are discussed.
A
Ipsilateral Waveform 145 Hz f0
Contralateral Waveform 125 Hz f0
Right IC
B
Times when waveform peaks are approximately coincident
100 Amplitude (%)
1820
50
0 0
50
MATERIALS AND METHODS
Eight pigmented guinea pigs of both sexes and weighing 500–800 g contributed to this study. All experiments were performed under the terms and conditions of licenses issued by the UK Home Office under the Animals [Scientific Procedures] Act 1986 and the approval of the Ethical Review Committee of the University of Nottingham. Anesthesia and Surgical Preparations In all animals, anesthesia was induced with urethane (1.1 g/kg in 20% solution ip) supplemented as necessary, to maintain suppression of the pedal withdrawal reflex, by Hypnorm (fentanyl citrate 0.315 mg/ml, fluanisone 10 mg/ml; 0.2 ml im). Body temperature was maintained at 38°C with a heating blanket and a rectal probe (Harvard Apparatus Homeothermic Blanket Control unit 50787, Edenbridge, UK). A premedication of 0.2 ml of atropine (600 l/ml sc) was administered in order to reduce bronchial secretions. The trachea was cannulated to reduce dead space and allow the animals to be artificially respired with 100% oxygen throughout the experiment (Harvard Apparatus model 970 ventilator). End-tidal carbon dioxide levels and heart rate (via electrodes either side of the thorax) were monitored (Vetspecs VSM8, Canton, GA). Clear access to the auditory meatus was achieved by removing part of the tragus. The animal was placed into a stereotaxic frame with earbars consisting of hollow Plexiglas specula so that the tympanic membranes were visible. Polythene tubes (0.5-mm inner diameter, 250- to 400-mm length) were inserted and sealed into the bullae to allow pressure equalization while maintaining closed-field sound presentation. An opening was made in the connective tissue above the foramen magnum to release pressure variations in the cerebrospinal fluid to increase recording stability. A 4 ⫻ 4-mm craniotomy was performed over the right IC. The dura mater was removed and the exposed cortex covered with agar (1.5% agar in 0.9% normal saline) to avoid desiccation and to stabilize recordings. Recordings were made in the right IC (Fig. 1) with four to eight individual glass-coated tungsten electrodes (Bullock et al. 1988) attached to a single circuit board, with tips aligned and separated by ⬃200 m. These arrays were advanced together with a piezoelectric motor (Burleigh Inchworm IW-700/710). The electrode signals were recorded and band-pass filtered (0.16 – 6,000 Hz) with a high-impedance headstage [TDT RA16AC, Tucker-Davis Technologies (TDT), Alachua, FL] and then digitized (TDT RA16PA). The digitized action potentials were further band-pass filtered (300 –3,000 Hz) and ampli-
100 Time (ms)
150
200
Contralateral waveform (125 Hz f0) Ipsilateral waveform (145 Hz f0)
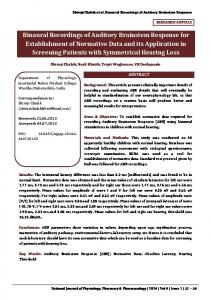
Fig. 1. A: schematic of recording and stimulus. Electrode arrays were placed into the right inferior colliculus (IC). The stimuli were harmonic complexes with different fundamental frequencies presented to the left [fundamental frequency (f0) of 125 Hz] and right (f0 of 145 Hz) ears. B: 200 ms of the waveforms, with the contralateral waveform in black and the ipsilateral in gray. Double-headed arrows mark the times when the waveforms peaks are exactly in phase, every 200 ms (the fundamental of the entire complex). Single-headed arrows mark the times when the waveforms peaks are nearly coincident, approximately every 50 ms (the period of the difference frequency).
fied with a digital signal processor (TDT RX7) controlled by BrainWare software (Jan Schnupp, Oxford University). Short portions of the units’ action potentials were recorded whenever the amplitude crossed a threshold, set individually for each unit. These action potentials were analyzed with Plexon Offline Spike Sorter (v2.8.8, Dallas, TX). Responses were checked for systematic shifts over time and discarded if a change was noted. Analyses and graphical representations were performed in MATLAB (MathWorks, Natick, MA) and SigmaPlot (Systat, San Jose, CA). Only units with CFs above 2 kHz were analyzed so the response would be to unresolved harmonics (Glasberg and Moore 1990; Shackleton and Carlyon 1994). The tuning curves of units with lower CFs are narrower than those of units with higher CFs. Consequently, units with lower CFs respond to fewer harmonics and can be dominated by individual harmonic components. Restricting study to units responding to unresolved harmonics will ensure that the synchronization of the unit to the f0 was caused by the interactions of components within its response area and not simply synchronization to the pure tone at the f0. Histology During the withdrawal of the electrode, electrolytic lesions were made in some of the tracks by passing a current of 5 A for 10 s (electrode negative) through the electrode. At the end of the experiment, the animal was given an overdose of pentobarbital and perfused with 4% paraformaldehyde. The brain was removed and sectioned at 50 –100 m on a vibratome. Sections were stained for cytochrome oxidase. The electrode tracks were located by using the electrolytic lesions to provide confirmation of the recording locations within the
J Neurophysiol • doi:10.1152/jn.00472.2014 • www.jn.org
BINAURAL INTEGRATION IN INFERIOR COLLICULUS
1821
IC. In the later experiments, the electrodes were dipped in cresyl violet before the experiment (10 dips, 1–2 s in the solution, 1 min drying after each dip; Lim and Anderson 2007); consequently, the electrode tracks were clearly visible in the sections. The recordings reported here were from the central nucleus of the IC.
In addition to the dichotic harmonic complexes, we also recorded responses to a combination of the 125 Hz and 145 Hz harmonic complexes presented monaurally to the contralateral ear (see Nakamoto et al. 2010 for stimulus details and results) in order to contrast the binaural and monaural responses.
Stimulus Generation
Data Analysis
All stimuli were generated with BrainWare using a TDT RX8 Digital Signal Processor, which contains 24-bit sigma-delta digitalto-analog converters. The signal levels were controlled with programmable attenuators (TDT PA5). The maximum output of the sound system was limited to ⬃100 dB SPL. Stimuli were presented either binaurally or monaurally within sealed acoustic systems. The speakers used were custom-modified Radio Shack 40-1377 tweeters fitted into the hollow specula via critically damped tubes (diameter 2.5 mm, length 24 mm; M. Ravicz, Eaton Peabody Laboratory, Boston, MA). The sound system was calibrated at the beginning of each experiment with a ½-in. Brüel and Kjær 4134 condenser microphone connected to a calibrated 1-mm probe tube (Brüel and Kjær DB 0241). The end of the probe tube was positioned within the speculum in close proximity to the tympanic membrane. The calibration sound was white noise, presented 20 times. The system response was calculated by Fourier transforming the microphone waveform and correcting for microphone sensitivity and probe tube characteristics. Stimulus and Recording Paradigms The search stimulus was diotic white noise (duration 100 ms) gated on and off with cosine-squared ramps lasting 8 ms, with a repetition period of 500 ms, and a manually variable level. When a unit was isolated the minimum tone response threshold was determined and the frequency response area measured using a single repeat each of diotic 100-ms-duration pure tones presented in pseudorandom order from 400 to 25,600 Hz in half-octave steps over a 0 –100 dB range in 5-dB steps with interstimulus interval of 400 ms. The wide frequency range allowed response areas of neurons on more than one electrode to be simultaneously measured even when the CFs of the recorded neurons might differ. The experimental stimuli were two harmonic complexes with f0s at 125 Hz and 145 Hz (Fig. 1), presented simultaneously. The 125 Hz harmonic complex was presented to the left ear (contralateral to the recording site), and the 145 Hz harmonic complex was presented to the right ear (ipsilateral to the recording site; Fig. 1). All harmonics (integer multiples of f0) below 20 kHz were present, in cosine phase. The length of the stimulus was 400 ms, with no smoothing of the onset or offset. The shortest time over which an integer number of periods of both the 125 Hz and the 145 Hz complexes occurs is 200 ms (see Fig. 1B; 25 periods of 125 Hz and 29 periods of 145 Hz), at which time the waveform peaks are exactly coincident. Because the difference frequency is 20 Hz (145 ⫺ 125) the envelopes align in phase every 50 ms (although not necessarily at the peak). As indicated in Fig. 1, the peaks in the waveforms are approximately coincident in time at each of the 50-ms intervals within the 200-ms repetition time (Fig. 1B). This becomes important when considering the timing of the responses to the two harmonic complexes. Stimuli presented to the contralateral ear generally produce stronger responses in the IC, especially in high-frequency units (Shackleton et al. 2009). Both harmonic complexes were varied parametrically over three levels, 40, 50, and 60 dB SPL per component (resulting in 9 level combinations). Responses to 15 or 30 repeats of each stimulus combination were obtained. To remove onset effects, the first complete stimulus repetition was discarded and only the last 200 ms was analyzed. Consequently, only neurons that had a continuous response to the stimulus were analyzed, but such responses are common with these stimuli in the IC (Sinex and Li 2007).
Unit selection. We recorded from 96 units (CF ⬎ 2 kHz) in the central nucleus of the right IC (Table 1). Five units responded only at the onset/offset of the stimulus. Eighteen units had weak responses or no responses to the dichotic stimulus but had a robust response to the monaural stimulus. Finally, we did not include three units because they had no monaural response and did not fit into the binaural classifications used in this report. This left 70 units that were analyzed further. Binaural classification. The binaural classification scheme of Irvine (1986) is well established; however, it requires a comparison of the monaural and binaural responses to pure tones, which were not collected in this study. Instead, we use a classification based upon the responses to the harmonic stimuli. The definitions are likely to be congruent, so we have used the same nomenclature; however, it is possible that there would be some differences in classification if both analyses were performed on the same units. All 70 units selected were excited by contralateral stimuli (total spike count ⬎100 spikes across 15 repeats), and so a classification was developed based upon the effect of the ipsilateral stimulus on firing rate (Table 1). A multiple linear regression model was created for each unit using the contralateral and ipsilateral stimulus levels as explanatory variables and spike count as the dependent variable. An ANOVA was done on the output of the model to determine the significance of the ipsilateral stimulus level. If the ipsilateral stimulus level was a significant (P ⬍ 0.05) predictor of the spike count and the spike count increased with increases in ipsilateral level (positive coefficient estimate in the linear regression), then the unit was classified as ipsilaterally excitatory (EE). If the ipsilateral stimulus level was a significant (P ⬍ 0.05) predictor of the spike count and the spike count was reduced with increases in ipsilateral level (negative coefficient estimate in the linear regression), then the unit was classified as ipsilaterally inhibitory (EI). Finally, if the ipsilateral level was not a significant predictor of spike count (P ⬎ 0.05), then the unit was classified as no change (EO). Vector strength. Because the temporal structure of the two harmonic complexes is different, the degree of synchronization to the temporal structure of each can be independently determined from a Fourier transform (described in detail in Nakamoto et al. 2010). In brief, the poststimulus time histogram of the last 200 ms (bin width: 0.125 ms) was Fourier transformed and each component normalized by the total number of spikes in the histogram (DC component); this yields a measure exactly equivalent to the vector strength (Ashida et al. 2010; Goldberg and Brown 1969). The vector strength can vary between 0, indicating no synchronization, and 1, for perfect locking.
Table 1. Counts of different classes of units in this study Classification
Unit Count
Monaural response, low binaural response Offset/onset response Binaural response, low monaural response EE EI EO
18 5 3 10 23 37
The first 3 classes were distinguished by there being no strong sustained excitatory effect of the contralateral waveform in the binaural stimulus. The last 3 classes were defined according to a regression analysis of the effect of the ipsilateral level upon firing rate (see Binaural classification). The majority of the analyses in this report were only performed on these latter units.
J Neurophysiol • doi:10.1152/jn.00472.2014 • www.jn.org
1822
BINAURAL INTEGRATION IN INFERIOR COLLICULUS
Vector strengths were considered to be reliable if they were calculated from responses with ⬎50 spikes. Simulations using samples of 50 spike times randomly drawn from von Mises distributions with varying vector strengths (Mardia and Jupp 2000) indicated that 90% of estimated values were within 0.1 of the true value for vector strengths ⬎ 0.2. Only reliable vector strengths by this definition are shown in this report. Relative envelope peak interval function. The responses of some units that synchronized well to the contralateral stimulus were phasically reduced by the ipsilateral stimulus (see Fig. 8). The suppression was dependent on the relationship between the timing of the peaks in the envelope of the 125 Hz and 145 Hz harmonic complexes. To quantify this effect, the data were replotted with respect to the time difference between the peaks of the 125 Hz and 145 Hz envelopes. To reduce the variance caused by this sparse sampling the values were smoothed by a running average (0.5-ms time window). The spike count of each unit was normalized to its maximum spike count. The reduction caused by the ipsilateral stimulus was measured in terms of response modulation of the relative envelope peak interval function. Response modulation was calculated as the difference, in percentage, between the bin with the maximum response and the bin with the minimum response (100 [Max Bin ⫺ Min Bin]/Max Bin). If there were ⬍100 spikes summed over 15 repeats over the 200-ms period, across the trials, then the response modulation was not calculated. RESULTS
The responses to the dichotic harmonic complexes were diverse; however, we identified several patterns of synchronized responses to the stimuli (Fig. 2). Some units responded highly regularly at 8-ms intervals (Fig. 2, A and B), which corresponded to the period of the 125 Hz contralateral f0. Other units responded less regularly, but still with recognizable synchronization to 125 Hz (Fig. 2, C and D). The responses of some units that were locking to the 125 Hz f0 were clearly suppressed at 50-ms intervals (Fig. 2, E and F), which corresponded to the 20-Hz difference frequency between the 125 Hz contralateral f0 and the 145 Hz ipsilateral f0. Other units responded only at these 50-ms intervals (Fig. 2, G and H). The units shown in Fig. 2 were well synchronized to the stimuli,
A 15 C E
Trial #
G
B
10 5 0 15 10 5 0 15 10 5 0 15 10 5 0
D F H 0
100
200 300 Time (ms)
400
500
200
250
300
Fig. 2. Dot rasters of 4 units’ responses to simultaneously presented ipsilateral (60 dB SPL) and contralateral (60 dB SPL) harmonic complexes. Each unit’s response to the 400-ms stimulus is shown over 500 ms in A, C, E, and G and the response between 200 and 300 ms in B, D, F, and H. Long solid line over the dot rasters in A, C, E, and G shows the signal duration; short solid line shows the extent of the expanded dot raster in B, D, F, and H.
and the synchronization could be readily identified by eye. However, identification of units with weaker synchronization required the methods outlined in Data Analysis. Units were classified on the basis of their binaural properties (see Data Analysis), and their temporal patterns were analyzed to highlight different effects of the ipsilateral stimulus. Finally, we relate the binaural classifications to the observed temporal patterns. Binaural Classification of Units The binaural classification of the units was based upon changes in their spike count as the level of the ipsilateral stimulus was varied (Table 1). Of the 96 units recorded, 70 responded robustly throughout the stimulus to binaural stimulation (Table 1). Of the 70 units studied that responded to the dichotic harmonic complexes, 10 were classified as EE (14%), 23 were classified as EI (33%), and 37 were classified as EO (53%). Synchronization to Fundamental Frequencies of Contra- and Ipsilateral Stimuli An example of an EI unit that synchronized mainly to the contralateral stimulus when both ipsilateral and contralateral levels were 60 dB is shown in Fig. 3A: this unit, at these levels, fired time-locked responses at the peaks of the contralateral waveform but did not respond to the peaks of the ipsilateral waveform (Fig. 3G). This example shows strong phase locking to the f0 of the contralateral stimulus (Fig. 3B; vector strength of 0.95) but weak phase locking to the ipsilateral stimulus (Fig. 3C; vector strength of 0.20). In contrast, an example of an EE unit that synchronized to the f0s of both the contralateral and ipsilateral stimuli is shown in Fig. 3D. This unit, at these levels, fired time-locked responses at the peaks of both the contralateral waveform and the ipsilateral waveform (Fig. 3G) as is demonstrated by the clearly peaked period histograms (Fig. 3, E and F) and vector strengths of 0.41 and 0.33. Across all units and stimulus levels there was a great deal of variability in phase locking (Fig. 4). The range in phase locking to the contralateral stimulus covered most possible values (median 0.6, interquartile range 0.3– 0.9, full range 0.02–1.0 across all conditions), whereas the phase locking to the ipsilateral stimulus tended to be weaker but still had a wide range (median 0.1, interquartile range 0.04 – 0.2, full range 0 – 0.9 across all conditions). Phase locking to the f0s of the waveforms at each ear varied systematically with the ipsi- and contralateral stimulus levels. In Fig. 5 the vector strengths for the units of Fig. 3 are shown for all level combinations. The EI unit illustrated in Fig. 3, A–C, is shown in Fig. 5, A and B, and the EE unit of Fig. 3, D–F, in Fig. 5, C and D. As the level of the ipsilateral stimulus was increased, the synchronization to the contralateral stimulus remained constant for the EI unit (Fig. 5A) and decreased for the EE unit (Fig. 5C) whereas the synchronization to the ipsilateral stimulus increased for both units (Fig. 5, B and D). A complementary effect occurred when the level of the contralateral stimulus was varied. As the level of the contralateral stimulus was increased, the synchronization to the contralateral stimulus increased (Fig. 5C) or remained constant (Fig. 5A) whereas the synchronization to the ipsilateral stimulus decreased (Fig. 5, B and D).
J Neurophysiol • doi:10.1152/jn.00472.2014 • www.jn.org
BINAURAL INTEGRATION IN INFERIOR COLLICULUS
10 5 0 15 10 5
B
0.4
Proportion of spikes
Trial #
D
15
0.2
E
0 0.4
Proportion of spikes
Trial #
A
0.2
0
Amplitude (%)
C 0.4
vs= 0.95
0
F 0.4
vs= 0.41
vs= 0.33
0.2 0 0
50
vs= 0.20
0.2
0
G 100
1823
0.2 0.4 0.6 0.8 Fraction of contralateral f0 cycle
1
0
0.2 0.4 0.6 0.8 Fraction of ipsilateral f0 cycle
1
Stimulus Waveform Contralateral Ipsilateral
0 270
280
290 300 Time (ms)
310
320
Fig. 3. A–F: dot rasters (A and D) and period histograms synchronized to the f0 of the contralateral (B and E) and ipsilateral (C and F) waveforms for 2 different units. G: stimulus waveforms at contralateral and ipsilateral ears. Same units as in Fig. 2, A–D, are shown. The stimulus level was 60 dB to both ears. The dot rasters are shifted to align with the stimulus in G. vs, Vector strength.
The effects in these two individual units were echoed across the population. Figure 6 shows the median vector strength (with interquartile ranges) across each of the binaural types in the same format as Fig. 5. There is a great similarity in trends shown for the EI population medians (Fig. 6, A and B) with those of the single-EI unit values shown in Fig. 5, A and B, and for the EE population (Fig. 6, E and F) with the single EE unit shown in Fig. 5, C and D. The EO trends (Fig. 6, C and D) are intermediate between the EI and EE trends. The interquartile ranges are large, which reflects the large variability in phase locking across IC units (Fig. 4); however, most units within each group exhibited the same trends. For EI and EO units phase locking to the contralateral stimulus did not vary with ipsilateral or contralateral level (Fig. 6, A and C; Table 2a). For EE units it appears that phase locking to the contralateral stimulus decreased as a function of ipsilateral level for contralateral levels of 50 dB and 60 dB (Fig. 6E); however, this was only significant at 60 dB (Friedman P ⬍ 0.01; Table 2a, left). Similarly, EE units phase locking to the contralateral
A EI
Suppression of Contralateral Synchronization by Ipsilateral Stimulus While vector strength can describe the response of units that synchronize to the ipsilateral stimulus, it does not capture the ipsilateral suppression of the response to the contralateral stimulus (Fig. 2, E and F). An example of a single unit that synchronized to the f0 of the contralateral stimulus and was suppressed by the ipsilateral stimulus is shown in Fig. 7. This
B EO
Contra 40 dB
Contra 50 dB
Contra 60 dB
Contra 50 dB
Contra 60 dB
0
0.5
1 0
0.5
1 0
0.5
Vector strength to contralateral stimulus
1
Contra 40 dB
Contra 50 dB
Contra 60 dB
1 0.8 0.6 0.4 0.2 0 1 0.8 0.6 0.4 0.2 0 1 0.8 0.6 0.4 0.2 0 0
0.5
1 0
0.5
1 0
0.5
1
Vector strength to contralateral stimulus
Ipsi 40 dB
1 0.8 0.6 0.4 0.2 0 1 0.8 0.6 0.4 0.2 0 1 0.8 0.6 0.4 0.2 0
Ipsi 50 dB
1 0.8 0.6 0.4 0.2 0 1 0.8 0.6 0.4 0.2 0 1 0.8 0.6 0.4 0.2 0
C EE
Contra 40 dB
Ipsi 60 dB
Vector strength to ipsilateral stimulus
stimulus appeared to increase as contralateral level increased (Fig. 6E); however, this was not significant (Table 2a, right). For all unit types phase locking to the ipsilateral stimulus increased as ipsilateral level increased (Fig. 6, B, D, and F; Friedman P ⬍ 0.001, Table 2b, left). A complementary effect whereby phase locking to the ipsilateral stimulus decreased as contralateral level increased is suggested for EE units (Fig. 6F) but was only significant at an ipsilateral level of 60 dB (Friedman P ⬍ 0.01; Table 2b, right).
0
0.5
1 0
0.5
1 0
0.5
1
Vector strength to contralateral stimulus
Fig. 4. Scatterplot of the vector strength of phase locking to the f0 of the contralateral stimulus and to the f0 of the ipsilateral stimulus for the population for EI (A), EO (B), and EE (C) binaural unit types. Contralateral levels are shown at top of plots and are the same within each column. Ipsilateral levels are on right of the plots and are the same within each row. J Neurophysiol • doi:10.1152/jn.00472.2014 • www.jn.org
1824
BINAURAL INTEGRATION IN INFERIOR COLLICULUS
A
0.8
0.8
0.6
0.6
0.4
0.4
0.2
0.2
1.0
B
Contralateral Level 60 dB 50 dB 40 dB
Units That Responded When Waveform Envelope Peaks Were Coincident
0.0 50
60
C
40
1.0
0.8
0.8
0.6
0.6
0.4
0.4
0.2
0.2
0.0
50
60
50
60
D
0.0 40
50
Ipsilateral Level (dB)
60
40
Ipsilateral Level (dB)
Fig. 5. Vector strengths of phase locking to the f0 of the contralateral stimulus (A and C) and the f0 of the ipsilateral stimulus (B and D) for the units shown in Fig. 3. A and B: EI unit shown in Fig. 2, A and B, and Fig. 3, A–C. C and D: EE unit shown in Fig. 2, C and D, and Fig. 3, D–F. Plots are shown as a function of ipsilateral level with contralateral level as the parameter: 60 dB, 50 dB, and 40 dB.
unit fired at regular intervals, ⬃8 ms apart, which corresponds to the peaks of the envelope of the contralateral stimulus (Fig. 7C). There was no excitatory response to the ipsilateral stimulus (Fig. 7C). When the peak of the envelope of the ipsilateral stimulus came slightly (⬍3 ms) before the peak of contralateral stimulus the response was reduced (Fig. 7, A and C); however, the response was not reduced at other times. The modulation of the response to the contralateral stimulus by the ipsilateral stimulus is apparent when the data are replotted with respect to the difference in the timing between the peaks of the contralateral envelope and the ipsilateral envelope (Fig. 7C). This function (see Relative envelope peak interval function) shows the relationship between the spike count and the absolute time difference between the envelope peaks (in ms) of the two harmonic complexes (Fig. 7B). As shown in Fig. 7B, the response to the contralateral stimulus is inhibited when the peaks of the envelope of the ipsilateral stimulus precede it by ⬃1–2 ms. Again, this modulation must occur through binaural neural interactions, since the stimuli are presented to opposite ears. For the unit in Fig. 7 the response modulation was dependent upon the relative stimulus levels between the ears (Fig. 8). When the level of the contralateral stimulus was 40 dB SPL and the ipsilateral stimulus was 60 dB SPL, there was a substantial amount of modulation (Fig. 8A). If the contralateral stimulus level was increased (Fig. 8A) or the ipsilateral stimulus level decreased (Fig. 8, A–C) the degree of modulation was reduced. Across the population the response modulation was also dependent upon the relative stimulus levels between the ears (Fig. 9). This dependence occurred for all unit types, even though the effect of the ipsilateral stimulus on their spike count was different. The significance of the changes was tested with the Friedman test, and significance levels are reported in Table 3. As the ipsilateral stimulus level increased the average response modulation depth significantly increased for EI and EO types (Fig. 10, A and B; Table 3, left), but there was no significant
Five units that responded to a monaural stimulus, but gave very low binaural response (and thus included in the “monaural response, low binaural response” category, Table 1), responded over very restricted binaural conditions. An example of a single unit that responded only every 50 ms is shown in Fig. 11. This unit fired when the envelope peaks in the waveforms at the two ears were approximately coincident (Fig. 11, A and C). The relative envelope peak interval function in Fig. 11B shows the time window over which this facilitatory effect occurred. Two “EI” units also showed this kind of response. DISCUSSION
While units in the IC can have complex responses to dichotic harmonic stimuli, there were several identifiable patterns in the responses. Units in the IC could synchronize to stimuli at either or both ears; synchronization to the contralateral stimulus could be suppressed by the ipsilateral stimulus; or responses Phase-locking to Contralateral stimulus
A EI
Vector Strength
0.0 40
Vector Strength
1.0
change for EE types (Fig. 10C). The average response modulation depth significantly decreased if the contralateral stimulus level was increased for EI and EO types (Fig. 10, A and B; Table 3, right), but there was no significant change for EE types (Fig. 10C).
Phase-locking to Ipsilateral stimulus
B
1.0
1.0
0.8
0.8
0.6
0.6
0.4
0.4
0.2
0.2
0.0 50
60
C EO
40
D
1.0
1.0
0.8
0.8
0.6
0.6
0.4
0.4
0.2
0.2
0.0
Contralateral Level 60 dB 50 dB 40 dB
50
60
50
60
50
60
EO
0.0 40
E
EI
0.0 40
Vector Strength
1.0
Phase-locking to Ipsilateral stimulus
Vector Strength
Vector Strength
Phase-locking to Contralateral stimulus
50
60
40
F
EE
1.0
1.0
0.8
0.8
0.6
0.6
0.4
0.4
0.2
0.2
0.0
EE
0.0 40
50
60
Ipsilateral Level (dB)
40
Ipsilateral Level (dB)
Fig. 6. Median vector strength of phase locking to the contralateral stimulus (A, C, and E) and the ipsilateral stimulus (B, D, and F) for EI units (A and B), EO units (C and D), and EE units (E and F). Plots are shown as a function of ipsilateral level with contralateral level as the parameter. Error bars show the interquartile ranges, and data points for different contralateral levels are offset from their true ipsilateral level for clarity: data points with a contralateral level of 40 dB are offset by ⫺1 dB and those with a contralateral level of 60 dB by ⫹1 dB. No. of units of each type: EO ⫽ 37, EI ⫽ 23, and EE ⫽ 10.
J Neurophysiol • doi:10.1152/jn.00472.2014 • www.jn.org
BINAURAL INTEGRATION IN INFERIOR COLLICULUS
1825
Table 2. Friedman test on phase locking of all units to contralateral and ipsilateral stimuli Classification
Contralateral Level, dB
P Value
Holm-Bonferroni FWER
n
Ipsilateral Level, dB
Holm-Bonferroni FWER
P Value
n
60 50 40 60 50 40 60 50 40
0.0099 0.3 0.26 0.52 0.49 1 0.5 0.12 0.12
21 21 21 20 18 18 10 10 10
†
60 50 40 60 50 40 60 50 40
0.0074 0.023 0.26 0.041 0.11 0.03 0.00068 0.014 0.0082
21 21 21 20 18 18 10 10 10
†
a. Phase locking to contralateral stimulus EI
60 50 40 60 50 40 60 50 40
EO EE
0.73 0.88 0.73 0.11 0.084 0.54 0.00068 0.014 0.5
22 23 22 30 27 21 10 10 10
‡
b. Phase locking to ipsilateral stimulus EI
60 50 40 60 50 40 60 50 40
EO EE
2.4 4.5 1.9 2.8 3.8 1.3 1.1 3.7 3.0
⫻ ⫻ ⫻ ⫻ ⫻ ⫻ ⫻ ⫻ ⫻
⫺04
10 10⫺07 10⫺04 10⫺07 10⫺06 10⫺05 10⫺04 10⫺04 10⫺04
22 23 22 30 27 21 10 10 10
§ § § § § § § § §
‡ † †
Left: vector strengths were ranked across ipsilateral level (i.e., along the lines joining points in Fig. 6) and separate tests run for each contralateral level and binaural type. Right: vector strengths were ranked across contralateral level. A Holm-Bonferroni correction was applied separately to each group of 9 tests to determine significance. n, No. of units included in each test. Holm-Bonferroni familywise error rate (FWER): †P ⬍ 0.1, ‡P ⬍ 0.01, §P ⬍ 0.001.
could only occur when inputs from the two ears were coincident. Many of the units (EO: 53%, 37/70) were excited by the contralateral ear but unaffected by changes in the level of the signal at the ipsilateral ear; this finding is consistent with those of Shackleton et al. (2009), who found that contralateral dominance increased with CF and that for units with CFs ⬎ 2 kHz the ipsilateral signal had little effect. We identified two classes of units that were excited by both ears. In one (Figs. 3– 6), the response appeared to be a summation of the input to both ears. In the other (Fig. 11), it was necessary for the input from each ear to be coincident in time
for the unit to respond. The former can be described as “additive” and the latter as “multiplicative.” The additive units can largely be identified with the EE units defined by rate criteria, since they phase lock to both ears, but the degree of phase locking depends upon relative signal level (Fig. 6, E and F). While it has long been known that IC units can be driven by stimuli at either ear (EE units in the terminology of Irvine 1986), their function has often been attributed to spatial localization, and certainly at low frequencies these are the units that are sensitive to interaural time delays (ITDs) (see for example McAlpine et al. 1996, 2001). We did not measure envelope ITD sensitivity, so we cannot say whether the additive units
A 30
B Normalized Spike Count
Trial #
100 20 10 0
Amplitude (%)
C100
80 60 40 20 0 −3
−2
50
−1 0 1 Relative envelope peak time (ms)
2
3
Stimulus Waveform 0
Contralateral Ipsilateral 200
220
240 260 Time (ms)
280
300
Fig. 7. A: dot raster of a 100-ms portion of a unit’s [characteristic frequency (CF) ⬃9 kHz] response to simultaneously presented ipsilateral (60 dB SPL) and contralateral (40 dB SPL) harmonic complexes. The response is shifted to align with the stimulus in C. B: the response to the stimulus is replotted by the time difference between the peaks of the envelopes of the contralateral 125 Hz stimulus and the ipsilateral 145 Hz stimulus, creating a relative envelope peak interval function (described in MATERIALS AND METHODS). C: stimulus waveforms at contralateral and ipsilateral ears. Short lines show when the peaks in the ipsilateral stimulus lead those in the contralateral stimulus by ⬃1–2 ms. J Neurophysiol • doi:10.1152/jn.00472.2014 • www.jn.org
BINAURAL INTEGRATION IN INFERIOR COLLICULUS
C
Normalized Spike Count
B
Normalized Spike Count
A
Normalized Spike Count
1826 100
75
50
25 Ipsilateral level 60 dB 0 100
75
50
25 Ipsilateral level 50 dB 0 100
75
50 Contralateral level 25
40 dB 50 dB 60 dB
Ipsilateral level 40dB 0 -3
-2
-1
0
1
2
3
Relative envelope peak interval (ms) Fig. 8. Relative envelope peak interval functions for the unit in Fig. 7 for all stimulus levels. In each panel the ipsilateral stimulus level was constant (shown at bottom of plots) and the contralateral level changed from 40 to 50 and 60 dB SPL. A: ipsilateral level 60 dB. B: ipsilateral level 50 dB. C: ipsilateral level 40 dB.
were ITD sensitive, but it is highly likely that the multiplicative units were. The multiplicative units were the only ones that clearly signaled the difference frequency (20 Hz) between the signals at the two ears. EI Contra 40 dB
Contra 50 dB
Contra 60 dB
B
EO Contra 40 dB
Contra 50 dB
Contra 60 dB
C
15 10 5 0 15 10 5 0 0 20 40 60 80100 0 20 40 60 80100 0 20 40 60 80100
Modulation of the Envelope Peak Interval Function (%)
Contra 50 dB
Contra 60 dB
5 4 3 2 1 0 5 4 3 2 1 0 5 4 3 2 1 0
10 8 6 4 2 0 10 8 6 4 2 0 10 8 6 4 2 0
15 10 5 0
EE Contra 40 dB
0 20 40 60 80100 0 20 40 60 80100 0 20 40 60 80100
Modulation of the Envelope Peak Interval Function (%)
Ipsi 60 dB Ipsi 50 dB Ipsi 40 dB
Number of Units
A
We found a class of units that were excited by the contralateral ear and suppressed by the ipsilateral in a phasic manner (Figs. 7–10). We cannot from the data here unequivocally ascribe this effect to inhibition, and we use the more neutral term “suppression.” Indeed, it is likely that a large number of suppressed responses are due to refractory intervals in units locking to the stimuli at both ears. EE units phase locked to the ipsilateral stimulus across several conditions (Fig. 6F), so this is likely to be the case for them. However, even when EI units phase locked their phase locking to the ipsilateral stimulus tended to be very low (Fig. 6B), so this suppression is more likely to be inhibition. We can define a class of “subtractive” units that can largely be identified with the EI units, since these locked well to the contralateral stimulus but poorly to the ipsilateral (Fig. 6, A and B) and were suppressed in a phasic manner (Fig. 10). It is possible that suppression in the IC in EI units could result from tonic or phasic processes; however, metrics based purely upon spike counts cannot distinguish between them. Indeed, Batra et al. (1993) found, using high-frequency sinusoidally amplitude-modulated (SAM) tones, many units that were suppressed by a narrow range (as low as 500 s) of envelope ITDs. However, since they reported only spike counts it is not clear whether the suppression was constant throughout the response or was locked to any phase of the envelope. In contrast, here we clearly show a suppression that is locked to a phase of the envelopes (phasic), with a temporal extent of ⬃1–3 ms. It is worth noting that this “phasic” suppression repeats throughout the duration of the stimulus, i.e., it occurs every time that a precise phase of the envelope occurs. As demonstrated in Figs. 7 and 8, responses to envelope peaks of the contralateral stimuli that occurred slightly after the ipsilateral stimulus were suppressed. The reduction of the contralateral response generally occurred at interaural time differences between the envelope peaks (Fig. 7) that favored ipsilateral space (similar to the results from Batra et al. 1993), and the response modulation was greater when the interaural level differences (ILDs) favored ipsilateral space (Figs. 8 –10). In this report we concentrate on sustained responses; however, the complex nature of the stimulus evokes a higher percentage of sustained responses compared with studies using less complex stimuli. The classic definition of IC cell responses
0 20 40 60 80100 0 20 40 60 80100 0 20 40 60 80100
Modulation of the Envelope Peak Interval Function (%)
Fig. 9. Histograms of the modulation of the envelope peak interval function for all units for EI (A), EO (B), and EE (C) binaural unit types. Contralateral levels are shown at top of plots and are the same within each column. Ipsilateral levels are shown at right of plots and are the same within each row. Each panel is scaled so the y-axis corresponds to half the total number of units of that type (EO ⫽ 37, EI ⫽ 23, and EE ⫽ 10). J Neurophysiol • doi:10.1152/jn.00472.2014 • www.jn.org
BINAURAL INTEGRATION IN INFERIOR COLLICULUS
1827
Table 3. Friedman test on modulation depth of relative envelope peak interval function Classification EI EO EE
Contralateral Level, dB
P Value
n
60 50 40 60 50 40 60 50 40
0.00014 0.0000016 0.00011 0.000018 0.00024 0.0027 0.061 0.045 0.61
22 23 20 25 21 15 10 9 6
Holm-Bonferroni FWER
Ipsilateral Level, dB
P Value
n
§ § § § ‡ *
60 50 40 60 50 40 60 50 40
0.00066 0.00051 0.0075 0.0016 0.0031 0.046 0.045 0.072 0.03
19 19 19 13 14 14 9 8 6
Holm-Bonferroni FWER ‡ ‡ * * *
Left: response modulation depth was ranked across ipsilateral level (i.e., along the lines joining points in Fig. 10) and separate tests run for each contralateral level and binaural type. Right: response modulation depth was ranked across contralateral level. A Holm-Bonferroni correction was applied separately to each group of 9 tests to determine significance. n, No. of units included in each test. Holm-Bonferroni FWER: *P ⬍ 0.05, P ⬍ ‡0.01, P ⬍ §0.001.
(transient, pauser, etc.; Irvine 1986; Nuding et al. 1999) cannot be directly related to the response to complex stimuli, such as mistuned harmonic complexes (Sinex et al. 2002) or double harmonic complexes (Sinex and Li 2007). Many of the IC cells that do not have a sustained response to pure tones, noise, or even a single harmonic complex have a sustained response to mistuned or double harmonic complexes (Sinex et al. 2002; Sinex and Li 2007). Comparison with Previous Physiological Studies on Harmonic Complexes A previous study examined the representation of monaural double harmonic complexes when only a few components occurred in the tuning curve of the cell (Sinex and Li 2007). In this report we examined the representation of dichotic double harmonic complexes when many harmonic components occur in the tuning curve of the cell. These two studies can be thought of as complementary, since they are examining the response of different populations of cells and different mechanisms in response to a double harmonic complex. In Sinex and Li’s (2007) study the response of the IC cells to the monaural double harmonic complexes could be explained by the interaction of a few components that occurred within the tuning curve of the cell. This report demonstrates that there are binaural interactions of the envelopes of harmonic complexes presented to the opposite ear. Monaural and Binaural Processing of Harmonic Complexes
Resp. Modulation Depth
By comparison with previously published data, the present report demonstrates a significant difference between the processing, within an auditory filter, of monaural and binaural
A
B
EI
signals that consist of multiple harmonic stimuli. When two harmonic complexes, with different f0s, were presented to a single ear, the envelope of both harmonic complexes was well represented in the response pattern of the majority cells in the contralateral IC (Nakamoto et al. 2010; Sinex and Li 2007). However, when the harmonic complexes were presented to opposing ears, many of the cells in the IC responded only to the stimulus in the contralateral ear and in some cells this response was reduced by the stimulus in the ipsilateral ear. Put more succinctly, the contrast between monaural and binaural presentation of multiple harmonic complexes is a contrast between the two envelopes represented in a single IC and the generation of additional representations of each envelope represented separately in one of the two ICs. We have shown that there are clearly different response types in the IC, which may represent different “streams” of information. What can be said about the functional implications of these different response types? The most important fact is that the responses are all phase locked in some degree to the stimulus. Although there is modification in the response, they cannot be said to have encoded a feature of the stimulus like its pitch. Many of the units are dominated by the response to the stimulus in the contralateral ear insofar as they phase lock strongly to the contralateral stimulus but poorly to the ipsilateral (Fig. 6, A–D). These appear mainly to be those identified as EI and EO units by rate criteria. These units appear to be operating only as relays for monaural information. Additive, EE, units (Figs. 3– 6) integrate the envelopes at each ear as if they were arising from a single source. The integration of envelopes is illustrated in Fig. 12. Figure 12, top,
C
EO
EE
Contralateral Level
100
60 dB 50 dB 40 dB
80 60 40 20 0 40
50
60
Ipsilateral Level (dB)
40
50
60
Ipsilateral Level (dB)
40
50
60
Ipsilateral Level (dB)
Fig. 10. Median depth of modulation of the envelope peak interval function for EI (A), EO (B), and EE (C) binaural unit types. Error bars show the interquartile ranges. Plots are shown as a function of ipsilateral level with contralateral level and binaural unit type as the parameters. Data points for different contralateral levels are offset from their true ipsilateral level for clarity: data points with a contralateral level of 40 dB are offset by ⫺1 dB and those with a contralateral level of 60 dB by ⫹1 dB. Number of units of each type: EO ⫽ 37, EI ⫽ 23, and EE ⫽ 10. J Neurophysiol • doi:10.1152/jn.00472.2014 • www.jn.org
1828
BINAURAL INTEGRATION IN INFERIOR COLLICULUS
A 15
B Normalized Spike Count
Trial #
100 10 5 0
Amplitude (%)
C100
80 60 40 20 0 −3
−2
50
−1 0 1 Relative envelope peak time (ms)
2
3
Stimulus Waveform 0
Contralateral Ipsilateral 200
220
240 260 Time (ms)
280
300
Fig. 11. A: dot raster of a 100-ms portion of a unit’s (CF ⬃6.4 kHz) response to simultaneously presented ipsilateral (50 dB SPL) and contralateral (60 dB SPL) harmonic complexes. B: the response to the stimulus is replotted by the time difference between the peaks of the envelopes of the contralateral 125 Hz stimulus and ipsilateral 145 Hz stimulus, creating a relative envelope peak interval function (described in MATERIALS AND METHODS). C: stimulus waveforms at contralateral and ipsilateral ears. Short lines show when the peaks in the ipsilateral stimulus lead those in the contralateral stimulus by ⬃1 ms.
shows the waveform envelopes that were presented to each ear separately, plotted together over 50 ms. In an environment with multiple complex sounds the “additive” units (Fig. 12, middle) synchronize to the envelopes at both ears, with the degree of synchronization to the stimulus at each ear dependent on the
Waveform Envelopes
Contra Waveform Ipsi Waveform
Waveforms synchronized to by Additive units in each IC Contralateral IC
Ipsilateral IC
Waveforms synchronized to by Subtractive units in each IC Contralateral IC
Ipsilateral IC
Fig. 12. Illustration of the proposed function of binaural IC units using stimulus waveform envelopes. Top: the envelope of a harmonic complex presented to the ipsilateral ear and a harmonic complex presented to the contralateral ear. Middle: additive responses in each IC. Bottom: subtractive responses in each IC. Units in the IC synchronize to the stimulus at the contralateral ear and have reduced responses to components that have phases favoring the opposite hemifield (arrows).
level at each ear (Fig. 3– 6) and favoring the higher-level stimulus. These units are therefore forming a binaurally fused representation of the stimulus. “Subtractive”, EI, units synchronized to the contralateral stimulus and were suppressed by the ipsilateral stimulus in a phasic manner (Figs. 7–10). As demonstrated in Figs. 7 and 8, responses to envelope peaks of the contralateral stimuli that occurred slightly after the ipsilateral stimulus were suppressed. In a natural environment different stimuli with complex spectra likely arise from different spatial positions, and the highfrequency parts of the signal arriving at each ear would be dominated by the sound source closest to that ear because propagation through the air leads to greater attenuation of higher than lower frequencies (p. 224, Kinsler et al. 2000; Stokes 1845). For sources near the head, the closer and farther sources could also be distinguished by means of ILDs due to head shadowing (Brungart and Rabinowitz 1999). Units in both ICs would synchronize to their respective contralateral stimulus (Fig. 12), and, across the population, responses to peaks of the stimuli that had phases and ILDs that favored ipsilateral space would be reduced, in essence achieving a partial segregation of the sounds or perhaps improving the signal-to-noise ratio for the contralateral stimulus. Two aspects of the IC responses to binaurally presented harmonic complexes appear relevant to psychophysical findings: the differential representation across the ICs and the modulation of the responses by ipsilateral input. There is a significant improvement in speech comprehension when distracters are in the opposite hemifield as opposed to the same hemifield (Hawley et al. 1999). Although an opposite hemifield configuration would provide more localization information because of the position of the ears (e.g., Reijniers et al. 2014), this advantage may be enhanced by the ascending auditory system: presentation in opposing hemifields would lead to preferential processing in the contralateral ICs. We would predict that there is a substantial, qualitative, difference between processing of stimuli at midline (where the signal would be equally represented in both ICs) and stimuli presented away from midline (where the signal would be represented primarily
J Neurophysiol • doi:10.1152/jn.00472.2014 • www.jn.org
BINAURAL INTEGRATION IN INFERIOR COLLICULUS
in one IC). In a binaural presentation each envelope is primarily represented in a separate IC. However, because of the ipsilateral modulation, they are not independent of each other, i.e., sounds presented to opposing ears are not independently processed. There are many situations in which humans cannot listen solely to one ear; sounds presented to the opposing ear can interfere with perception (pitch discrimination interference: Gockel et al. 2009; contra-aural interference: Shub et al. 2008). In addition, the ability to compare the signals between the ears can increase discrimination (Hirsh 1948; MacKeith and Coles 1971). Potentially, the ipsilateral modulation of contralateral responses could be related to the interference noted in psychophysical studies.
1829
stimulus in the contralateral ear. Another group synchronized to the contralateral stimulus and were suppressed by the ipsilateral stimulus in a phasic manner. These might act to emphasize a sound in the contralateral hemifield by subtracting the “cross talk” from the ipsilateral hemifield, although it is not clear how this would work in practice. A third group synchronized to the stimuli at both ears and would thus appear to form an ILD-weighted integration of information from both ears. A final group only responded when the waveform peaks from each ear coincided and are thus likely to carry information about the envelope interaural time difference, a cue for sound localization. It is unlikely that this group is carrying information about the periodicity of the stimulus, but it may carry information about its location.
Representation of Pitch of Dichotic Stimuli in IC Psychophysical studies have demonstrated that the percept of the pitch of a harmonic complex is independent of the distribution of individual resolved harmonics between the ears (Beerends and Houtsma 1986; Culling and Summerfield 1995; Darwin and Hukin 1999; Woods and Colburn 1992). This indicates that there exists a binaural neural site at which the components between the two ears are analyzed together. Previous studies have suggested that this may not occur at the level of the IC (Shackleton et al. 2009). However, this was not a very strong conclusion. Shackleton et al. (2009) alternated the components of a harmonic complex between the ears. It was argued that integration across the ears would result in a representation of the f0 of the entire stimulus in the IC response. On the other hand, nonintegration would result in a representation with 2f0, corresponding to the envelope or the spacing between harmonics at an individual ear. Units in the IC responded predominantly at 2f0. However, most of the units were of high CF, so many harmonics interacted within their response areas. This also means that many harmonics interacted within the response areas of the auditory nerve fibers that, through a chain of connections, supply input to these IC units. Consequently, the response of the auditory nerve fibers would also have an envelope corresponding to 2f0. In order for the IC units to produce a response at f0, it would require alternate waveform peaks of the auditory nerve fibers’ responses to cancel and reinforce (as they would in the acoustic signal). Thus IC units that either synchronize to the stimuli at both ears or are inhibited by an ipsilateral stimulus would respond at 2f0, and could not produce a response at f0. However, the psychophysical results of Bernstein and Oxenham (2003) suggest that in the region of CFs and f0s used in the Shackleton et al. (2009) study, integration between the ears is not necessary. Thus Shackleton et al. (2009) do not adequately address the issue of integration between the ears. The present study clearly shows that this integration is present within the IC in units similar to the high-CF units studied in the Shackleton et al. (2009) study. Summary We have shown that high-CF (⬎2 kHz) units in the IC phase lock to the temporal envelope of a binaural harmonic stimulus with varying degrees of binaural interaction. These units emphasize different features of the stimulus and so could be described as representing different streams of information. Many of the units are dominated by the response to the
ACKNOWLEDGMENTS We thank C. Sumner for designing and helping with the MATLAB interface, O. Zobay for extensive help with the nonparametric statistics, and the reviewers and editor for their very helpful comments.
GRANTS K. T. Nakamoto (partially), T. M. Shackleton, A. R. Palmer, and laboratory facilities were supported by Medical Research Council (UK) intramural funding. K. T. Nakamoto was also partially supported by the National Institute on Deafness and Other Communication Disorders under Award Number R03 DC-012871. The content is solely the responsibility of the authors and does not necessarily represent the official views of the National Institutes of Health.
DISCLOSURES No conflicts of interest, financial or otherwise, are declared by the author(s).
AUTHOR CONTRIBUTIONS Author contributions: K.T.N., T.M.S., and A.R.P. conception and design of research; K.T.N. performed experiments; K.T.N., T.M.S., and A.R.P. analyzed data; K.T.N., T.M.S., D.A.M., and A.R.P. interpreted results of experiments; K.T.N., T.M.S., and A.R.P. prepared figures; K.T.N., T.M.S., and A.R.P. drafted manuscript; K.T.N., T.M.S., D.A.M., and A.R.P. edited and revised manuscript; K.T.N., T.M.S., D.A.M., and A.R.P. approved final version of manuscript.
REFERENCES Anderson LA, Malmierca MS, Wallace MN, Palmer AR. Evidence for a direct, short latency projection from the dorsal cochlear nucleus to the auditory thalamus in the guinea pig. Eur J Neurosci 24: 491– 498, 2006. Ashida G, Wagner H, Carr CE. Processing of phase-locked spikes and periodic signals. In: Analysis of Parallel Spike Trains, edited by Grün S, Rotter S. New York: Springer, 2010, p. 59 –74. Batra R, Kuwada S, Stanford T. High-frequency neurons in the inferior colliculus that are sensitive to interaural delays of amplitude-modulated tones: evidence for dual binaural influences. J Neurophysiol 70: 64 – 80, 1993. Beerends JG, Houtsma AJ. Pitch identification of simultaneous dichotic two-tone complexes. J Acoust Soc Am 80: 1048 –1056, 1986. Bernstein JG, Oxenham AJ. Pitch discrimination of diotic and dichotic tone complexes: harmonic resolvability or harmonic number? J Acoust Soc Am 113: 3323–3334, 2003. Bernstein JG, Oxenham AJ. Harmonic segregation through mistuning can improve fundamental frequency discrimination. J Acoust Soc Am 124: 1653–1667, 2008. Berryman JC. Guinea pig vocalizations, their structure, causation and function. Z Tierpsychol 41: 80 –106, 1976. Brungart DS, Rabinowitz WM. Auditory localization of nearby sources. Head-related transfer functions. J Acoust Soc Am 106: 1465–1479, 1999.
J Neurophysiol • doi:10.1152/jn.00472.2014 • www.jn.org
1830
BINAURAL INTEGRATION IN INFERIOR COLLICULUS
Bullock DC, Palmer AR, Rees A. Compact and easy-to-use tungsten-in-glass microelectrode manufacturing workstation. Med Biol Eng Comput 26: 669 – 672, 1988. Chen GD, Sinex DG. Effects of interaural time differences on the responses of chinchilla inferior colliculus neurons to consonant-vowel syllables. Hear Res 138: 29 – 44, 1999. Culling JF, Marshall DH, Summerfield AQ. Dichotic pitches as illusions of binaural unmasking. II. The Fourcin pitch and the dichotic repetition pitch. J Acoust Soc Am 103: 3527–3539, 1998a. Culling JF, Summerfield Q. Perceptual separation of concurrent speech sounds: absence of across-frequency grouping by common interaural delay. J Acoust Soc Am 98: 785–797, 1995. Culling JF, Summerfield AQ, Marshall DH. Dichotic pitches as illusions of binaural unmasking. I. Huggins’ pitch and the “binaural edge pitch.” J Acoust Soc Am 103: 3509 –3526, 1998b. Darwin CJ, Hukin RW. Auditory objects of attention: the role of interaural time differences. J Exp Psychol Hum Percept Perform 25: 617– 629, 1999. Dirks DD, Wilson RH. The effect of spatially separated sound sources on speech intelligibility. J Speech Hear Res 12: 5–38, 1969. Glasberg BR, Moore BC. Derivation of auditory filter shapes from notchednoise data. Hear Res 47: 103–138, 1990. Gockel HE, Hafter ER, Moore BC. Pitch discrimination interference: the role of ear of entry and of octave similarity. J Acoust Soc Am 125: 324 –327, 2009. Goldberg JM, Brown PB. Response of binaural neurons of dog superior olivary complex to dichotic tonal stimuli: some physiological mechanisms of sound localization. J Neurophysiol 32: 613– 636, 1969. Grimsley JM, Shahbag S, Palmer AR, Wallace MN. Processing of communication calls in guinea pig auditory cortex. PLoS One 7: e51646, 2012. Hawley ML, Litovsky RY, Colburn HS. Speech intelligibility and localization in a multi-source environment. J Acoust Soc Am 105: 3436 –3448, 1999. Hirsh IJ. Binaural summation and interaural inhibition as a function of the level of masking noise. Am J Psychol 61: 205–213, 1948. Houtsma HJ, Goldstein JL. The central origin of the pitch of complex tones: evidence from musical interval recognition. J Acoust Soc Am 44: 807– 812, 1972. Irvine DR. The Auditory Brainstem. Berlin: Springer, 1986. Irvine DR, Gago G. Binaural interaction in high-frequency neurons in inferior colliculus of the cat: effects of variations in sound pressure level on sensitivity to interaural intensity differences. J Neurophysiol 63: 570 –591, 1990. Kinsler LE, Frey AR, Coppens AB, Sanders JV. Fundamentals of Acoustics. New York: Wiley, 2000. Lim HH, Anderson DJ. Antidromic activation reveals tonotopically organized projections from primary auditory cortex to the central nucleus of the inferior colliculus in guinea pig. J Neurophysiol 97: 1413–1427, 2007. MacKeith NW, Coles RR. Binaural advantages in hearing of speech. J Laryngol Otol 85: 213–232, 1971. Mardia KV, Jupp PE. Directional Statistics. Chichester, UK: Wiley, 2000. McAlpine D, Jiang D, Palmer AR. Monaural and binaural responses of low best-frequency neurones in the inferior colliculus of the guinea pig. Hear Res 97: 136 –152, 1996.
McAlpine D, Jiang D, Palmer AR. A neural code for low-frequency sound localisation in mammals. Nat Neurosci 4: 396 – 401, 2001. Moore BC, Carlyon RP. Perception of pitch by people with cochlear hearing loss and by cochlear implant users. In: Pitch: Neural Coding and Perception, edited by Plack C, Oxenham AJ, Fay RR, Popper AN. New York: Springer, 2005, p. 234 –277. Nakamoto KT, Shackleton TM, Palmer AR. Responses in the inferior colliculus of the guinea pig to concurrent harmonic series and the effect of inactivation of descending controls. J Neurophysiol 103: 2050 –2061, 2010. Nuding SC, Chen GD, Sinex DG. Monaural response properties of single neurons in the chinchilla inferior colliculus. Hear Res 131: 89 –106, 1999. Peissig J, Kollmeier B. Directivity of binaural noise reduction in spatial multiple noise-source arrangements for normal and impaired listeners. J Acoust Soc Am 101: 1660 –1670, 1997. Plack CJ, Oxenham AJ, Fay RR, Popper AN. Pitch: Neural Coding and Perception. New York: Springer, 2005. Reijniers J, Vanderelst D, Jin C, Carlile S, Peremans H. An ideal-observer model of human sound localization. Biol Cybern 108: 169 –181, 2014. Schofield BR, Mellott JG, Motts SD. Subcollicular projections to the auditory thalamus and collateral projections to the inferior colliculus. Front Neuroanat 8: 70, 2014. Schreiner CE, Langner G. Periodicity coding in the inferior colliculus of the cat. II. Topographical organization. J Neurophysiol 60: 1823–1840, 1988. Semple MN, Aitkin LM. Representation of sound frequency and laterality by units in central nucleus of cat inferior colliculus. J Neurophysiol 42: 1626 –1639, 1979. Shackleton TM, Carlyon RP. The role of resolved and unresolved harmonics in pitch perception and frequency modulation discrimination. J Acoust Soc Am 95: 3529 –3540, 1994. Shackleton TM, Liu LF, Palmer AR. Responses to diotic, dichotic, and alternating phase harmonic stimuli in the inferior colliculus of guinea pigs. J Assoc Res Otolaryngol 10: 76 –90, 2009. Shub DE, Durlach NI, Colburn HS. Monaural level discrimination under dichotic conditions. J Acoust Soc Am 123: 4421– 4433, 2008. Sinex DG, Li H. Responses of inferior colliculus neurons to double harmonic tones. J Neurophysiol 98: 3171–3184, 2007. Sinex DG, Sabes JH, Li H. Responses of inferior colliculus neurons to harmonic and mistuned complex tones. Hear Res 168: 150 –162, 2002. Stokes GG. On the theories of the internal friction in fluids in motion, and of the equilibrium and motion of elastic solids. Trans Camb Philos Soc 8: 287–342, 1845. Von Helmholtz H. On the Sensation of Tone as a Physiological Basis of the Theory of Music. (1863) New York: Dover, 1954. Wang X, Bendor D. Pitch. In: The Oxford Handbook of Auditory Science: The Auditory Brain, edited by Rees A, Palmer AR. Oxford, UK: Oxford Univ. Press, 2010, p. 149 –192. Woods WS, Colburn HS. Test of a model of auditory object formation using intensity and interaural time difference discrimination. J Acoust Soc Am 91: 2894 –2902, 1992.
J Neurophysiol • doi:10.1152/jn.00472.2014 • www.jn.org