Hindawi Security and Communication Networks Volume 2017, Article ID 6216078, 15 pages https://doi.org/10.1155/2017/6216078
Research Article A Fusion of Multiagent Functionalities for Effective Intrusion Detection System Dhanalakshmi Krishnan Sadhasivan1 and Kannapiran Balasubramanian2 1
Department of ECE, Kalasalingam University, Krishnankoil, Tamil Nadu 626126, India Department of Instrumentation & Control Engineering, Kalasalingam University, Krishnankoil, Tamil Nadu, India
2
Correspondence should be addressed to Dhanalakshmi Krishnan Sadhasivan;
[email protected] Received 30 June 2016; Revised 17 September 2016; Accepted 10 October 2016; Published 11 January 2017 Academic Editor: Zheng Yan Copyright © 2017 D. Krishnan Sadhasivan and K. Balasubramanian. This is an open access article distributed under the Creative Commons Attribution License, which permits unrestricted use, distribution, and reproduction in any medium, provided the original work is properly cited. Provision of high security is one of the active research areas in the network applications. The failure in the centralized system based on the attacks provides less protection. Besides, the lack of update of new attacks arrival leads to the minimum accuracy of detection. The major focus of this paper is to improve the detection performance through the adaptive update of attacking information to the database. We propose an Adaptive Rule-Based Multiagent Intrusion Detection System (ARMA-IDS) to detect the anomalies in the real-time datasets such as KDD and SCADA. Besides, the feedback loop provides the necessary update of attacks in the database that leads to the improvement in the detection accuracy. The combination of the rules and responsibilities for multiagents effectively detects the anomaly behavior, misuse of response, or relay reports of gas/water pipeline data in KDD and SCADA, respectively. The comparative analysis of the proposed ARMA-IDS with the various existing path mining methods, namely, random forest, JRip, a combination of AdaBoost/JRip, and common path mining on the SCADA dataset conveys that the effectiveness of the proposed ARMA-IDS in the real-time fault monitoring. Moreover, the proposed ARMA-IDS offers the higher detection rate in the SCADA and KDD cup 1999 datasets.
1. Introduction Nowadays, security reports show that the increase of realtime applications such as government and commercial network systems leads to an increase of the new type of attacks sequentially. The prediction of malicious or anomaly behavior is called intrusion detection. In general, the intrusion detection depends on the availability and confidentiality of information resources, and it is crucial due to high dimensionality and dynamic nature of distributed systems. The systems that detect the intrusions effectively are known as Intrusion Detection Systems (IDS). Research area categorizes the IDS approaches into two, namely, multiagent based and data mining based. Multiagent-based IDS can resist the attacks themselves and improve the detection accuracy, speed, and security. But the rise in the network complexities requires the data mining approaches. The extraction of useful information from large datasets refers to data mining. Data
mining approaches deal with the protection of system against new and complex attacks. The data mining techniques that are employed in IDS are outlier prediction, classification, and clustering. Among these, the employment of different clustering algorithms, namely, partition-based, fuzzy clustering (FCM, 𝐾-means) in anomaly based IDS, discovers the groupings and populations in the datasets. Classification governs the identification of instance label categories, which define the features present in the dataset. Several classifiers such as fuzzy logic, Hidden Markov Model (HMM), and Bayesian analysis are used in data mining applications to detect the intrusions. Even though the data mining approaches achieved an effective detection of intrusions, the high complexity and their energy consumption are more. High detection rate is the major constraint of the design of an efficient IDS. The nonadaptive nature of parameter adjustment in game theoretic-based IDS limits the detection rate.
2
Security and Communication Networks
The process of the identification of understandable patterns with high rate refers to Knowledge Discovery and Data (KDD). The reckoning of KDD models subjects to the efficiency limitations. Nowadays, most of the researchers utilize the Supervisory Control and Data Acquisition (SCADA) which is an alternate to the KDD models. The assurance of effective isolation between the normal and abnormal is the major requirement for intrusion detection in SCADA. The design of suitable detection algorithm considers the following issues: (i) the definition of criterion for an algorithm selection; (ii) choosing the algorithm with the minimum selection criteria; (iii) comparing the merits/demerits of selected and existing algorithms. The presence of correlations between the parameters in dataset 1 (water and gas) and the sequential nature of dataset 2 (electric power transmission) leads to the unsuitability of IDS and machine learning algorithms, respectively. A quantitative measure to validate the effectiveness of extracted patterns refers to interestingness. Clustering and rule-based algorithms are effective to handle the multiagent-based systems. The lack of sequential update of the attack information on the dataset in traditional models leads to less detection accuracy. This paper focuses on the improvement of detection accuracy by using the multiagent framework. This paper proposes the new Adaptive Rule-Based Multiagent IDS (ARMA-IDS) for a secure data transfer in a network. The proposed ARMAIDS integrates the density-based clustering with the rule formation for multiagents (Sniffer, Filter, Rule Mining Agent (RMA), Anomaly Detection Agent (ADA), and Rule-Based Agent (RBA)) under certain policies to define or isolate the anomaly and misuse. Density-based clustering uses the combination of distance measurement and Fuzzy 𝐶-Means (FCM) for detection of unknown intrusions. Rules in RBA review the connections between the networks and categorize them as either the normal or the anomalous behavior in the network. The lack of database update reduces the detection rate of intrusions for practical large size datasets. Hence, this paper proposes the ARMA-IDS to improve the detection performance with an adaptive update of attack information to the dataset. The ARMA-IDS validates the performance of two datasets KDD cup’99 and SCADA to show better detection rate. The organization of the paper is as follows: Section 2 reviews some of the existing works related to Intrusion Detection Systems (IDSs) in data mining in WSNs. Section 3 gives the detailed description of the proposed Multiagent-based Intrusion Detection System in WSNs. Section 4 presents the performance results of both the existing and proposed techniques. Finally, Section 5 states the conclusion, and the future work to be carried out.
2. Related Works The rise of extensive applications performed in real-time opened the platform to new attacks. The introduction of
cyber security threads on smart grid degraded the overall network performance. Zhang et al. [1] proposed an Analyzing Module (AM) for the detection of intrusions in the distributed environment. They utilized the Support Vector Machine (SVM) for outlier detection. The problems addressed in Network IDS (NIDS) were the correlation of attacks, hiding of attack information, and nondetection of new arrival attacks. The evolution of Computer Intelligence (CI) techniques made the IDS better. Shamshirband et al. [2] discussed the traditional multiagent-based IDS with the help of CI techniques. They also analyzed the significance, limitations of various IDS, and prevention mechanisms. Lui et al. [3] enhanced the strength of NIDS against the new attacks by using the agents model. The data mining algorithms extracted the useful patterns from the large size dataset and reduced the complexities of manual computation of intrusion. Chauhan et al. [4] reported the various data mining algorithms for detection of intrusions present in the distributed environment. The limitations of distributed environment such as high false positives and low efficiency lead to low detection rates. Davis and Clark [5] proposed a data preprocessing technique for anomaly based network intrusion detection. Time-based statistics were derived to predict network scans, warm behavior, and Denial of Service (DoS) attacks. The variance and bias are high in the traditional NIDS due to the availability of large dataset. Joshi and Pimprale [6] simultaneously used binary classifier and multiboosting to reduce the variance and bias. The binary classifier utilization in feature selection increased the efficiency against the new attack arrival. Ferreira et al. [7] designed a wavelet and artificial neural networks based IDS for Knowledge Discovery and Data (KDD) dataset. Nadiammai and Hemalatha [8] utilized four algorithms, namely, EDADT, hybrid IDS, and semisupervised and varying HOPERRA algorithms on KDD dataset to solve the issues in WSN. The distributed network environment like smart grid composed of various components such as sensors, digital meters, and digital controls. Reliable IDS design requires the security assurance mechanism for sensors due to the changes in node behaviors. Singh et al. [9] constructed an effective sensor activity detection system adaptive to the behavioral changes of the nodes. The analysis of the skeptical behavior of nodes supports an efficient malicious behavior detection. The existence of attacks hides the useful information in the network. The utilization of spatial data decreased the clustering efficiency. Advanced Metering Infrastructure (AMI) is responsible for collection, measurement, and transmission of data from the smart meter to data center. The security of the AMI is the major concern during its deployment to the smart grid. Faisal et al. [10] proposed the reliable IDS architecture that includes the individual IDS and AMI components such as AMI head end, smart meter, and data concentrator. Shrivastava and Gupta [11] analyzed the spatial data by using density-based clustering algorithms. The elimination of noisy objects and outliers increased the efficiency of network effectively. But the computation of cluster centroid is difficult in that approach. The ineffective cluster center degraded the efficiency and made the global minimum computation difficult. Ganapathy et al. [12] identified proper cluster center
Security and Communication Networks by using fuzzy rules based clustering model. Global optimum value is the gain factor which is derived from the maximum classification and detection rate values. The use of single classifier in IDS failed to create the best attack prevention system. Panda et al. [13] suggested an intelligent hybrid technique for an intrusion detection. The authors used 2-class classification strategy along with 10-fold cross-validation method for better classification results. Govindarajan and Abinaya [14] provided simultaneous outlier detection and classification to assure the effectiveness compared to traditional approaches. Sivatha Sindhu et al. [15] performed the redundancy removal by discussing the IDS for removal of redundancies that lead to unbiased nature of feature selection algorithms and improvement of detection accuracy by the construction of neurotree. The design of IDS, extension of MANET IDS to Wireless Sensor Network (WSN), is required in intrusion analysis. Butun et al. [16] surveyed the IDS techniques, MANET based IDS, and the application of IDS to WSN. They opened research issues in WSN IDS. The fast utilization of networks in environmental monitoring, weather forecasting, and disaster management raised the assurance of security. Xu et al. [17] proposed the intrusion detection policy specifically for WSN. The monitoring of overall communication process predicted the abnormal working of nodes. Sometimes, in an IDS, the features were also used to predict the unknown attacks. Less awareness of network operators caused the degradation in prediction accuracy. Louvieris et al. [18] presented the anomaly based detection technique to increase the operator awareness against the new attacks in the network. They combined Na¨ıve Bayesian feature selection, 𝐾-means clustering, and C4.5 decision tree for intrusion detection. The integration of multiagent features and high accuracy of data mining techniques were required to enhance the IDS behavior. The data mining techniques governed the extraction of used patterns from a large dataset. Alrajeh et al. [19] discussed the problems that occurred due to various attacks in WSN. Limited computational energy and resources in WSN makes it vulnerable to several unknown attacks. Coppolino et al. [20] utilized both anomalous and misuse based IDS to improve the efficiency of NIDS. The lighter anomalous detection system used a central agent and some local agents. Biswas et al. [21] used the multiagent concept in multilevel IDS. They stored the various types of attacks in the database and analyzed the dependency of new arrival type with the database. The analysis of subject behavior over the unlabeled HTTP streams is required in IDS. Wang et al. [22] employed Affinity Propagation (AP) algorithm to learn the subject’s behavior in dynamic clustering. The data classification, human interaction, deficiency in labeled data were the important issues in NIDS. The classification of network activities into normal and abnormal minimized the misclassification problem effectively. Recently, the modern control systems are integrated with the functional process of physics to create test bed. A test bed makes the research process into the discovery of vulnerabilities in a controlled manner. Morris et al. [23] described the Mississippi State University SCADA Security Laboratory in which model
3 control system was combined with the physical functions. They proposed the cyber security mitigations for SCADA dataset. The penetration of control systems into food, agricultural, and chemical applications governed by the potential vector derived from the deployment of industrial radios. The arrival of high-speed networks in power system made the intrusions in the integration. Pan et al. [24] proposed an innovative approach for the development of specification-based IDS that performed the graphical encoding of relations by using Bayesian network. The identification and transmission of fault or cyber attack quicker operators reacted immediately to avoid the unnecessary loss. Pan et al. [25] proposed sequential pattern mining approach for accurate extraction of power system disturbances and attacks. The introduction of automatic discovery of common paths from the labeled data logs. Pan et al. [26] presented the systematic approach for the design of hybrid IDS and learned the temporal based specifications. They proposed the common path mining algorithms for the learning. From the study, the preservation of specific information from these attacks was an active research area in the network. Guarantee of integrity and availability of resources were the investigating parameters in the research field to provide better detection rate for attacks. The major observation is that the creation of agent-based IDS for the detection and prevention of attacks in real-time datasets by using the combination of clustering with the multiagent rules was the major research area in IDS. Also, the provision of necessary update of attacks in the original database required improving the detection accuracy.
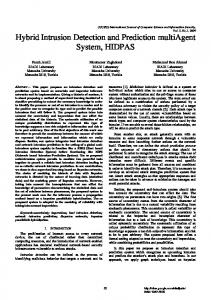
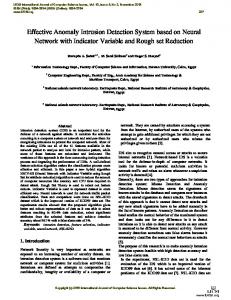
3. ARMA-IDS: Adaptive Rule-Based Multiagent Intrusion Detection System The Adaptive Rule-based Multiagent Intrusion Detection System (ARMA-IDS) implemented on KDD cup 1999 and SCADA datasets to convey that the intrusion detection performance in SCADA is better than the KDD cup’99. The overall flow of the proposed Adaptive Rule-Based Multiagent Intrusion Detection System is shown in Figure 1. 3.1. Training Data. The proposed ARMA-IDS uses two datasets, namely, KDD cup 1999 and SCADA datasets, in the training phase. For KDD cup’99, the training data includes seven different network traffic patterns in the form of TCP dump data, approximately 5 million connection records with the size of each record as 100 bytes. A list of 41 features for KDD cup’99 is presented in Table 1. The objective of this research is to show the better intrusion detection rate in SCADA and KDD cup’99. The typical SCADA architecture as shown in Figure 2 comprises the following units: corporate infrastructure, SCADA master, network, Remote Terminal Unit (RTU), sensor, actuators, and plant. SCADA includes the laboratory readings of water tower, gas pipeline, and electric transmission system. All three readings containing preprocessed network transaction and lower strip transaction data are organized as shown in Table 2.
4
Security and Communication Networks
KDD cup’99 Training ADA SCADA
RBA Relay response based rule generation
Density-based clustering
RMA
FA Sort relay responses
Yes Check misbehavior ?
Data processing
Testing No Real-time traffic
Report to user
Failure identification
SA
Figure 1: Flow of the proposed Adaptive Rule-Based Multiagent Intrusion Detection System.
The scenarios in SCADA electrical transmission system are short circuit fault, line maintenance, remote tripping command injection, and changes in relay settings and data injection. Among these, the last three scenarios are identified as attack vectors in an electric transmission system under real-time scenario.
Corporate infrastructure
SCADA master
SCADA master
(1) Remote Tripping Command Injection. An attack in the relay sends the command to the breaker to be open.
Network
RT
S
RT
A
S
RT
A
S
RT
A
S
A
Plant
Figure 2: SCADA architecture.
The detailed description of gas and water parameters and the electrical system parameters is listed in Tables 3 and 4, respectively. 3.2. Testing Data: Attack Model. The proposed method takes the real-time data for the testing process. This section investigates the existence of various attacks on KDD cup 1999 and SCADA dataset. Table 5 illustrates the different types of attacks present in the KDD cup 1999 dataset. The testing attacks models for SCADA include eight attack vectors for gas and water datasets as shown in Table 6.
(2) Relay Setting Changes. Distance protection scheme is responsible for the configuration of relay design. The arrival of attacker changes the settings leading to a poor response to the fault. (3) Data Injection. The changing parameters of voltage, current, and sequence components aimed to handle the block-out by the operator. The existence of correlation between the gas pipeline or water storage parameters and the attacks makes the SCADA system unsuitable in IDS research. Hence, they must be avoided to extend the applicability of the system. The group of these attack models is analyzed in this proposed agent-based IDS. The rule formation for analysis of intrusions is based on the response of relays. The misbehavior of real attack models compared to SCADA dataset is identified, and the feedback report sent to the user and database. 3.3. Multiagent-Based Intrusion Detection System. The collection and analysis of massive data traffic are governed by using the distributed Multiagent IDS (MA-IDS). The gathering and
Security and Communication Networks
5
Table 1: List of 41 features in KDD cup’99. S. number (1) (2) (3) (4) (5) (6) (7) (8) (9) (10) (11) (12) (13) (14) (15) (16) (17) (18) (19) (20) (21) (22) (23) (24) (25) (26) (27) (28) (29) (30) (31) (32) (33) (34) (35) (36) (37) (38) (39) (40) (41)
Feature name duration protocol type service Flag Src bytes Dst bytes land Wrong fragment urgent hot Num failed logins Logged.in Num compromised Root shell Su attempted Num root Num file creations Num shells Num access files Num outbound cmds Is hot login Is guest login count Srv count Serror rate Srv serror rate Rerror rate Srv rerror rate Same srv rate Diff srv rate Srv diff host rate Dst host count Dst host srv count Dst host same srv rate Dst host diff srv rate Dst host same src port rate Dst host srv diff host rate Dst host serror rate Dst host srv serror rate Dst host rerror rate Dst host srv rerror rate
Table 2: SCADA dataset details. S. number (1) (2) (3)
Dataset Gas pipeline Water tower Electric transmission system
Number of entries
Unique parameters
100,000 200,000
27 24
5,000,000
132
analysis of real-time data model called KDD includes five different agents as follows: (1) Sniffer Agent (SA); (2) Filter Agent (FA); (3) Anomaly Detection Agent (ADA); (4) Rule Mining Agent (RMA); (5) Rule-Based Agent (RBA) (association rule-based and sequential rule-based agent). The reasons to adapt the multiagent IDS are listed as follows: (i) collection of packets between the components; (ii) extraction of relevant packets requires filtering process. (iii) the prediction of abnormal instances or connections in both KDD and SCADA that requires Anomaly Detection Agent; (iv) the rules governing the abnormal instances prediction that require rule-based agent. The selection of specified agents for KDD and SCADA is dependent on the functionalities which are discussed in the following section. 3.3.1. Multiagent Functionalities in KDD. This section describes the functions performed by each agent in KDD dataset in detail. Sniffer Agent. The first agent that can capture the packets and investigates the contents presented in the captured packets. The sniffing operation performed by this agent provides various advantages, namely, (i) an efficient analysis of network problems; (ii) easy detection of intrusion attempts; (iii) compliance documentation by using regular monitoring. SA records the captured packets in memory in the sequential intervals. The distribution of packets throughout the network and the duplication process in SA limit the charge assigned to the network. The packets captured from the SA are passed to the next agent that is called Filter Agent (FA) to isolate the irrelevant packets from large size packets. Filter Agent. The distributed framework collects the large number of events from the different nodes in a network. FA received the captured packets from the SA and performed the following actions to know the fields and categories: (i) the destination address and protocol used for packet transfer are identified; (ii) by using packets category (TCP, UDP, and ICMP), FA arranges the packets in ascending order to find the type of intrusions.
6
Security and Communication Networks Table 3: Gas and water parameters.
S. number (1) (2) (3) (4) (5) (6) (7) (8) (9) (10) (11) (12) (13) (14) (15) (16) (17) (18) (19) (20) (21) (22) (23) (24) (25) (26) (27)
Parameter command address response address command memory response memory command memory count response memory count comm read function comm write function resp read function resp write function sub function command length resp length gain reset deadband cycletime rate setpoint control mode control scheme pump solenoid crc rate Measurement Time result
Anomaly Detection Agent (ADA). The ADA in MA-IDS utilized the clustering mechanisms to identify the intrusions in the network. 𝐾-means and density-based algorithms are the predominant algorithms for clustering process. Even though the 𝐾-means algorithm offered the fast clustering performance, noise occurrence and dependency were more. Hence, this paper utilizes the density-based clustering to limit the cluster dependency, noise. The density-based clustering(DBC-) based ADA (DBC-ADA) contains the following steps to detect the anomaly behavior. The DBC algorithm implementation depends on the following parameters: instances for the data arrival (𝑓𝑖 ), cluster center (𝑐𝑖 ), threshold value (𝛼), and minimum number of neighbors 𝑁min . There are two metrics governing the DBC processes and they are listed as follows. (i) Reachability. The instance for data arrival is densityreachable from the cluster center and the center has the sufficient neighbors within the threshold value. (ii) Connectivity. The instances 𝑓𝑖 and 𝑐𝑖 are density connected only if there exist a new instance 𝑓new that has the sufficient number of minimum neighbors and both 𝑓𝑖 and 𝑐𝑖 are within threshold value.
S. number (1) (2) (3) (4) (5) (6) (7) (8) (9) (10) (11) (12) (13) (14) (15) (16) (17) (18) (19) (20) (21) (22) (23) (24)
Parameter command address response address command memory response memory command memory count response memory count comm read function comm write function resp read function resp write function sub function command length resp length HH HH L LL control mode control scheme pump crc rate Measurement Time result
(1) Let the data records 𝐷 = {𝐷1 , 𝐷2 , 𝐷3 , . . . , 𝐷𝑁}𝑧 arrive at instance 𝑓𝑖 . (2) The data is mapped to the density grid 𝑔(𝑥) = {𝑗1 , 𝑗2 , 𝑗3 , . . . , 𝑗𝑑 } and density coefficient (depending on the instances) is greater than the threshold value. (3) Calculate the Euclidean distance between the cluster center and the instance of the closest cluster. The distance between the instance and the cluster center is considered as the basic parameter in the densitybased clustering process and defined by 𝑛
2
distance (𝑓𝑖 , 𝑐𝑖 ) = √ ∑ (𝑓𝑖 − 𝑐𝑖 ) .
(1)
𝑖=1
(4) The distance between the instances is recorded and the cluster center that is less than the threshold value (𝛼) is regarded as the neighbor of cluster center. (5) If the size of neighbors is less than the minimum number of neighbors 𝑁min , then the corresponding data is regarded as noise. (6) If the size of neighbors is more than the value of 𝑁min , then the corresponding data is added to the
Security and Communication Networks
7
Table 4: Parameters of electric data. Network/other
Features
data
Voltage Phase Angle (R1-PA1 to R4-PA1) Voltage Phase Magnitude (R1-PM1 to R4-PM1) Voltage Phase Angle (R1-PA2 to R4-PA2) Voltage Phase Magnitude (R1-PM2 to R4-PM2) Voltage Phase Angle (R1-PA3 to R4-PA3) Voltage Phase Magnitude (R1-PM3 to R4-PM3) Current Phase Angle (R1-PA4 to R4-PA4) Current Phase Magnitude (R1-PM4 to R4-PM4) Current Phase Angle (R1-PA5 to R4-PA5) Current Phase Magnitude (R1-PM5 to R4-PM5) Current Phase Angle (R1-PA6 to R4-PA6) Current Phase Magnitude (R1-PM6 to R4-PM6) Pos.-Neg. – Zero Voltage Phase Angle (R1-PA7 to R4-PA7) Pos.-Neg. – Zero Voltage Phase Magnitude (R1-PM7 to R4-PM7) Pos.-Neg. – Zero Voltage Phase Angle (R1-PA8 to R4-PA8) Pos.-Neg. – Zero Voltage Phase Magnitude (R1-PM8 to R4-PM8) Pos.-Neg. – Zero Voltage Phase Angle (R1-PA9 to R4-PA9) Pos.-Neg. – Zero Current Phase Angle (R1-PA(10–12) to R4-PA(10–12)) Pos.-Neg. – Zero Current Phase Magnitude (R1-PM(10–12) to R4-PM(10–12)) S
timestamp control panel log1 control panel log2 control panel log3 control panel log4 realy1 log realy2 log realy3 log realy4 log snort log1 snort log2 snort log3 snort log4 marker fault loc load con1 load con2 load con3 Status flag
Table 6: Attack model for SCADA. Attack name Normal Na¨ıve Malicious Response Injection Complex Malicious Response Injection Malicious State Command Injection Malicious Parameter Command Injection Malicious Function Code Injection Denial Of Service Reconnaissance
Abbreviation Normal(0) NMRI(1) CMRI(2) MSCI(3) MPCI(4) MFCI(5) DOS(6) Recon(7)
The algorithm of density-based clustering by an Euclidean distance is described as follows. Density-Based Clustering Inputs. Instances (𝑓𝑖 ), cluster center (𝑐𝑖 ). Output. Clusters (𝐶new , 𝐶int ). Step 1. Extract the instances and center and initialize the cluster as 𝐶 = 0. Step 2. Calculate the Euclidean distance by using (1). Step 3. Estimate the neighborhood. Step 4. Extract two most similar clusters. Step 5. Merge the similar clusters. If (size of neighbor > 𝛼) Add the data to the cluster Else Extracted cluster is considered as noise. Step 6. Calculate the distance between instance and cluster center in merged clusters.
Table 5: Attack types on the KDD Cup’99 dataset. Class DOS Probe U2R R2L
Attacks in the training data Back, Land, Smurf, Pod, Neptune, and Teardrop IPsweep, Portsweep, Nmapr, and Satan Load module, Rootkit, Perl, and Buffer overflow Guess passwd, Multihop, Ftp write, Spy, Phf, Imap, Warezclient, and Warezmaster
cluster and it is regarded as normal cluster. Table 7 presents the features selected for clustering process for different categories. Table 8 describes the variables used in density-based clustering and associated description.
Step 7. Classify the instance according to nearest cluster If (neighbors < 𝑁min ) 𝐶new = normal instances; Else 𝐶int is intruder. Initially, the algorithm extracts the instances and the cluster center. The Euclidean distance between the candidate cluster center and the instances estimated and assigned to the nearest cluster. The granularity of density-based clustering is defined by the minimal number of neighborhood instances. The minimization of some instances to the overall instance by the iterative process of merging of similar clusters. The establishment of clusters is too high for a small value of 𝑡 . The formulation of reallocated instances decomposes the clusters. The iterative process of density-based clustering
8
Security and Communication Networks Table 7: Features for clustering process.
Categories Cluster TCP Cluster UDP Cluster SYN flood
Features selected Number of unique ports accessed Number of unique ports accessed Number of unique ports accessed
Mean packet size
Number of RST packets
Mean packet size
Number of ICMP packets
Number of open connections attempted
Number of RST packets
Table 8: Notations used in density-based clustering. Symbols 𝑓𝑖 𝑐𝑖 𝐶 𝑁min 𝛼
Descriptions Instances Cluster center Cluster Minimum number of clusters Minimum number of neighbors required
is performed for nonempty clusters. The merging of similar clusters is performed according to the relationship of instances after the removal of outliers. After the merging, the distance between the new instance and the cluster center is calculated and assigned to the nearest neighbor (NN). The categories of the nearest cluster have a major role in merging process. The estimation of the shortest distance between new instance and cluster center is categorized as normal and intrusion. If the neighborhood for a particular instance is lesser than 𝛼, then a new cluster is formed. Otherwise, the present instance is assigned to noise. The resultant cluster is a candidate for initial cluster centers. The algorithm estimates the distance between the center of the candidate centers and instances. Moreover, the algorithm automatically divides or merges the clusters to estimate the value of the initial cluster centers 𝑘. At last, a new set of initial cluster centers are retrieved, and 𝐶-Means algorithm is used to classify the instances according to normal and abnormal behavior. The summarization of the anomalous connections is required to construct the anomalous behavior provided by Rule Mining Agent (RMA). The proposed ARMA-IDS in this paper efficiently handles the noise and cluster dependency problems by density-based clustering. The Rule-Based Agent (RBA) initiated the rule generation for designated network connections. Parameter Selection. 𝑁min is the minimum number of neighbors depending on the data dimensions such as 𝑁min > 𝑁+1. The low values of 𝑁min (1 and 2) have no meaning in better cluster formation. Hence, the minimum value is selected as more than 2. 𝛼 is the threshold value that is computed from the 𝑘distance graph. The small values of 𝛼 result in large part of the data being not clustered and the large values of threshold lead to the merging. The reasonable similarity measurement via distance formulation has the great impact on the threshold value.
Time range covered by frame Time range covered by frame Time range covered by frame
Rule Formations for Intrusion Detection (RBA). Two rules are defined in this paper for MA-IDS by RBA as follows: (1) association rules; (2) sequential rules. Association Rule-Based Agent. The identification of a relationship between the selected features and traffic characteristics is considered as the major role in rules formation. The association rule-based agents testing the features are as follows: (1) accessing of unique ports (large if attack); (2) average packet size in frame (smaller than normal traffic); (3) number of ICMP destination unreachable packets in frame (large due to the victim response) (4) time range covered by packets (port scan normally depicts the burst in short time range). The formulation of rules in this paper is in the form of 𝐴 ⇒ 𝐵, which satisfy the user-specified minimum support and minimum confidence thresholds. The identified anomalous connections by RMA are large. Hence, the research analyst spends more time for inspection of each connection in the records. The utilization of association rules provided the high summary of connection records and eliminated the infrequent occurring patterns based on minsup value. The low value minsup increases the number of rules that degraded the performance. The increase in rule size affected the operational speed of IDS and caused the redundancy. The assurance of an adequate protection effectively improves the operational speed and redundancy removal with the periodical update of the signature database. Sequential Rule-Based Agent. The usual and unusual patterns in the connection stages of normal traffic governed by sequential rules are defined by RBA. The generation of rules is based on the categorization of normal or an intruder traffic. The depreciation percentage with the minimum support between the reports is used to define the rules. The minimum support is reduced by a stated depreciation percentage (dep) described by Support𝑘 (%) = dep (%) ∗ Support𝑘−1 (%) .
(2)
Here, 𝑘 denotes 𝑘-item set. For each frame, when the number of abnormal occurrences matched within the time frame is greater than the threshold, the packet is declared as intrusion; otherwise it will be regarded as normal.
Security and Communication Networks
9 Table 9: Features for clustering process.
Categories
Features selected
Gas Water Electrical data
Comm read fun Comm read fun Line current magnitude
Resp read fun Resp read fun Snort log
Table 10: Ranges for selected features. Feature Name Line current magnitude Sbort log Relay log Control log Comm read function Resp read function Control mode Measurement
r1
Ranges (High, Warning, Normal, Zero) (True, False) (True, False) (True, False) (3 or 1) (3 or 1) (0 or 1 or 2) 6 to 11 or 1 to 100
r2 r3 r4 r5
Report status
Measurement Measurement Control log
Table 12: Rules formation.
Table 11: Notations used in density-based clustering. Rules
Control mode Control mode Relay log
Output
Relay reports (R1 , R2 , R3 , and R4 ) Normal R2 lacks time stamp 𝑡2 and delayed to Delay 𝑡3 R3 behavior instead of R2 Misbehavior Interchange of relay reports Modified Absence of any report Error
3.3.2. Multiagent Functionalities in SCADA. The hierarchical tree structure in the multiagent system for SCADA contains three agents, namely, monitor, decision, and an action. Each agent performs the corresponding tasks. Monitor Agent (MA). The first agent collects information about the network traffic in gas, water pipeline, and electric transmission system. The extraction of the independent features effectively reduced the noise and irrelevant data. Decision Agent (DA). The DA utilized the density-based clustering to cluster the normal and abnormal patterns into a group. DA highlighted the action and coordinated agents if the abnormal actions are detected. Table 9 lists the selected features for clustering. For both gas and water types in SCADA, the features are comm read fun, resp read function, control mode, and measurement. For SCADA electrical system, the features and their ranges are described as shown in Table 10. The proposed ARMA-IDS integrates distance and density-based measures (Table 11) in the clustering techniques for detection of abnormal packets. Action Agent. Based on the notification, the AA issued the corresponding responses in such a way that a cluster is predicted with the minimum distance. The utilization of density-based clustering algorithm effectively isolated the
Path p1 p2 p3 p4 p5
𝑡1 R1 R1 R1 R2 R1
Time stamps 𝑡3 𝑡4 R3 R4 R2 R3 R3 R2 R3 R1 R3 R4 R2 R4 𝑡2 R2
𝑡5 R4 R4
Output Ideal Delay Misbehaviors Modified Error
normal and abnormal behaviors and the regular database update is also provided. The rule formulation with the consideration of minimum support provided the necessary update by a feedback loop. Table 12 depicts the formulation of association rules. Based on the number of rules, the counting of matched connection is performed. If the frequency is greater than the threshold, it is identified as the normal traffic; otherwise the traffic is affected by an intruder. 3.4. Fuzzy Based Intrusion Detection. Fuzzy rules are formed based on training and testing rules from RBA. These rules are used to classify the behavior of a connection whether it is normal or intruder. Figure 3 shows the flow of the proposed detection blocks. Table 12 describes the final computed set of fuzzy based results. Based on the fuzzy table, the incoming connection is identified as either normal or intrusion. The rules formation for SCADA dataset is based on the paths in one scenario. The continuous variables’ existence in both KDD and SCADA dataset makes the mining algorithms not suitable. Hence, the 1-length items for each attribute are simplified by estimating the frequency of continuously variable occurrence and the frequent items are extracted based on the Support𝑘 (%) value. The mined 1-length items (normal or noise) are stored as the vectors in the class 𝑐 expressed as 𝑐 = [V1 , V2 , . . . , V𝑖 ] ,
(3)
where V𝑖 = {𝑓𝑖 , 1 ≤ 𝑖 ≤ minsupport}. The comparison of items with the minimum and maximum range forms the deviation range of attributes as follows: 𝐷V𝑖 = {𝑓min , 𝑓max } ,
(4)
where 𝑓min = min(𝑓𝑖 ) and 𝑓max = max(𝑓𝑖 ). Then, comparing the deviation range with the effectiveness of attributes (normal or intrusion) decides the fuzzy rules. The compact classification of abnormal patterns depends on the two criteria such as a minimum number of
10
Security and Communication Networks
Features
Fuzzifier
Defuzzifier
Output
Inference engine
Attributes identification from the mined training data
Membership funtion Rules generation Rules base Fuzzy decision
Figure 3: Fuzzy based intrusion detection.
fuzzy rules and short IF part. The definite rules formulation based on the criteria declares that IF part is numerical variable and THEN part is class label to predict the instances as normal and intrusion. During the testing phase, the test data from KDD and SCADA are applied to the fuzzy logic system. The test data with the attributes inclusion passes to the fuzzifier that converts the attributes to the linguistic variables by using the membership function. The state 𝑡 describes the time stamps for states. The calculated minimum support value detects the variation in the output states. For 60% threshold value, the sequence of relay responses R1 , R2 , R3 , and R4 are maximal, which refers to an optimal path. If threshold limit is 70%, then the corresponding sequences varied to update the new path. The time stamps information (𝑡1 to 𝑡5 ) obtained from the agents (SA to RBA) participated in the fuzzy rule generation.
4. Performance Analysis
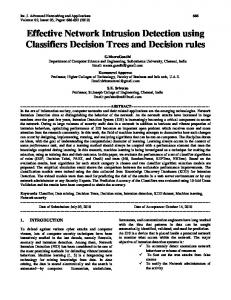
𝑄𝐸 . In general, the algorithm is better only if the error rate is minimum. Figures 4(a), 4(b), and 4(c) depict the variation of error rate with varying detection (𝑃det )/attacking probability (𝑃mal ), and the number of attackers for proposed ARMA-IDS and the random forest algorithm. From Figures 4(a), 4(b), and 4(c), the rule-based multiagent IDS offers the minimum error rate compared to random forest algorithm. The increase in detection probability and the attacking probability gradually decreases the error rate and the up to 30 attacker nodes the error rate is minimum; when the attacker nodes are greater than the 30, the error rate is minimum compared to the existing random forest algorithm. 4.2. Recall. The evaluation of successful detection of members in one class is more significant than the other classes referred to as recall or detection rate 𝑄𝐷. Figures 5(a), 5(b), and 5(c) depict the variation of detection rate with varying detection/attacking probability and the number of attackers for proposed ARMA-IDS and the random forest algorithm. The increase in probability values of detection and attacking provides the maximum detection rate due to the isolation of normal from intrusion. With an increase of attacker nodes, ARMA-IDS provided the best detection rate compared to existing random forest algorithm.
In this section, the performance of the proposed Adaptive Rule-Based Multiagent IDS (ARMA-IDS) is analyzed with the combination of density-based clustering and rules formation. The comparative analysis of ARMA-IDS and the existing random forest, JRip, AdaBoost + JRip, and common path mining algorithm is also illustrated. The proposed framework considered KDD cup 1999 and SCADA as the training dataset and the real-time traffic as a testing dataset. The simulated environment is defined by the real-time traffic in NS-2. In simulation environment of SCADA, the corporate network is modelled as NS-2 emulation (NSE). The ability of introducing the simulator into the live network refers to emulation. The objects existing in the simulator are capable of injecting the traffic to the live network. The interface between the simulator and the live network is provided by the collection of special objects referring to multiagents used in this paper.
4.3. False Detection. The measure of misidentification of normal nodes as attackers is termed as false detection rate 𝑄𝐹 . In general, the algorithm is better only if the false detection rate is maximum. Figures 6(a), 6(b), and 6(c) depict the variation of the false positive rate with varying detection/attacking probability and the number of attackers for proposed ARMA-IDS and the random forest algorithm. With an increase of attacker nodes, ARMA-IDS provides the minimum false positive rate compared to existing random forest algorithm.
4.1. Error Rate. The measure of how many times the base station makes an incorrect decision is referred to as error rate
4.4. Parametric Analysis. The proposed ARMA-IDS validated the SCADA dataset performance by the exploitation
Security and Communication Networks
11
Error rate QE
0.6
0.5 Error rate QE
Error rate QE
0.5 0.4 0.3 0.2
0.4 0.3 0.2 0.1
0.1 0
Error rate QE
0.6
0.5 0.55 0.6 0.65 0.7 0.75 0.8 0.85 0.9 0.95 Pdet (35 attackers, 100 total nodes)
0
1
Random forest ARMA
0.5 0.55 0.6 0.65 0.7 0.75 0.8 0.85 0.9 0.95 Pmal (35 attackers, 100 total nodes)
1
Random forest ARMA (a)
(b) Error rate QE
0.6 Error rate QE
0.5 0.4 0.3 0.2 0.1 0
10 12 15 17 20 22 25 27 30 32 35 37 40 42 45 47 50 Number of attackers (out of 100 nodes) Random forest ARMA (c)
Figure 4: Error rate analysis with 𝑃det , 𝑃mal and number of attackers.
Table 13: Classification results of water pipeline control system. Parameters FPR (%) FNR (%) Accuracy (%)
HH alarm NN classifier ARMA 4.5 2.3 0 0.8 95.5 97.4
Scenario Above H set point Above L set point NN classifier ARMA NN classifier ARMA 2.3 1.2 2.4 1.6 3 2.4 3 2.1 94.7 96.7 94.6 96.8
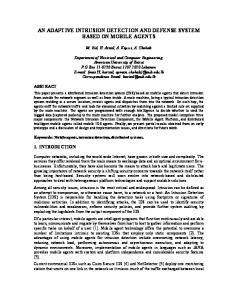
of different scenarios in a water tank control system. The comparative analysis of proposed method with the neural network classifier [23] is on four scenarios, namely, HH alarm, above H set point, above L set point, and LL alarm with the parameters of false positive, false negative, and accuracy as shown in Table 13. The performance comparison of proposed method and the existing neural network classifier shows that ARMA based IDS provides the accuracy compared to NN-classifier. 4.5. Comparative Analysis. The comparison between proposed ARMA-IDS and traditional random forest, JRip, AdaBoost, and common path mining algorithms [26] on the parameters of accuracy, precision, recall, 𝐹-measure, and the number of classes is as shown in Figure 7. The comparison
LL alarm NN classifier ARMA 3.2 1.2 0 1.3 96.8 97.7
yields the better results of accuracy, precision, recall, and 𝐹-measure for a maximum number of classes. The rulebased detection and the feedback update of fault response to the SCADA database improve the adaptability of real-time monitoring. 4.6. Detection Rate Analysis. The increase in connection records will increase the detection rate linearly. The sizes of connection records in both KDD and SCADA datasets increased from 1000 to 5000, and the corresponding detection rate is measured. Figure 8 depicts the graphical representation of detection rate variation on connection records for both KDD and SCADA datasets. Figure 8 shows that the proposed ARMA-IDS provided better detection rate in SCADA compared to KDD datasets.
12
Security and Communication Networks Recall QD
1
1
0.8
0.8
0.6 0.4
0.6 0.4 0.2
0.2 0
Recall QD
1.2
Recall QD
Recall QD
1.2
0.5 0.55 0.6 0.65 0.7 0.75 0.8 0.85 0.9 0.95 Pdet (35 attackers, 100 total nodes)
0
1
0.5 0.55 0.6 0.65 0.7 0.75 0.8 0.85 0.9 0.95 Pmal (35 attackers, 100 total nodes)
1
Random forest ARMA
Random forest ARMA (a)
(b) Recall QD
1.2
Recall QD
1 0.8 0.6 0.4 0.2 0
10 12 15 17 20 22 25 27 30 32 35 37 40 42 45 47 50 Number of attackers (out of 100 nodes) Random forest ARMA (c)
Figure 5: Recall analysis with various 𝑃det , 𝑃mal and number of attackers.
For the minimum number of records (1000), the detection rate in KDD is 62.53% and in SCADA is 78.56%. The performance of SCADA is 16.03% more than KDD. Similarly, for the maximum number of records (5000), the detection rate of KDD is 81.6% and SCADA is 95.62% that is 14.05% better. The comparison of detection rate proved that SCADA has the higher detection performance compared to KDD. 4.7. Zero-Day Attack Scenario Analysis. In existing hybrid IDS [25], the performance validation is investigated under various attacking scenarios such as zero-day and unknown in terms of detection accuracy. Table 14 presents the variations of detection accuracy for existing hybrid IDS and proposed ARMA-IDS under zero-day attack scenario. The simulation is performed in 10 rounds and the corresponding detection accuracy for each round is tabulated. The existing hybrid IDS and the proposed ARMA-IDS offers 76.3 and 82.89% in the first round. The detection accuracy is linearly increased with the increase in simulation rounds. For the maximum round, the hybrid IDS and the ARMAIDS offer 99.8 and 100% accuracy. The comparative analysis between the existing hybrid IDS and ARMA-IDS shows that the proposed ARMA-IDS offers 7.95 and 0.2% improvement in minimum and maximum simulation rounds compared to hybrid IDS, respectively.
Table 14: Detection accuracy analysis. Round (1) (2) (3) (4) (5) (6) (7) (8) (9) (10)
Detection accuracy (%) Hybrid IDS ARMA-IDS 76.3 82.89 67.3 75.51 50.5 55.59 73.3 81.25 91.8 97.18 64.7 76.64 63.8 73.58 70.7 74.45 76.3 85.84 99.8 100
4.8. Improved Dataset Analysis. The original KDD includes the 5, 209, 460 network transactions and it refers to full dataset. The full version of KDD includes the redundant records and irrelevant DoS items. The inclusion of biased distribution of various attacks causes the difficulties in accurate classifications on U2R and R2L. Hence, the conventional KDD dataset is redefined with 1, 48, 517 network transactions
Security and Communication Networks False detection QF
1.2 1
False detection QF
False detection QF
13
0.8 0.6 0.4 0.2 0
0.5 0.55 0.6 0.65 0.7 0.75 0.8 0.85 0.9 0.95 Pdet (35 attackers, 100 total nodes)
1
False detection QF
1 0.9 0.8 0.7 0.6 0.5 0.4 0.3 0.2 0.1 0
0.5 0.55 0.6 0.65 0.7 0.75 0.8 0.85 0.9 0.95 Pmal (35 attackers, 100 total nodes)
Random forest ARMA
1
Random forest ARMA
False detection QF
(a)
(b)
0.9 0.8 0.7 0.6 0.5 0.4 0.3 0.2 0.1 0
False detection QF
10 12 15 17 20 22 25 27 30 32 35 37 40 42 45 47 50 Number of attackers (out of 100 nodes) Random forest ARMA (c)
120
120
100
100 Detection rate (%)
Parameters
Figure 6: False detection analysis with 𝑃det , 𝑃mal and number of attackers.
80 60 40 20 0
80 60 40 20
Random forest
JRip
Number of classes Accuracy Precision
AdaBoost + Mining ARMA-IDS common (proposed JRip path method) algorithm Path mining methods Recall F-measure
0
1000
2000
3000
4000
5000
Number of connection records KDD SCADA
Figure 8: Detection rate analysis.
Figure 7: Comparative analysis.
and such dataset refers to improved dataset [27]. The classification performance on improved dataset is investigated with the existing and proposed ARMA-IDS regarding the accuracy, Kappa statistics, and FPR and FNR measures. Table 15 shows the variation of the above-mentioned parameters with existing methods [10] and proposed ARMA-IDS.
The comparison of proposed ARMA-IDS with the existing techniques shows the effectiveness of ARMA-IDS. The accuracy of the LimATT classifier is maximum (96.59%) among the existing methods. The integration of tree and vague space partition-based trajectory pattern mining in proposed work further improves the accuracy as 97.47% which is 0.9% improvement. The reduction in number of
14
Security and Communication Networks
References
Table 15: Improved data analysis. Classifier Accuracy Updated Ensemble Active Classifier Leveraging Bag LimAtt Classifier OzaBagAdwin OzaBagASHT Single Classifier Drift ARMA-IDS
Accuracy (%)
Kappa statistics (%)
FPR (%)
FNR (%)
93.39
90.23
3.26
8.7
89.26 95.65 96.59 96.05 95.6 93.97 97.47
84.19 93.6 95.02 94.21 93.58 91.09 94.84
4.04 2.03 2.49 2.15 3.17 2.49 2.24
15.29 6.85 3.39 5.55 3.92 8.23 3.78
instances in the improved dataset causes the reduction in accuracy and Kappa statistics. The Leveraging bag, LimAtt, and OzaBagAdwin offer better accuracy and Kappa statistics. But the proposed ARMA-IDS improves the accuracy and Kappa statistics based on agents-based framework.
5. Conclusion In this paper, an investigation of detection performance Adaptive Rule-Based Multiagent Intrusion Detection System (ARMA-IDS) on KDD and SCADA datasets is presented. The proposed ARMA-IDS validated its performance on KDD cup 1999 dataset and SCADA dataset. This paper combined the definition of rules and responsibilities for each agent for anomaly and misuse based detection. The proposed ARMA-IDS detected the faults in the network and provided the update in the existing database by a provision of the feedback loop. The database update improved the detection accuracy in a considerable manner. The instance based distance estimation and cluster size reduction by the fuzzy rules formulation offered better detection accuracy in SCADA and KDD datasets. The intrusions are detected by the analysis of response functions and the relay reports in corresponding gas/water pipeline and electric transmission system, respectively. Distance and density-based clustering algorithm formed the clusters of selected features. The formulation of rules in both association and sequential detected and classified the faults for each agent. The comparative analysis of proposed ARMA-IDS with the existing random forest, JRip, AdaBoost, and mining common path algorithms on the parameters of accuracy, precision, recall, 𝐹-measure, false detection, and probabilities of detection/attacking shows the effectiveness of proposed method. Moreover, the analysis of detection rate on KDD and SCADA datasets is made and proved that the proposed ARMA-IDS provided better performance in SCADA and KDD.
Competing Interests The authors declare that they have no conflict of interests.
[1] Y. Zhang, L. Wang, W. Sun, R. C. Green II, and M. Alam, “Distributed intrusion detection system in a multi-layer network architecture of smart grids,” IEEE Transactions on Smart Grid, vol. 2, no. 4, pp. 796–808, 2011. [2] S. Shamshirband, N. B. Anuar, M. L. M. Kiah, and A. Patel, “An appraisal and design of a multi-agent system based cooperative wireless intrusion detection computational intelligence technique,” Engineering Applications of Artificial Intelligence, vol. 26, no. 9, pp. 2105–2127, 2013. [3] C.-L. Lui, T.-C. Fu, and T.-Y. Cheung, “Agent-based network intrusion detection system using data mining approaches,” in Proceedings of the 3rd International Conference on Information Technology and Applications (ICITA ’05), pp. 131–136, Sydney, Australia, July 2005. [4] A. Chauhan, G. Mishra, and G. Kumar, “Survey on data mining techniques in intrusion detection,” International Journal of Scientific & Engineering Research, vol. 2, no. 7, pp. 1–4, 2011. [5] J. J. Davis and A. J. Clark, “Data preprocessing for anomaly based network intrusion detection: a review,” Computers & Security, vol. 30, no. 6-7, pp. 353–375, 2011. [6] S. A. Joshi and V. S. Pimprale, “Network Intrusion Detection System (NIDS) based on data mining,” International Journal of Engineering Science and Innovative Technology, vol. 2, no. 1, pp. 95–98, 2013. [7] E. W. T. Ferreira, G. A. Carrijo, R. de Oliveira, and N. V. de Souza Araujo, “Intrusion detection system with wavelet and neural artifical network approach for networks computers,” IEEE Latin America Transactions, vol. 9, no. 5, pp. 832–837, 2011. [8] G. V. Nadiammai and M. Hemalatha, “Effective approach toward Intrusion Detection System using data mining techniques,” Egyptian Informatics Journal, vol. 15, no. 1, pp. 37–50, 2014. [9] M. Singh, G. Mehta, C. Vaid, and P. Oberoi, “Detection of malicious node in wireless sensor network based on data mining,” in Proceedings of the International Conference on Computing Sciences (ICCS ’12), pp. 291–294, September 2012. [10] M. A. Faisal, Z. Aung, J. R. Williams, and A. Sanchez, “Datastream-based intrusion detection system for advanced metering infrastructure in smart grid: a feasibility study,” IEEE Systems Journal, vol. 9, no. 1, pp. 31–44, 2015. [11] P. Shrivastava and H. Gupta, “A review of density-based clustering in spatial data,” International Journal of Advanced Computer Research, vol. 2, pp. 200–202, 2012. [12] S. Ganapathy, K. Kulothungan, P. Yogesh, and A. Kannan, “A novel weighted fuzzy C-means clustering based on immune genetic algorithm for intrusion detection,” Procedia Engineering, vol. 38, pp. 1750–1757, 2012. [13] M. Panda, A. Abraham, and M. R. Patra, “A hybrid intelligent approach for network intrusion detection,” Procedia Engineering, vol. 30, pp. 1–9, 2012. [14] M. Govindarajan and V. Abinaya, “An outlier detection approach with data mining in wireless sensor network,” International Journal of Current Engineering and Technology, vol. 4, pp. 929–932, 2014. [15] S. S. Sivatha Sindhu, S. Geetha, and A. Kannan, “Decision tree based light weight intrusion detection using a wrapper approach,” Expert Systems with Applications, vol. 39, no. 1, pp. 129–141, 2012.
Security and Communication Networks [16] I. Butun, S. D. Morgera, and R. Sankar, “A survey of intrusion detection systems in wireless sensor networks,” IEEE Communications Surveys & Tutorials, vol. 16, no. 1, pp. 266–282, 2014. [17] J. Xu, J. Wang, S. Xie, W. Chen, and J.-U. Kim, “Study on intrusion detection policy for wireless sensor networks,” International Journal of Security and its Applications, vol. 7, no. 1, pp. 1–6, 2013. [18] P. Louvieris, N. Clewley, and X. Liu, “Effects-based feature identification for network intrusion detection,” Neurocomputing, vol. 121, pp. 265–273, 2013. [19] N. A. Alrajeh, S. Khan, and B. Shams, “Intrusion detection systems in wireless sensor networks: a review,” International Journal of Distributed Sensor Networks, vol. 9, no. 5, Article ID 167575, 2013. [20] L. Coppolino, S. D’Antonio, A. Garofalo, and L. Romano, “Applying data mining techniques to Intrusion Detection in Wireless Sensor Networks,” in Proceedings of the 8th International Conference on P2P, Parallel, Grid, Cloud and Internet Computing (3PGCIC ’13), pp. 247–254, October 2013. [21] A. Biswas, M. Sharma, T. Poddder, and N. Kar, “An approach towards multilevel and multiagent based intrusion detection system,” in Proceedings of the IEEE International Conference on Advanced Communication, Control and Computing Technologies (ICACCCT ’14), pp. 1787–1790, IEEE, Ramanathapuram, India, May 2014. [22] W. Wang, T. Guyet, R. Quiniou, M.-O. Cordier, F. Masseglia, and X. Zhang, “Autonomic intrusion detection: adaptively detecting anomalies over unlabeled audit data streams in computer networks,” Knowledge-Based Systems, vol. 70, pp. 103–117, 2014. [23] T. Morris, A. Srivastava, B. Reaves, W. Gao, K. Pavurapu, and R. Reddi, “A control system testbed to validate critical infrastructure protection concepts,” International Journal of Critical Infrastructure Protection, vol. 4, no. 2, pp. 88–103, 2011. [24] S. Pan, T. Morris, and U. Adhikari, “A specification-based intrusion detection framework for cyber-physical environment in electric power system,” International Journal of Network Security, vol. 17, no. 2, pp. 174–188, 2015. [25] S. Pan, T. Morris, and U. Adhikari, “Developing a hybrid intrusion detection system using data mining for power systems,” IEEE Transactions on Smart Grid, vol. 6, no. 6, pp. 3104–3113, 2015. [26] S. Pan, T. Morris, and U. Adhikari, “Classification of disturbances and cyber-attacks in power systems using heterogeneous time-synchronized data,” IEEE Transactions on Industrial Informatics, vol. 11, no. 3, pp. 650–662, 2015. [27] M. Tavallaee, E. Bagheri, W. Lu, and A. A. Ghorbani, “A detailed analysis of the KDD CUP 99 data set,” in Proceedings of the 2nd IEEE Symposium on Computational Intelligence for Security and Defense Applications (CISDA ’09), July 2009.
15
International Journal of
Rotating Machinery
Engineering Journal of
Hindawi Publishing Corporation http://www.hindawi.com
Volume 2014
The Scientific World Journal Hindawi Publishing Corporation http://www.hindawi.com
Volume 2014
International Journal of
Distributed Sensor Networks
Journal of
Sensors Hindawi Publishing Corporation http://www.hindawi.com
Volume 2014
Hindawi Publishing Corporation http://www.hindawi.com
Volume 2014
Hindawi Publishing Corporation http://www.hindawi.com
Volume 2014
Journal of
Control Science and Engineering
Advances in
Civil Engineering Hindawi Publishing Corporation http://www.hindawi.com
Hindawi Publishing Corporation http://www.hindawi.com
Volume 2014
Volume 2014
Submit your manuscripts at https://www.hindawi.com Journal of
Journal of
Electrical and Computer Engineering
Robotics Hindawi Publishing Corporation http://www.hindawi.com
Hindawi Publishing Corporation http://www.hindawi.com
Volume 2014
Volume 2014
VLSI Design Advances in OptoElectronics
International Journal of
Navigation and Observation Hindawi Publishing Corporation http://www.hindawi.com
Volume 2014
Hindawi Publishing Corporation http://www.hindawi.com
Hindawi Publishing Corporation http://www.hindawi.com
Chemical Engineering Hindawi Publishing Corporation http://www.hindawi.com
Volume 2014
Volume 2014
Active and Passive Electronic Components
Antennas and Propagation Hindawi Publishing Corporation http://www.hindawi.com
Aerospace Engineering
Hindawi Publishing Corporation http://www.hindawi.com
Volume 2014
Hindawi Publishing Corporation http://www.hindawi.com
Volume 2014
Volume 2014
International Journal of
International Journal of
International Journal of
Modelling & Simulation in Engineering
Volume 2014
Hindawi Publishing Corporation http://www.hindawi.com
Volume 2014
Shock and Vibration Hindawi Publishing Corporation http://www.hindawi.com
Volume 2014
Advances in
Acoustics and Vibration Hindawi Publishing Corporation http://www.hindawi.com
Volume 2014