A Fuzzy Approach For Detecting Anomalous Behaviour in E-mail Traffic Mark JynHuey Lim1, Michael Negnevitsky1, and Jacky Hartnett2 School of Engineering, University of Tasmania, Australia, Email:
[email protected],
[email protected] 1
School of Computing, University of Tasmania, Australia, Email:
[email protected]
2
Abstract This paper investigates the use of fuzzy inference for detection of abnormal changes in email traffic communication behaviour. Several communication behaviour measures and metrics are defined for extracting information on the traffic communication behaviour of email users. The information from these behaviour measures is then combined using a hierarchy of fuzzy inference systems, to provide an abnormality rating for overall changes in communication behaviour of suspect email accounts. The use of fuzzy inference is then demonstrated with a case study investigating the email traffic behaviour of a person’s email accounts from the Enron email corpus. Keywords Email, traffic analysis, electronic surveillance, anomaly detection, fuzzy logic, fuzzy inference system, abnormality ranking, Enron email corpus.
INTRODUCTION On 10th August 2006, 21 terror suspects were arrested in Britain on suspicion of plotting to blow up United States bound commercial airflights with liquid explosives (Natta et al., 2006). It was reported that British security services, MI5, had been monitoring these suspects for up to at least 12 months prior to making the arrests in August 2006. The New York Times (Natta et al., 2006) reported that MI5 had used several sources of information to monitor the activities of the British terror suspects. These methods included: bugging their apartments, tapping their phones, monitoring their bank transactions, and eavesdropping on their Internet traffic and email messages. This British terror case highlights the importance of monitoring the activities of terror suspects. Monitoring helps law enforcement investigators keep track of what terror suspects are doing, as well as who they are communicating with, and whether suspects are doing anything that indicates an unusual change in their pattern of behaviour compared to their normal activities (e.g. informing terror cell members when to conduct the attack). If the British security services had not been keeping watch on the activities of the British terror suspects and made the arrests based on what they had observed, the world might have experienced another airlinerelated tragic event, similar to the terrorist attacks in the United States on September 11, 2001 (Whitney and Strasser, 2004). Another point to note from the New York Times article is how the use of multiple sources of information by British Security Services may have helped to provide a broader perspective on what the terror suspects were doing. Multiple sources of information such as phone tapping, monitoring of bank transactions, and eavesdropping on Internet traffic and email messages, provided the British security services with a variety of sources for detecting any unusual patterns of behaviour or change from normal habits (e.g. an unusually large bank withdrawal). One of the difficulties in dealing with multiple sources of information is how to combine or “fuse” the information together. Some of the information sources may show evidence that unusual activity is
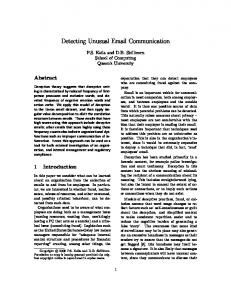
occurring, but sometimes it may not be clear to the investigator how to combine the information together. Another problem is that it may be difficult for the investigator to know which monitored suspect should be observed more closely either as a matter of priority or based on the available evidence. Our research work is on the analysis of email traffic communications, with a focus on determining how artificial intelligence techniques could be useful in aiding the user/intelligence analyst to investigate a suspected individual’s email traffic communication behaviour. In our previous work (Lim et al., 2005, Lim et al., 2006) an email traffic analyser system was developed as a conceptual system to investigate the use of data visualisation techniques and decision trees (Witten and Frank, 2005, Negnevitsky, 2004) for finding “unusual” communication behaviour from simulated email traffic data. Our recent work focuses on developing a new anomaly detection module for the email traffic analyser system, which analyses a list of suspects for deviations from their normal patterns of communication behaviour in email traffic and alerts the user when an abnormal change in communication behaviour has occurred. The recent work also looks at what the email traffic analyser system can reveal from genuine email traffic data. A diagram of the email traffic analyser system is shown in Figure 1.
Figure 1: The email traffic analyser system. In this paper, a brief description is first provided on anomaly detection and how the method of anomaly detection is being used to detect changes in email traffic communication behaviour. The second part of the paper describes defining email traffic communication behaviour measures and how these will be used to record behavioural information on the email user being analysed. The third part of the paper describes how the
anomaly detection module will profile the behaviour of email users and detect changes in communication behaviour patterns. The fourth section describes how fuzzy inference is being used to combine information from different communication behaviour measures. This is then followed by a case study of the Enron email corpus, comparing the alert results produced by individual communication behaviour measures and the results produced after fusing the information together using fuzzy inference.
ANOMALY DETECTION The main aim of our current work is to monitor the email traffic of a suspected individual for any significant deviations from their normal communication behaviour patterns. The purpose of this is to bring to the attention of the user/analyst that an abnormal or unusual event is occurring and assist them in finding the location of the unusual event in the data. Our aim is to just inform the user about the presence of an unusual change in communication behaviour for the monitored suspect and allow the user to utilise data visualisation tools (Lim et al., 2005, Lim et al., 2006) or other analysis tools to investigate the details of that unusual event. We leave it up to the user to decide the context or meaning of the unusual event (e.g. is it a planned terrorist attack or a planned birthday party?), rather than try to encode the contextual knowledge into the system. The method being used to detect changes in email traffic communication behaviour is anomaly detection, a method that is commonly used in intrusion detection (Bace and Mell, 2001) to detect new types of intrusion attacks, previously unknown to a computer system or computer network. Anomaly detection is based on the idea that the computer system or computer network has a “normal” operating state, which can be used to determine if the system is currently under attack from an unknown intruder. In intrusion detection, the intrusion detection system (IDS) builds a model of the target computer system’s “normal” state of behaviour and uses that model to determine if the current state of the system is exhibiting significant deviations from the normal state of behaviour. If there are significant deviations, then the IDS informs the system or network administrator that there is an abnormal change in behaviour, indicating a possible attack on the computer system or computer network. Although anomaly detection is commonly used in computer network security (Mohay, 2003), the same principles may also be applied for electronic surveillance applications when monitoring suspected individuals for changes in communication behaviour. In our email traffic analyser system, the anomaly detection module is used to detect possible changes in email traffic communication behaviour for a list of suspected individuals. The email traffic analyser system firstly requires the user to select a list of suspect email addresses from the email system being analysed, to specify which email accounts will be monitored. The user then selects a historical period of time or “profiling period” (e.g. a period of 1 year, starting at two years ago), which is used by the anomaly detection module to build behaviour profiles for all suspects and record their “normal” communication behaviour patterns. After normal behaviour profiles have been created and stored in the email traffic database (Figure 1), the user then selects a recent period of time or “surveillance period” (e.g. a period of 6 months, ending on last week), which is used by the anomaly detection module to determine whether the recent behaviour of the suspects has significantly deviated from their “normal” communication behaviour.
DEFINING E-MAIL TRAFFIC COMMUNICATION BEHAVIOUR MEASURES Before changes in communication behaviour patterns can be detected, communication behaviour measures need to be defined in order for the anomaly detection module to determine what kind of information will be used to record a change in communication behaviour. Thus, it is necessary to define communication behaviour measures, in order to describe particular aspects of an individual’s email traffic communication behaviour and to describe how that individual’s communication behaviour may have changed at different periods of time. In this work, communication behaviour measures can be defined based on three sets of information taken from the header segments of email messages: the sender (the “from” field), the recipient/s (the “To”, “CC”, and “BCC” fields), and the date/time that the message was sent (from the “date” field). Using these three basic sets of information from the header component of email messages (excluding the content of email messages), the following types of communication behaviour measures can be defined:
•Email Traffic Volume – based on a count of the number of emails generated by an individual per hour, per day, per week, or per month, and sent to a particular contact. This provides information on the traffic volume flow of emails generated by an individual and the rate at which messages are being sent to particular contacts. •Delays Between Emails Sent (or “Sending Delays”) – based on a measure of the time delays between each email message sent by an individual. This provides information on expected delays between each message sent by an individual to particular contacts. •Replying Response Time (or “Replying Delays”) – based on a measure of the time it takes for an individual to write a response email to messages received from particular associates. This provides information on how quickly an individual is expected to reply to particular associates. After defining the above communication behaviour measures, a set of metrics can be computed to produce a number that describes and summarises information about a particular communication behaviour measure. Each metric computed will provide information about an aspect of the monitored individual’s communication behaviour. The following set of metrics were defined to describe and summarise each of the above communication behaviour measures, using statistical methods (Salkind, 2004, Gravetter and Wallnau, 2004, Chatfield, 1996): •Consistency of Weekly Email Traffic Volume – computes the autocorrelation of the weekly volume of emails produced by an individual, to indicate how “consistent” or “reliable” an individual is with the weekly volume of email traffic sent to particular associates. The autocorrelation, r, produces a number between –1.0 to +1.0 to indicate the relationship between each timeseries point in the weekly email traffic volume data. This is computed using the autocorrelation formula from (Chatfield, 1996):
∑( x N −1
r=
t =1
t
− x(1) )( xt +1 − x( 2 ) )
N −1 2 ( ) ( xt − x( 2) ) 2 x − x ∑ (1) ∑ t t =1 t =1 N −1
, where x1, ..., xN, are a set of N observations,
N −1
x(1) = ∑xt /( N −1) , is the mean of the first N – 1 observations, and t =1
N
x( 2 ) = ∑ xt /( N −1) , is the mean of the last N – 1 observations. t =2
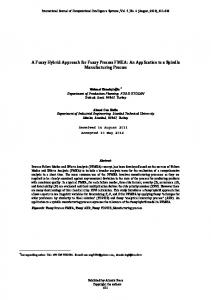
•Percentage of Weekly Email Traffic Volume – computes the average percentage of emails sent to particular associates each week (e.g. 10% of emails per week to contact A, 40% per week to contact B, 50% per week to contact C). •Median of Sending Delays – computes the most commonly occurring time delays between emails sent to a particular associate, by using the statistical median. •Median of Replying Delays – computes the most commonly occurring response delay between e mails replied to a particular associate, by using the statistical median. It should be noted that when analysing email traffic, one could also analyse the flow of email messages in terms of the direction of the email traffic (i.e. email messages are either being sent or received by an individual). By taking the direction of email traffic into account, the original four sets of metrics described above can be expanded into nine metrics, which summarises and describes an individual’s incoming or outgoing email traffic communication behaviour with each of their contacts. The diagram in Figure 2 shows the mapping of the nine metrics in relation to the communication behaviour measures. Note that the metric titled “Median Of
Combined Replying Delays With Contacts” considers the most commonly occurring response delay for both incoming and outgoing email traffic, hence providing information about the speed of the sendresponse interactions between the individual and a particular associate. These nine metrics are being used to record information about the state of the suspected individual’s traffic communication behaviour patterns for the anomaly detection module. Note that the above is not an exhaustive list of all possible communication behaviour measures or metrics that can be extracted from email header information (i.e. sender, recipient, date/time information). The list defined above is the basic set of email traffic behaviour measures that we have chosen to focus upon for this work. Other researchers working on similar or related email surveillance applications have explored different types of measures that can be extracted from sender, recipient, and date/time information. In the work by Stolfo et al. (2003a, 2003b), they have taken a patternbased or habitbased approach where they consider particular habits of email users, such as defining a measure for the time of day the user normally sends emails and a measure for the frequency of communication with particular contacts (“recipient frequency”). Another approach considered are ratiobased measures, where Jiang et al. (2005) defined measures such as: ratio of new addresses vs. former addresses (measuring the rate that new email addresses appear), ratio of new senders vs. former senders (measuring the rate that new sending addresses appear), ratio of emails sent over time (measuring the volume of emails sent). Additional email traffic behavioural measures can be defined by using other header information fields (Tanenbaum, 2003) such as text/HTML formatting of the email, presence of attachments, or MIME file attachment type (Martin et al., 2005).
Figure 2: Mapping of the different patterns of behaviour that we are measuring from email message headers.
ANALYSING FOR CHANGES IN COMMUNICATION BEHAVIOUR After the nine metrics were defined, these were used to build “normal” behaviour profiles for each of the suspect email accounts during their profiling period. To build the normal behaviour profiles, each of the suspect’s communication links with an associate is analysed and the nine metrics are computed for each communication link, which are then stored as the suspect’s behaviour profile in the email traffic database. Figure 3 shows how the nine metrics are computed for each communication link with particular associates.
Figure 3: Diagram of how nine metrics are computed for each of the suspect’s communication links. To detect a change in communication behaviour, the nine metrics are again computed for each of the suspect’s communication links during the surveillance period and the recent communication behaviour measurements are compared with the measurements from the profiling period. If the recent behaviour of any communication link shows significant deviations from their previous communication behaviour patterns, then the user is alerted to the presence of an abnormal change in behaviour. In addition to alerting the user about changes in communication behaviour, the anomaly detection module also informs the user if there are new associates that have appeared in the surveillance period, which were not present in the suspect’s “normal” behaviour profiling period. The work by (Jiang et al., 2005, Stolfo et al., 2003a, Stolfo et al., 2003b, Martin et al., 2005) focuses on providing information on deviations in behaviour for each of the communication behaviour measures that they record from email users. However, the problem with their work is that they present the user/administrator/analyst with a lot of information about each of their communication behaviour measures, but do not summarise the email accounts that exhibit the most deviation in communication behaviour. For the user, all of the communication behaviour measures presented may be quite useful, but on first glance there is too much information for them to determine which email account is exhibiting the most deviation in communication behaviour and maybe thus the most interesting. Summarising all of the suspect email accounts’ change in behaviour is important, because if the user is trying to analyse the data for a large number of email accounts (e.g. more than 10), which email account should they pay attention to first? Which communication links should receive first priority in the investigation?
COMBINING INFORMATION USING FUZZY INFERENCE TECHNIQUES To summarise the changes in communication behaviour of suspect email accounts, we investigate the use of fuzzy inference techniques. Fuzzy inference is a technique that employs the use of a concept called fuzzy logic (Zadeh, 1965). This is an artificial intelligence technique used to assist the computer to interpret vague or uncertain terms. As humans, we often use vague terms to describe things that we observe in the world around us, e.g. “the weather is hot”, “that man is tall”, “the danger risk is high”. Computers normally cannot understand vague terms and must compute observations using crisp numbers, e.g. “the weather is 37.5ºC”, “that man is 182 cm tall”, “the danger risk is 89%”. Fuzzy logic helps computers to interpret vague or uncertain terms in a similar manner to the way humans do, through the use of fuzzy sets (Zadeh, 1965). Figure 4 provides an example of one of the fuzzy sets used by the anomaly detection module.
Figure 4: Example of a fuzzy set used by our anomaly detection module. Fuzzy inference builds upon the use of fuzzy logic and fuzzy sets (Mamdani and Assilian, 1975, Negnevitsky, 2004), using fuzzy heuristic rules that encode knowledge using vague or uncertain terms. For example: “IF temperature is hot, THEN air conditioner output is high”, “IF temperature is warm, THEN air conditioner output is medium”. Fuzzy inference systems operate by processing input data that is crisp (e.g. 37.5ºC), interpreting that value by “fuzzifying” it (e.g. 37.5ºC is a member of the term “hot”), applying the fuzzy rules to determine the output (e.g. air conditioner output is high), then “defuzzifying” the output to produce a crisp number (e.g. air condition output level = 90%). One of the advantages of fuzzy inference is that it is able to process data that contains uncertain information and also has the ability to process input from several measurement sensors in parallel. Fuzzy inference is often used in decision support systems (Turban and Aronson, 2001) to provide advice on things that contain a level of uncertainty or risk, such as, for example, real estate evaluation (Bagnoli and Smith, 1998). Figure 5 shows an example of one of the fuzzy inference systems used by our anomaly detection module, which were designed using the MATLAB fuzzy toolbox (Mathworks, 2006).
Figure 5: Example of a fuzzy inference system used by our anomaly detection module. For the anomaly detection module, we use a hierarchy of several fuzzy inference systems, shown in Figure 6, to combine the input measurements from the nine communication behaviour metrics, and output a recommendation for the overall deviation in communication behaviour for each communication link (i.e. between the suspect and an associate). The final output recommendation given by the fuzzy inference hierarchy produces a number in the range of 0.0 to 1.0, where numbers close to 0.0 signify very little change in overall communication behaviour and numbers close to 1.0 signify a very large change in overall communication behaviour. The output fuzzy sets in Figure 7 shows how the output recommendation is interpreted by the fuzzy inference system before producing a crisp output value. The case study in the next section demonstrates the use of the fuzzy inference hierarchy for summarising the amount of communication behaviour change for a suspected individual’s communication links and compares it to the use of the outputs produced using a standard threshold anomaly detection approach (Bace and Mell, 2001).
Figure 6: The fuzzy inference hierarchy used for the anomaly detection module, where each block is a fuzzy inference system.
Figure 7: The output fuzzy sets used to provide the final output recommendation on the status of a suspect’s communication behaviour.
CASE STUDY – THE ENRON E-MAIL CORPUS The email data used for the case study is the Enron email corpus. When the company Enron was investigated for fraudulent accounting practices in the United States in 2002, the Federal Energy Regulatory Commission (FERC) publicly released a corpus of emails belonging to some of the Enron employees (Diesner et al., 2005). There are currently several versions of the Enron email corpus data that are based on the original email corpus, which are available for researchers to use. A raw form of the email data is provided by Cohen (2004) and other versions of the data based on Cohen’s version are provided by (Fiore and Heer, 2005, Shetty and Adibi, 2005). A
summary of how the Enron email data was processed by several researchers is described by Diesner et al. (2005). The version of the Enron email dataset used for this case study is the “ISI” Enron email dataset made available by Shetty and Adibi (2005). The ISI Enron email dataset contains the email data from the mailboxes of 151 Enron employees, and contains 252,759 email messages. This particular dataset was chosen because it is already formatted for MySQL databases, has documentation on how the data was cleaned, and the structure of the database is suitable for our research work. The ISI Enron email dataset set was filtered into our email traffic database by extracting only the sender, recipient, and date/time information, and ignoring other information not used in our work, such as the content of email messages. The data was also filtered so that messages sent to multiple recipients were considered as separate messages sent to multiple recipients at the same time. The reason for this filtering choice is to enable the communication links to be analysed individually by the email traffic analyser system. After filtering the Enron email traffic data into the email traffic database, the data was further processed to store database information about the sending delays between each email sent and the replying delays for response times to received messages. A simple statistical analysis of the Enron email data showed that there were 75,547 unique email addresses in the email data, 2,042,442 messages were sent (after considering multiple recipients as separate emails), and most of the email messages sent (2,063,748 or 99.966% of messages) were between 1999 to the end of 2002. Selecting A Suspect To Analyse There were a number of key people associated with the Enron financial crisis in 2001 who were considered for analysis. A list of people associated with setting up the fraudulent financial records were given by Fusaro and Miller (2002), some of whom were also part of senior management in Enron. Out of the list of people considered, only a few of them had their full email traffic information collected as part of the sample taken from the 151 former Enron employees. Based on these considerations, the person selected for this case study was Jeffrey Skilling. Skilling first joined Enron in 1990 as the chief executive to be in charge of developing Enron’s trading services, became CEO of Enron in February 2001, then unexpectedly resigned as CEO on 14 th August 2001 for “personal reasons”. The reason for selecting Jeffrey Skilling is that he was a key person involved in transforming Enron from a traditional gasline operator to a “neweconomy” trading company in the 1990’s (Fusaro and Miller, 2002). He also had a short 6month run as CEO of Enron before resigning in August 2001, and most of his mailbox information is available as part of the Enron email dataset. Before analysing Jeffrey Skilling’s email traffic, it had to be determined which out of the 75,547 unique email addresses belonged to Jeffrey Skilling. To find Jeffrey Skilling’s email addresses, a wildcard database search was performed for possible email addresses matching “j%skilli%” and “skilli%”, where “%” is the wildcard character for the search. The results of this search returned 15 possible matching email addresses, shown in Table 1. Table 1: A listing of email addresses possibly belonging to Jeffrey Skilling. Possible Matching Email Addresses for Jeffrey Skilling '
[email protected]', '
[email protected]', '
[email protected]', '
[email protected]', '
[email protected]', '
[email protected]', '
[email protected]', '
[email protected]', '
[email protected]', '
[email protected]', '
[email protected]', '
[email protected]', '
[email protected]', '
[email protected]', '
[email protected]' Profiling the Suspect’s Normal Behaviour Patterns The Enron email dataset mainly covers a timespan from 1999 to end of 2002 with the exception of outlier messages dated at years such as 0001 and 2044, which were excluded from the analysis. During the 1999 – 2002
timespan, there were a number of key events that occurred, ending with the company’s declaration of bankruptcy in December 2001 (Fusaro and Miller, 2002, Fox, 2003). Based on the knowledge of when these key events occurred, the normal behaviour profiling period was selected from 1st January 1999 to 1st August 2000. This period of time was selected because it was before Enron faced its 2001 financial crisis, the period ends at about 6 months before Jeffrey Skilling becomes CEO of Enron in February 2001, and it was before a change in organisational structure resulting from Jeffrey Skilling becoming CEO. Figure 8 shows a diagram of Jeffrey Skilling’s email addresses and the people communicating with those addresses during the profiling period, visualised using GUESS (Adar, 2006). Detection of Abnormal Changes in Behaviour To detect abnormal changes in Jeffrey Skilling’s communication behaviour, the surveillance period selected for analysis was 1st February 2001 to 1st September 2001, which was the period of time when Jeffrey Skilling became CEO of Enron in Feburary 2001 and also resigned as CEO in August 2001. A diagram of Jeffrey Skilling’s e mail addresses and his associates during the surveillance period is shown in Figure 9. The anomaly detection module detected, using standard threshold anomaly detection techniques, a series of alerts for some of the nine communication behaviour metrics and also detected the appearance of new associate email addresses, shown in Table 2. This table shows what alerts were generated when the changes in behaviour were analysed separately for each of the communication behaviour metrics. Using the same surveillance period, the fuzzy inference anomaly detection technique was used to analyse Jeffrey Skilling’s email traffic data and the alerts generated from this are shown in Table 3. The results in Table 3 shows how the alerts are presented to the user when the measurements from all of the communication behaviour metrics are combined, to produce an abnormality rating for each of the suspects’ communication links. Each of the results is sorted in descending order according to the abnormality rating. The alert results shown in Table 3, show that when the interaction between
[email protected] and
[email protected] was investigated, they had an abnormality rating of 0.092071181977. This uncovered not much change in behaviour during the surveillance period. The time series visualisation provided by TimeSearcher 2 (Aris et al., 2005) in Figure 10, confirms that there was not much deviation in communication between Jeffrey Skilling and Rosalee Fleming, despite the spike in email traffic that was outside of the profiling and surveillance period. An analysis of the interaction between
[email protected] and
[email protected], which had an abnormality rating of 0.5, uncovered a reasonable change in communication behaviour during the surveillance period. Figure 11 shows increase in email traffic activity from Steven Kean to Jeffrey Skilling, suggesting there might have been a change in relationship during the surveillance period. According to the organisational role spreadsheet provided by Shetty and Adibi (2005), Steven Kean was actually the Vice President and Chief of Staff at Enron, which might have explained why he had more communication with Jeffrey Skilling after he became CEO in February 2001.
Figure 8: Jeffrey Skilling’s circle of associates from 1st January 1999 to 1st August 2000 (17 months), with his e mail addresses highlighted in orange.
Figure 9: Jeffrey Skilling’s circle of associates from 1st February 2001 to 1st September 2001 (7 months). Table 2: Listing of alerts generated using the standard threshold anomaly detection technique for the anomaly detection module (note: individual communication link details aren’t shown in the table). Email Account '
[email protected]'
'
[email protected]'
Types of Alert Number of Alerts Generated AppearanceNewContacts – 763; CombinedSpeedOfReplies – 5; SendingDelaysFromContacts – 17; SendingDelaysToContacts – 502; SpeedOfRepliesFromContacts – 3; SpeedOfRepliesToContacts – 4; WeeklyConsistEmailsReceived – 2; WeeklyConsistEmailsSent – 8; WeeklyPercentEmailsReceived – 3; NO ALERTS
'
[email protected]'
AppearanceNewContacts – 2; SendingDelaysFromContacts – 1; WeeklyConsistEmailsReceived – 4;
'
[email protected]’
NO ALERTS
'
[email protected]'
AppearanceNewContacts – 1; WeeklyConsistEmailsReceived – 1;
'
[email protected]'
AppearanceNewContacts – 6; WeeklyConsistEmailsReceived – 8;
'
[email protected]’
AppearanceNewContacts – 1; WeeklyConsistEmailsReceived – 1;
'
[email protected]'
AppearanceNewContacts – 4; SendingDelaysFromContacts – 1; WeeklyConsistEmailsReceived – 3;
'
[email protected]'
AppearanceNewContacts – 21; SendingDelaysFromContacts – 1; WeeklyConsistEmailsReceived – 1; WeeklyPercentEmailsReceived 1
'
[email protected]'
AppearanceNewContacts – 1; WeeklyConsistEmailsReceived – 1;
'
[email protected]'
AppearanceNewContacts – 1; WeeklyConsistEmailsReceived – 1;
'
[email protected]'
AppearanceNewContacts – 3; SendingDelaysFromContacts – 1; WeeklyConsistEmailsReceived – 3;
'
[email protected]'
AppearanceNewContacts – 3; WeeklyConsistEmailsReceived – 2; WeeklyConsistEmailsSent – 1;
'
[email protected]'
AppearanceNewContacts – 1; SendingDelaysFromContacts – 1; WeeklyConsistEmailsReceived – 1;
'
[email protected]'
AppearanceNewContacts – 1; WeeklyConsistEmailsReceived – 1;
Table 3: Listing of rated alerts generated using fuzzy inference for the anomaly detection module. Email Account
Associate Email Address
Abnormality Rating
[email protected]
[email protected]
0.5
[email protected]
[email protected]
0.5
[email protected]
[email protected]
0.3
[email protected]
[email protected]
0.3
[email protected]
[email protected]
0.3
[email protected]
[email protected]
0.3
[email protected]
[email protected]
0.3
[email protected]
[email protected]
0.113355289747
[email protected]
[email protected]
0.092071181977
[email protected]
[email protected]
0.091424688331
[email protected]
[email protected]
0.091424688331
[514 more email addresses...]
[514 more email addresses...]
[514 more abnormality ratings of 0.091424688331 or less...]
Figure 10: The weekly time series email traffic of Jeffrey Skilling and Rosalee Fleming, focusing on the surveillance period from 1st February 2001 (week 108) to 1st September 2001 (week 138).
Figure 11: The weekly time series email traffic of Jeffrey Skilling and Steven Kean, focusing on the surveillance period from 1st February 2001 (week 108) to 1st September 2001 (week 138).
DISCUSSION The case study shows that fusing together different communication behaviour measurements with fuzzy inference and presenting the results as abnormality rankings, helps to summarise the degree of overall changes in communication behaviour for suspect email accounts. In addition, the fuzzy inference results also helped to prioritise which email communication links were exhibiting the most abnormal changes in behaviour. The use of visualisation in Figures 10 and 11 helped to verify these abnormal changes in communication behaviour. The case study showed that fuzzy inference makes it easier to interpret the email traffic anomaly detection results, in comparison to presenting individual types of anomaly detection results separately. Although fuzzy inference helps to summarise the email traffic anomaly detection results, one of the drawbacks with using fuzzy inference is that a fuzzy inference system is complex to design, and it takes a great deal of effort to build and finetune its performance. It is often said that: “improving the system becomes rather an art than engineering” (Negnevitsky, 2004), meaning that it often takes some trial & error and experience to determine if the system is performing the way it is expected. Another drawback with our use of fuzzy inference was that the design of the fuzzy rules and fuzzy sets were manually constructed, based on one of the author’s current empirical knowledge of email traffic. However, there are ways of automating some of the design process when developing fuzzy inference systems. An example of this is where (Dickerson et al., 2001) used a fuzzy C means algorithm (Bezdek, 1981) to automate the part of the process of designing the fuzzy sets for their network intrusion detection system. Since this work is research in progress, one of the things to note for further work is that the fuzzy inference hierarchy shown in Figure 6 illustrates only one of the possible groupings for combining the inputs for fuzzy inference. This may not necessarily be the best possible grouping, so other input combinations will need to be tested to see if they affect the results given by the fuzzy inference hierarchy. Other issues that will need to be considered in our further work is the duration of time required to profile and observe the suspect’s change in behaviour, and whether or not the suspect’s behaviour should be updated periodically since it may change gradually over time?
CONCLUSION We have shown how using fuzzy inference techniques may make the email traffic anomaly detection results easier for the user/analyst to interpret, through ranking the degree of abnormality for different communication links between the suspect and their associates. Most approaches shown by other researchers, focus on presenting the user a whole selection of information on different communication behaviour measures, but do not provide a ranking for the user/analyst to decide which email addresses or communication links receives higher priority in the investigation of anomalous behaviour. The advantage of fusing together information from different communication behaviour measures to perform email traffic anomaly detection, and investigating a person’s traffic communication behaviour from the Enron email corpus was also shown. Future work will involve comparing the results from the analysis of our simulated email data and real email data, investigating the use of different input grouping combinations for the fuzzy inference hierarchy, and investigating different time durations for the profiling and surveillance of the email user’s traffic behaviour.
REFERENCES Adar, E. (2006), GUESS: A Language and Interface for Graph Exploration. CHI 2006: The SIGCHI Conference on Human Factors in Computing Systems, Montréal, Québec, Canada, April 22 27: 791800. Aris, A., Khella, A., Buono, P., Shneiderman, B. and Plaisant, C. (2005), TimeSearcher 2, HumanComputer Interaction Laboratory, Computer Science Department, University of Maryland, URL http://www.cs.umd.edu/hcil/timesearcher/, Accessed: 31st July, 2006. Bace, R. and Mell, P. (2001), NIST Special Publication 80031: Intrusion Detection Systems, National Institute of Standards and Technology (NIST), URL http://csrc.nist.gov/publications/nistpubs/80031/sp80031.pdf, Accessed: 26 February 2004. Bagnoli, C. and Smith, H.C. (1998) The Theory of Fuzzy Logic and Its Application to Real Estate Valuation. Journal of Real Estate Research, 16(2). Bezdek, J.C. (1981) Pattern Recognition with Fuzzy objective Function Algorithms, Plenum Press, New York. Chatfield, C. (1996) The Analysis of Time Series: An Introduction, 5th edn, Chapman and Hall, London. Cohen, W.W. (2004), The CMU Enron Email Dataset, URL http://www.cs.cmu.edu/~enron/, Accessed: 12 October 2006. Dickerson, J.E., Juslin, J., Koukousoula, O. and Dickerson, J.A. (2001) Fuzzy intrusion detection. Proceedings Joint 9th IFSA World Congress and 20th NAFIPS International Conference, 3: 15061510. Diesner, J., Frantz, T.L. and Carley, K.M. (2005) Communication Networks from the Enron Email Corpus “It's Always About the People. Enron is no Different”. Computational & Mathematical Organization Theory, 11(3): 201 228. Fiore, A. and Heer, J. (2005), UC Berkeley Enron Email Analysis, URL http://bailando.sims.berkeley.edu/enron_email.html, Accessed: 12 October 2006. Fox, L. (2003) Enron: The Rise and Fall, John Wiley & Sons, Hoboken, NJ. Fusaro, P.C. and Miller, R.M. (2002) What Went Wrong at Enron: Everyone's Guide to the Largest Bankruptcy in U.S. History, John Wiley & Sons, Hoboken, NJ. Gravetter, F.J. and Wallnau, L.B. (2004) Statistics for the Behavioral Sciences, 6th edn, Thomson/Wadsworth, Australia. Jiang, T., Kim, W., Lhee, K. and Hong, M. (2005), Email worm detection using the analysis of behavior, in Distributed Computing and Internet Technology, Proceedings, SpringerVerlag Berlin, Berlin, 3816: 348 356.
Lim, M.J., Negnevitsky, M. and Hartnett, J. (2005), Tracking and Monitoring Email Traffic Activities of Criminal and Terrorist Organisations Using Visualisation Tools. 6th Australian Information Warfare & Security Conference, Geelong, Victoria, Australia, 24th to 25th November 2005: 112 124. Lim, M.J.H., Negnevitsky, M. and Hartnett, J. (2006) Personality Trait Based Simulation Model of the Email System. International Journal of Network Security, 3(2): 164182. Mamdani, E.H. and Assilian, S. (1975) An experiment in linguistic synthesis with a fuzzy logic controller. International Journal of ManMachine Studies, 7(1): 113. Martin, S., Sewani, A., Nelson, B., Chen, K. and Joseph, A.D. (2005), Analyzing Behaviorial Features for Email Classification. Second Conference on Email and AntiSpam (CEAS 2005), Stanford University, Palo Alto, CA, July 2122. Mathworks (2006), MATLAB Fuzzy Toolbox, URL http://www.mathworks.com, Accessed: 12 October 2006. Mohay, G.M. (2003) Computer and Intrusion Forensics, Artech House, Boston. Natta, D.V., Sciolino, E. and Grey, S. (2006), Details Emerge in British Terror Case, New York Times, URL http://www.nytimes.com/2006/08/28/world/europe/28plot.html?ex=1160712000&en=2582c7f1e971edd7 &ei=5070, Accessed: 12 October 2006. Negnevitsky, M. (2004) Artificial Intelligence: A Guide to Intelligent Systems, 2nd edn, Addison Wesley, Essex. Salkind, N.J. (2004) Statistics for people who (think they) hate statistics, 2nd edn, Sage Publications, Thousand Oaks, CA. Shetty, J. and Adibi, J. (2005), The ISI Enron Database Schema and Brief Statistical Report, URL http://www.isi.edu/~adibi/Enron/Enron.htm, Accessed: 12 October 2006. Stolfo, S.J., Hershkop, S., Wang, K., Nimeskern, O. and Hu, C.W. (2003a), Behavior profiling of email, in Intelligence and Security Informatics, Proceedings, SpringerVerlag Berlin, Berlin, 2665: 7490. Stolfo, S.J., Hershkop, S., Wang, K., Nimeskern, O. and Hu, C.W. (2003b), A behaviorbased approach to securing email systems, in Computer Network Security, SpringerVerlag Berlin, Berlin, 2776: 5781. Tanenbaum, A.S. (2003) Computer Networks, 4th edn, Prentice Hall PTR, Upper Saddle River, NJ. Turban, E. and Aronson, J.E. (2001) Decision Support Systems and Intelligent Systems, 6th edn, Prentice Hall, Upper Saddle River, NJ. Whitney, C.R. and Strasser, S. (2004) The 9/11 Investigations : Staff Reports of the 9/11 Commission : Excerpts from the HouseSenate Joint Inquiry Report on 9/11 : Testimony from Fourteen Key Witnesses, Including Richard Clarke, George Tenet, and Condoleezza Rice, 1st edn, PublicAffairs, New York. Witten, I.H. and Frank, E. (2005) Data Mining: Practical Machine Learning Tools and Techniques, 2nd edn, Morgan Kaufmann, San Francisco, Calif. Zadeh, L. (1965) Fuzzy Sets. Information and Control, 8(3): 338353.
COPYRIGHT Mark JynHuey Lim, Michael Negnevitsky, and Jacky Hartnett ©2006. The author/s assign SCISSEC & Edith Cowan University a nonexclusive license to use this document for personal use provided that the article is used in full and this copyright statement is reproduced. The authors also grant a nonexclusive license to SCISSEC & ECU to publish this document in full in the Conference Proceedings. Such documents may be published on the World Wide Web, CDROM, in printed form, and on mirror sites on the World Wide Web. Any other usage is prohibited without the express permission of the authors