(PARR) and sum aggregation reasoning rule (SARR), the belongingness of each ... network (ANN), a decision tree, a Bayesian classifier, a set of fuzzy rules etc.
International Journal of Computer Applications (0975 – 8887) Volume 62– No.5, January 2013
A Fuzzy Classifier based on Product and Sum Aggregation Reasoning Rule U. V. Kulkarni, PhD. Professor, SGGS IOT, Nanded
ABSTRACT This paper proposes the algorithm ProSum to perform the supervised classification of the data. In the proposed algorithm data is fuzzified by using π–type membership function to give the feature belongingness of each pattern to each class. By using Product aggregation reasoning rule (PARR) and sum aggregation reasoning rule (SARR), the belongingness of each pattern to each class is determined. Finally by using defuzzification operation each pattern is assigned with the predicted class label. In this paper, proposed algorithm is applied to four dataset: IRIS, WINE, BUPA and PIMA. Accuracy of the results is measured by using the performance measures Misclassification (MC), Percentage of overall class Accuracy (PA) and Kappa Index of Agreement (KIA). The performance of ProSum is compared with C4.5 and PARR.
General Terms Data mining classification, fuzzy classification
Keywords Classification, Fuzzy logic, Aggregation operator, π-type membership function.
1. INTRODUCTION Classification is one of the most frequent decision making tasks performed by humans. A classification problem occurs when an object needs to be assigned to a predefined group or class based on the number of observed attributes related to that object [1]. Classification problems involve assigning a class Ci from a predefined class set C = { C1, C2 . . . , CM} to an object, described as a point in a certain feature space
x SN
. The problem of designing a classifier is to find a
mapping
D : S N C optimal
in the sense of a certain
criterion δ (D) that determines the classifier performance [2]. Usually, the final goal is to design a classifier that assigns class labels with the smallest possible error across the whole feature space. The classifier may be a Artificial neural network (ANN), a decision tree, a Bayesian classifier, a set of fuzzy rules etc. Neural Networks are a synchronous system that gives possibility to speed up the calculations [3]. Artificial Neural Networks are one of the most commonly used classifier technique. The reason for being commonly used is to present some properties such as learning from examples and exhibiting some capability for generalization beyond the training data [4]. Also they have universal approximation property [5]. Although they may achieve high accuracy of classification, the knowledge acquired by such systems is represented in a large number of numerical
S. V. Shinde Associate Professor, PCCOE, Pune
parameters and network architectures, in a way that is incomprehensible for humans [6]. This may cause problems in some cases. Also the classification using ANN cannot handle overlapping class classification problem. A decision tree is a predictive model that, as its name implies, can be viewed as a tree. Specifically each branch of the tree is a classification question and the leaves of the tree are partitions of the dataset with their classification. The approach of decision tree is used in many areas because it has many advantages [7,8,9]. A disadvantage of decision tree is its instability and the structure of the decision tree may be entirely different if some things change in the dataset. To overcome this problem, some scholars have suggested Fuzzy Decision Tree (e.g. FuzzyID3) [10, 11, 12, 13, 14] by utilizing the fuzzy set theory. To use Bayesian decision theory a priori probabilities and the conditional probability density of all classes should be known [15,16], Non- fuzzy classification systems are crisp in nature and cannot effectively applied for application with overlapping classes. FUZZY set and logic theory [17] is one of the most prominent tool to handle uncertainty in decisionmaking. The major advantages of fuzzy system models are their robustness and transparency. Fuzzy system modelling achieves robustness by using fuzzy sets which incorporates imprecision to system models. In addition, unlike some system models, such as neural networks, the fuzzy system models are highly descriptive. A summary of different fuzzy classifiers and their applications are described by Kuncheva [18]. When the classifier is a set of fuzzy rules, the resulting system is called a Fuzzy Rule-Based Classification System (FRBCS). FRBCS include a collection of if-then rules, stated using natural language. This is a form of knowledge representation that humans can easily understand, verify, and refine. Indeed, the true power of fuzzy logic lies in its ability to handle and manipulate linguistic information [19], [20], [21]. Two important aspects, namely learning and generalization capability play an important role in any pattern classification problem[22]. These can be achieved by using the feature wise belongingness of each pattern to each class. This is useful mainly when the classes are overlapping or illdefined. The feature wise belongingness can be calculated by using π-type MF. As stated in [22], the use of π-type MF enhances the classification accuracy and this expresses its better generalization capability. In [22] PARR is proposed and applied on two conventional (completely labelled) data sets and two remote sensing images (partially labelled) to justify its potentiality. Experimental results showed promising and improved classification performance on these mentioned data sets. Also It is observed that individually the PARR has a better classification capability compared to other RRs. This is because of the fact that the fuzzy product aggregation operator works better with features which collaborate with each other in decision making process. Also with the use of type MF
9
International Journal of Computer Applications (0975 – 8887) Volume 62– No.5, January 2013 instead of Gaussian MF the classification accuracy can be enhanced and this expresses its better generalization capability. The aim of this paper is to extend the usefulness of the fuzzy PARR to correct out the wrongly predicted class of a pattern where the classes are completely overlapped. For this new aggregation operator SARR and for using this operator the algorithm ProSum is proposed. The effectiveness of ProSum is demonstrated with the four completely labelled datasets.
with
c.) Defuzzification: The last step of the proposed classifier is a hard classification and is obtained through a MAX operation to defuzzify the output of the PARR and SARR. Here the pattern is classified to class c with the highest class membership value obtained through the PARR and if the higher class membership value obtained through PARR is same for the multiple classes then the highest class membership value obtained through SARR is used. Mathematically the expression for this operation is given as: if
1c C
else if
Sc X S j X j1,2,C
X [ x1 , x2. ...xD ]
a and
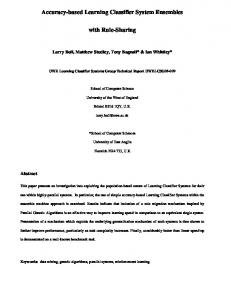
b Fig 1:
f d ,c xd П xd ; a, b, p, q . b.) Use the Sum aggregation reasoning rule (SARR) to aggregate the belongingness of each feature of individual pattern to the each class.
class
Membership Value
(2)
d 1
each
where D is the number of features and C is the number of classes. The advantage of using π–type MF is that it has a parameter, called fuzzifier (N), which can be tuned easily according to the requirement of the problem [22]. This provides more flexibility for classification and hence the generalization capability can be enhanced by selecting a proper value of N. The values of a, b, p and q used in (Eq. (1)) are as given in Fig. 1 [22].
(1)
D
Pc X f d ,c xd ,
against
c [C1 , C2 ,CC ]
Fuzzification: Fuzzify all input attribute values using π-type MF [23] to find the belongingness of each feature value of individual pattern to the each class.
Aggregation: For each pattern a.) Use the product aggregation reasoning rule (PARR) to aggregate the belongingness of all features of each pattern to the each class.
and j ≠ c
Fuzzification: In the first step π-type MF as given in (Eq. (1)) is used to fuzzify all the input feature values of each pattern
Output: Predicted class of input patterns.
2.
j≠c
Proposed algorithm given above works in three steps: fuzzification, aggregation and defuzzification. The description of each step of the algorithm is given below:
Input: A set of labelled data samples S.
0, x a N 2 N 1 x a , a x a b b a 2 N x b a b N 1 1 2 , x b 2 ba 1, b x p x; a, b, p, q . N x p p q N 1 1 2 ,px 2 q p N pq N 1 x q xq 2 , 2 q p 0, x q
and
then C = c _________________________________________________
Algorithm: ProSum(S) ___________________________________________
d 1, 2,......D, c 1, 2,.......C
max Pc ( X ) Pj X j1,2,C
then C = c
2. PROPOSED PRODUCT SUM AGGREGATION: ProSum CLASSIFICATION ALGORITHM ___________________________________________
with
f d ,c xd П xd ; a, b, p, q .
and
The organization of the article is as follows. Section 2 describes the proposed classification algorithm ProSum. Different performance measurement parameters are discussed in Section 3. Experimental results and discussions are given in Section 4. Finally, the concluding remarks are given in Section 5.
1.
d 1, 2,......D, c 1, 2,.......C
p Feature Value
q
-type membership function.
This function generates the membership matrix F(X) of size D×C for each pattern X as given:
D
Sc ( X ) f d ,c xd ,
(3)
d 1
10
International Journal of Computer Applications (0975 – 8887) Volume 62– No.5, January 2013
f1,1 x1 f1,2 x1 f x f 2,2 x2 F X 2,1 2 f D,1 xD f D,2 xD
f1,C x1 f 2,C x2 , f D,C xD
Xi+- total number of observations in row i X+i - total number of observations in column i N - total number of observations in the CM
4. EXPERIMENTAL RESULTS AND DISCUSSION
(4) th
where each value fi,j represents the belongingness of i feature to the jth class. Aggregation: Second step of the algorithm is the aggregation of the fuzzified values in the first step. Column i of F(X) in (Eq. (4)) represents the feature wise belongingness of the pattern X to the ith class where 1≤i≤C. These values in each column are aggregated using the PARR (as defined in (Eq. (2)) and then SARR (as defined in (Eq. (3)). After applying the PARR on the fuzzy matrix F(X), the output vector P’(X) is obtained as given by :
P ' X [ P1 X , P2 X ,.PC X ]T .
(5)
In this section the performance of the proposed ProSum algorithm is evaluated by using four well-known benchmark data sets used for classification. The performance of ProSum is compared with well known C4.5 decision tree algorithm [26] and PARR [22]. The data sets used are Iris Plants Dataset, Wine, BUPA liver disorders and Pima Indians Diabetes Indian Diabetes [27]. First the whole dataset is considered for experimentation. The parameters a, b, p and q used in pi-function are calculated by using the all the patterns in the dataset. Also experiment is conducted by dividing the dataset into training and test set. The training data of 20% and 40% and the rest 80% and 60% as a test data is considered. Selection of the training data is random and an equal percent of data is collected from each class. The Table 1 gives the description of these datasets:
And after applying the SARR on the fuzzy matrix F(X), the output vector S’(X) is obtained as given by:
S ' X [S1 X , S2 X ,.SC X ]T .
(6)
Defuzzification: In this step hard classification is obtained through fuzzy MAX operation, which defuzzifies the aggregated output in the second step. Here the pattern is classified to class c with the unique highest class membership value in P’(X). If there are multiple higher values in P’(X) then MAX operation is performed on S’(X) and pattern is classified to class c with highest membership value in S’(X).
Table 1. Dataset Description No. of features
No. of Classes
WINE
No. of Patterns 178
13
3
IRIS PLANTS
150
4
3
768
8
2
345
6
2
Dataset
PIMA INDIANS DIABETES BUPA LIVER DISORDERS
3. PERFORMANCE MEASURES
4.1 Iris Plants Dataset Classification
The measures used to analyze the performance of the proposed algorithm are Misclassification (MC), Percentage of overall class Accuracy (PA) and Kappa Index of Agreement (KIA) [24, 25]. The MC value denotes the number of wrongly classified patterns. The PA value shows the total percentage of correctly classified patterns. The MC and PA parameters are calculated with respect to the total number of patterns with the given class labels. They do not provide the overall agreement of accuracy based on class-wise accuracy. Thus, to get an overall class-wise agreement based on the individual class accuracy KIA is used. A good KIA value signifies better agreement of the estimated data with the true one. The KIA value is estimated from a confusion or error matrix (CM) [24, 25]. A CM is a square matrix that represents the number of patterns assigned to a particular class relative to the true class. This matrix produces many statistical measures of class accuracy including overall classification accuracy (the sum of the diagonal elements divided by the total number of samples) and KIA. KIA is defined as:
The Iris Plants Dataset plant dataset is applied to the experiment. The dataset is created by R.A. Fisher and perhaps it is the best-known database found in the pattern recognition literature. The dataset contains 3 classes of 50 instances each, where each class refers to a type of Iris Plants Dataset plant. There are in total 4 numerical attributes and no missing value in the dataset [27]. Details of the dataset are given in Table 1.
N i 1X ii i 1( X i . X i ) r
KIA
r
N 2 i 1( X i . X i ) r
,
where the confusion matrix(CM) has r = number of rows Xii - number of observations in row i and column i
(7)
Experimental results of C4.5 method, PARR and proposed ProSum applied on Iris Plants dataset are given in Table 2. First these methods are applied on the whole data set. The PA value of ProSum is 98.67 and the PA values for C4.5 and PARR are 98 and 86 respectively. MC values for ProSum is 2 and MC values for C4.5 and PARR are 3 and 2 respectively. From the PA values and MC values obtained on whole dataset it is observed that ProSum gives higher overall classification accuracy. To measure the class wise classification accuracy the values of KIA for C4.5, PARR and for ProSum are 0.97, 0.79 and 0.98 respectively. ProSum has given the higher KIA values. After applying C4.5, PARR and ProSum on whole dataset, these are applied on 20% and 40% as training data and 80% and 60% as a test data. When applied on 20% as a training data and 80% as a testing data, the PA values for C4.5, PARR and ProSum are 93.33, 81.67 and 94.16 respectively. The MC values for C4.5, PARR and ProSum are 08, 22 and 07 respectively. When applied on 40% as a training data and 60% as a testing data, the PA values for C4.5, PARR and ProSum are 92.22, 90 and 96.67 respectively. The MC values for C4.5, PARR and ProSum are
11
International Journal of Computer Applications (0975 – 8887) Volume 62– No.5, January 2013 07, 09 and 03 respectively. This analysis shows that ProSum gives the better overall classification results than PARR and comparable results than C4.5. The KIA values of ProSum for 20% and 40% training data are 0.91, 0.95 respectively and that for C4.5 and RR are 0.90, 0.88 and 0.72, 0.85 respectively. So in addition to overall classification results the values of KIA for ProSum are better than the other two methods. It means ProSum gives the good class wise classification accuracy.
4.2 Wine Dataset Classification The Wine dataset is created by Forina. The dataset contains 3 classes where each of 59, 71 and 48 instances, where each class refers to a type wine based on alcohol contents. There are in total 13 continuous attributes and no missing value in the dataset [27]. Details of the dataset are given in Table 1. Experimental results of C4.5 method, PARR and proposed ProSum applied on Wine dataset are given in Table 3. First these methods are applied on the whole data set. The
PA value of ProSum is 93.26 and the PA values for C4.5 and PARR are 98.87 and 76.26 respectively. MC values for ProSum is 12 and MC values for C4.5 and PARR are 2 and 41 respectively. From the PA values and MC values obtained on whole dataset it is observed that ProSum gives higher overall classification accuracy as compared to PARR and 5.61 decrease in accuracy as compared to C4.5. To measure the class wise classification accuracy the values of KIA for C4.5, PARR and for ProSum are 0.98, 0.65 and 0.90 respectively. ProSum has given the higher KIA values as compared to PARR and 0.08 decrease as compared to C4.5. After applying C4.5, PARR and ProSum on whole dataset, these methods are applied on 20% and 40% as training data and 80% and 60% as a test data. When applied on 20% as a training data and 80% as a testing data, the PA values for C4.5, PARR and ProSum are 77.46, 28.08 and 60.11 respectively. The MC values for C4.5, PARR and ProSum are 32, 92 and 35 respectively. When applied on 40% as a training data and 60% as a testing data, the PA values for C4.5, PARR and ProSum are 77.45, 56 and 89.21 respectively. The MC values for C4.5, PARR and
Table 2. Iris Plants Dataset Results Method
20%
40%
All
MC
PA
KIA
MC
PA
KIA
MC
PA
KIA
C4.5
08
93.33
0.90
07
92.22
0.88
03
98
0.97
PARR
22
81.67
0.72
09
90
0.85
21
86
0.79
ProSum
07
94.16
0.91
03
96.67
0.95
02
98.67
0.98
Table 3. Wine Dataset Results Method
20%
40%
All
MC
PA
KIA
MC
PA
KIA
MC
PA
KIA
C4.5
32
77.46
0.66
23
77.45
0.64
02
98.87
0.98
PARR
92
28.08
.0011
44
56
.42
41
76.96
0.65
ProSum
35
60.11
0.61
11
89.21
0.83
12
93.26
0.90
Table 4. Bupa Liver Disorders Dataset Results Method
20%
40%
All
MC
PA
KIA
MC
PA
KIA
MC
PA
KIA
C4.5
134
51.27
-0.03
97
52.68
-0.10
122
64.63
0.34
PARR
151
45.09
0.05
103
49.75
-0.12
130
62.32
0.30
ProSum
131
52.36
0.12
98
52.19
-0.10
129
62.61
0.31
Table 5. Pima Indians Diabetes Dataset Results 20%
40%
All
Method MC
PA
KIA
MC
PA
KIA
MC
PA
KIA
C4.5
161
73.78
0.3352
119
74.13
0.401
122
84.11
0.6319
PARR
219
64.33
-0.0077
154
66.52
0.0762
263
65.75
0.0759
ProSum
204
66.78
-0.0080
161
65
0.0850
266
65.36
0.0989 12
International Journal of Computer Applications (0975 – 8887) Volume 62– No.5, January 2013 ProSum are 23, 44 and 11 respectively. This analysis shows that ProSum gives the better overall classification results than PARR and comparable results than C4.5. The KIA values of ProSum for 20% and 40% training data are 0.61, 0.83 respectively and that for C4.5 and PARR are 0.66, 0.64 and 0.0011, 0.42 respectively. So In addition to overall classification results the values of KIA for ProSum are better than the PARR and comparable to C4.5. It means ProSum gives the good class wise classification accura Table 6: Iris Plants Dataset Results
4.3 Bupa Liver Disorders Dataset Classification Bupa liver disorders dataset is created by Richard S. Forsyth. The dataset contains 2 classes of 145 and 200 samples each, where each class refers to the sensitivity of the disease either positive or negative. There are in total 7 numerical attributes and no missing value in the dataset [27]. Details of the dataset are given in Table 1. Experimental results of C4.5 method, PARR and proposed ProSum applied on Bupa Liver Disorders dataset are given in Table 4. First these methods are applied on the whole data set. The PA value of ProSum is 62.61 and the PA values for C4.5 and PARR are 64.63 and 62.32 respectively. MC values for ProSum is 129 and MC values for C4.5 and PARR are 122 and 130 respectively. To measure the class wise classification accuracy the values of KIA for C4.5, PARR and for ProSum are 0.34, 0.30 and 0.31 respectively. From the PA values and MC values obtained on whole dataset it is observed that ProSum gives nearly equal performance like PARR and slightly lesser than C4.5. After applying C4.5, PARR and ProSum on whole dataset, these are applied on 20% and 40% as training data and 80% and 60% as a test data. When applied on 20% as a training data and 80% as a test data, the PA values for C4.5, PARR and ProSum are 51.27, 45.09 and 52.36 respectively. The MC values for C4.5, PARR and ProSum are 134, 151 and 131 respectively. When applied on 40% as a training data and 60% as a testing data, the PA values for C4.5, PARR and ProSum are 52.68, 49.75 and 52.19 respectively. The MC values for C4.5, PARR and ProSum are 97, 103 and 98 respectively. This analysis shows that ProSum gives the better overall classification results than PARR and similar results like C4.5. The KIA values of ProSum for 20% and 40% training data are 0.12, -0.10 respectively and that for C4.5 and PARR are -0.03, -0.10 and 0.05, -0.12 respectively. So In addition to overall classification results the values of KIA for ProSum are better than the other two methods. It means ProSum gives the good class wise classification accuracy.
data, 20% data and 40% data is 84.11 & 65.75, 73.78 & 64.33 and 74.13 & 66.52 respectively. MC values for ProSum for whole data, 20% data and 40% data are 266, 204 and 161 respectively. MC values for C4.5 for whole data, 20% data and 40% data are 122, 161 and 119 respectively. MC values for PARR for whole data, 20% data and 40% data 263, 219 and 154 respectively. For the Pima Indians Diabetes dataset the accuracy of PARR is higher than the ProSum because of the unbalanced class distribution of samples. In Pima Indian Diabetes dataset total numbers of class 1 samples are 500 and class 2 samples are 268. In PARR when class belongingness of the pattern for both the classes is same then pattern is blindly classified to class 1.
5. CONCLUSION This paper proposes the extension to the PARR method used for data mining classification with overlapping classes. After analysing the results given by PARR, it is found that (i) patterns are incorrectly classified where the pattern belongingness value for multiple classes is same (when the patterns are completely overlapping) or (ii) The value of the pattern belongingness to a class is zero if any of the feature belongingness value of that pattern is zero as the product of all feature belongingness is taken to predict the class. So to correct these two problems, the algorithm ProSum is proposed. This algorithm applies PARR to all the training samples followed by the proposed SARR to only those samples for which either of (i) or (ii) is true. So, the combination of PARR followed by SARR worked well and gives the greater accuracy and improved KIA values as compared to either PARR or SARR alone.
REFERENCES [1]
Lin, C, Chung, I., and Chen, C. 2007. An entropy-based quantum neuro-fuzzy inference system for classification applications, Neurocomputing 70 2502–2516.
[2]
Cordon, O., Jesus, M., and Herrera, F. 1999. A proposal on reasoning methods in fuzzy rule-based classification systems, International Journal of Approximate Reasoning 20 21-45.
[3]
Zak, A. 2007. Neural Model of Underwater Vehicle Dynamics, International Journal of Mathematics and Computers in Simulation 1(2) 189-195.
[4]
Mukhopadhyay, S., Tang, C., Huang, J., Yu, M., and Palakal, M. 2002. A comparative study of genetic sequence classification algorithms, Proceedings of the 2002 12th IEEE Workshop on Neural Networks for Signal Processing 57 – 66.
[5]
Setiono, R., Baesens, B, and Mues, C. 2008. Recursive Neural Network Rule Extraction for Data With Mixed Attributes, IEEE Trans. Neural Networks, 19(2) 299-307.
Pima Indian Diabetes dataset is created by Vincent Sigillito. The dataset contains 2 classes of 500 and 268 instances each, where each class refers to the sensitivity of the disease either positive or negative. There are in total 8 numerical attributes and with some missing values in the dataset [27]. Details of the dataset are given in Table 1.
[6]
Duch, W., Adamczak, R., and Grabczwski, K. 2001. A new methodology of extraction, optimization and application of crisp and fuzzy logical rules, IEEE Trans. Neural Networks 12(2) 277-306.
[7]
Decision Tree. Wikipedia, the free encyclopaedia 2005: htttp://en.wikipedia.org/wiki/Decision_tree.
Experimental results of C4.5, PARR and proposed ProSum method applied on Pima Indian Diabetes dataset are given in Table 5. The PA values of ProSum when applied for whole data, 20% data and 40% data is 65.36, 66.78 and 65. The PA values of C4.5 and PARR when applied for whole
[8]
The Federal Budget Execution Process Decision Tree 2005: http://www.knownet.hhs.gov.
[9]
Data Mining for Profit, Rosella Data mining & Database Analytics 2005 http://www.roselladb.com/.
4.4 Pima Indians Diabetes Dataset Classification
13
International Journal of Computer Applications (0975 – 8887) Volume 62– No.5, January 2013 [10]
[19]
Bdrdossy, A., Duckstein, L. 1995. Fuzzy rule-based modeling with applications to geophysical, biological and engineering systems, CRC Press, Boca Raton.
[20]
Bezdek, J.C., Pal, S. K. (Eds.) 1992. Fuzzy Models for Pattern Recognition, Methods that Search for Structures in Data, IEEE Press, New York.
[21]
Wang, X.- Z., Yeung, D. S., and Tsang, E.C.C. 2001. A Comparative Study on Heuristic Algorithms for Generating Fuzzy Decision Trees, IEEE Trans. Systems, Man, and Cybernetics 31(2) 215-226.
Chi, Z., Yan, H., and Pham, T. 1996. Fuzzy algorithms with applications to image processing and pattern recognition, World Scientific, Singapore.
[22]
Ghosh, A., Meher, S. K., Shankar B. U. 2008. A novel fuzzy classifier based on product aggregation operator, Pattern Recognition 41(3) 961-971.
[13]
Janikow, C.Z. 1998. Fuzzy decision trees: issues and methods, IEEE Trans. Systems, Man, and Cybernetics Part B 28(1) 1-14.
[23]
Fuzzy Logical Toolbox: pimf. Matlab Help 1984-2004. The Math Works, Inc.
[14]
Peng, Y., Flach, P. A. 2001. Soft Discretization to Enhance the Continuous Decision Tree Induction, Integrating Aspects of Data Mining, Decision Support and Metalearning 109-118.
[24]
Card, D. H. 1982. Using known map category marginal frequencies to improve estimates of thematic map accuracy. Photogrammetric Engineering and Remote Sensing, 48(3) 431-439.
[15]
Duda, R.O., Hart, P.E., Stork, D.G. 2001. Pattern Classification, second ed., Wiley.
[25]
Congalton, R. G. 1991. A review of assessing the accuracy of classifications of remotely sensed data, Remote Sensing of Environment 37(1), 35-46.
[16]
Tou, J.T., Gonzalez, R.C. 1974. Pattern Recognition Principles, Addition-Wesley, MA.
[26]
Quinlan, J. R. 1993, C4.5: Programs for Machine Learning, Morgan Kaufmann, San Mateo.
[17]
Zadeh, L. A. 1965. Fuzzy sets, Inform. Control (8) 338– 353.
[27]
[18]
Kuncheva, L.I. 2000. Fuzzy Classifier Design, Springer, Berlin.
UCI repository of machine learning databases, Department of Information and Computer Sciences, University of California, Irvine 1998. http://www.ics.uci.edu/∼mlearn/MLRepository.htm.
[11]
[12]
Umano, M., Okamoto, H., Hatono, I., Tamura, H., Kawachi, F., Umedzu, S., and Kinoshita, J. 1994. Fuzzy Decision Trees by Fuzzy ID3 algorithm and its Application to Diagnosis Systems, 3rd IEEE conf on Fuzzy Systems 3 2113-2118. Chang, R. L., Pavlidis, T. 1977. Fuzzy decision tree algorithms. IEEE Transactions on Systems, Man, and Cybernetics 7(1) 28-35.
14