Lazim A. and Wahab N. mrp.ase.ro
A FUZZY DECISION MAKING APPROACH IN EVALUATING FERRY SERVICE QUALITY MANAGEMENT RESEARCH AND PRACTICE Vol. 2 Issue 1 (2010) p: 94-107
A FUZZY DECISION MAKING APPROACH IN EVALUATING FERRY SERVICE QUALITY Abdullah LAZIM1, Nurhanadia WAHAB2 1Department
Volume 2, Issue 1 / March 2010
Management Research and Practice
of Mathematics, Faculty of Science and Technology, University of Malaysia Terengganu, 21030 Kuala Terengganu, Malaysia,
[email protected] 2Department of Mathematics, Faculty of Science and Technology, University of Malaysia Terengganu, 21030 Kuala Terengganu, Malaysia,
[email protected]
Abstract The service quality evaluation is undeniably important especially in highly competitive service related industry. However, service quality evaluation is not always straightforward as criteria in evaluation and customer perceptions toward services are intangible measures. This paper presents a fuzzy multi-criteria decision making approach for evaluating the service quality of ferry that transport customers between the mainland of Peninsular Malaysia and a tourist spot island. Service quality is a composite of various criteria, among them many criteria are intangible and difficult to measure. Fuzzy numbers and linguistic level based on fuzzy sets theory as a method to overcome vaguely judgment in evaluation. The crisp survey results were collected via a ten-service criteria questionnaire from eighty seven customers and computed using Best non-Fuzzy Performance and Degree of Similarity. Based on the concept of the defuzzification, the ranking of service performance is obtained. Degree of Similarity provides the level of satisfaction and its degrees for each criterion. The criterion of ‘service efficiency of ferry personnel’ was the first in the ranking. All the criteria received ‘good’ and ‘very good’ for the level of satisfaction. These evaluation results facilitate the ferry operator to upgrade its ferry services and eventually meet its customers’ needs.
Keywords: Service quality, fuzzy number, satisfaction level, defuzzification.
1. INTRODUCTION Tourism industry in Malaysia has been identified as one of the sectors that can boost economic growth. The Malaysian government recognized the tourism industry had the potential to expand and become one of the main resources contributing to the national revenues. In the Ninth Malaysian Plan Document, Economic Planning Unit (2006) maintains that during this development period, concerted efforts will be geared towards realizing the full potential of the tourism industry in order to enhance its contribution to the service sector in particular, and the economy in general. There have been numerous measures taken by the government to promote tourism. Develop a new tourism destination with high quality infrastructure is one of them. In 1984, the first announcement was made by the government that Langkawi Island was to be developed as a major tourist centre of the country and will continue to be promoted internationally as the latest tourism product. More efforts have been undertaken to mobilize infrastructures and facilities as well as develop tourism related services. In 1996, the government has appointed a company to ferry customers to Langkawi from Kuala Kedah, Kuala Perlis, Penang, Puala Payar Marine Park and Satun (Thailand) as one of the measures to
eISSN 2067- 2462
94
Lazim A. and Wahab N. mrp.ase.ro
A FUZZY DECISION MAKING APPROACH IN EVALUATING FERRY SERVICE QUALITY MANAGEMENT RESEARCH AND PRACTICE Vol. 2 Issue 1 (2010) p: 94-107
develop the island as tourism spot. This company is expected to ensure fast, efficient, safe and comfortable ferry service to customers at all times. Ferry service quality indeed plays an enormous impact to the development of Langkawi Island as one of the prime tourism destinations in Malaysia. In other words, service quality is a very important component in sustaining the flowing of tourist and eventually making tourism industry remains strong. In recent years, service quality has become one of the most important issues in tourism management, transport management and marketing literature (Akbaba, 2006; Hensher, et. al. 2003; Rendeiro, 2006; Mei et al. 1999)
and is considered a vital element for service industries in management strategies in order to
1990). Many researches have shown that service quality is an essential strategy for winning and retaining
Volume 2, Issue 1 / March 2010
Management Research and Practice
succeed in competitive environments (Goodale et al. 1997; Prioni and Hensher, 2000; Reichheld and Sasser, customers (Ghobadian et. al, 1994; Zeithaml, 2000). One of the mechanisms to gauge service quality is through proper evaluation process. Thus, the evaluation of ferry service can be used by decision makers as a tool to benchmark the quality. Decision makers will appreciate the availability of such tool which enables them to monitor the offered quality, as perceived from the point of view of their customers, and call attention to the specific areas which require improvement. The evaluation of service quality in the ferry service is an on going process that requires continuous monitoring to maintain high levels of service quality across a number different service area and criteria. There are many criteria used for service quality evaluation. Criteria that include tangibility, reliability, responsiveness, assurance and empathy proposed by Parasuraman et al. (1985a; 1985b) are being considered as the representative of criteria in service quality of transportation industries. In airlines transportation industries for example, Chang and Yeh (2002) specifically proposed the criteria in evaluation are on-board comfort, airlines employees, reliability of service, and convenience of service and also handling of abnormal condition. A composition of all these criteria becomes an indicator in service quality. In other words, service quality can be regarded as a composite of various criteria. It not only consists of tangible criteria or physical appearance criteria, but also intangible or subjective criteria such as safety, comfort, which are difficult to measure accurately. The ferry service evaluation takes into account all these criteria based on perceptions and attitude of customers. The mainstream research on service quality has been conducted based on the belief that quality of service is perceived and evaluated by customers (Gronroos, 1990). Different individual or customer usually has wide range of perceptions and attitude toward quality service. Attitude can be regarded as an overall evaluation of a service perceive by customers based on their likes and dislikes (Bolton and Drew, 1991; Engel et al.,1995). Thus evaluation of service quality is depending on customers’ preference structures and attitude. To measure service quality, conventional measurement tools are devised on cardinal or ordinal scales. To explore the eISSN 2067- 2462
95
Lazim A. and Wahab N. mrp.ase.ro
A FUZZY DECISION MAKING APPROACH IN EVALUATING FERRY SERVICE QUALITY MANAGEMENT RESEARCH AND PRACTICE Vol. 2 Issue 1 (2010) p: 94-107
past related research document, most of the methods for evaluating transportation service quality employs statistical measures method. A 5-point of Likert scales instrument is the major means to evaluate service quality in the past. For example Bai and Yee (2005) investigated public service companies using statistical analyses of reliability and validity in service quality evaluation model. They employed a questionnaires adopt 7-point Likert scale with 1 indicates very unsatisfied to 7 indicates very satisfied and analysed the scale using Cronbach alpha realibility test. Most of the criticism about scale based on measurement is that scores do not necessarily represent user preference. This is because respondents have to internally convert preference to scores and the conversion may introduce misrepresentation of the preference being captured. In view of the fact that customer service evaluation depends largely on what customers perceived, perhaps
Volume 2, Issue 1 / March 2010
Management Research and Practice
linguistics judgement is a good option in avoiding such inconvenience. Since service industry contains vague elements such as intangibility, inseparability and heterogeneity, it makes peoples more difficult to measure service quality. Lingual expressions, for example, satisfied, fair, dissatisfied, are regarded as the natural representation of the preference or judgement. These characteristics indicate the applicability of fuzzy set theory in capturing the decision makers’ preference structure fuzzy set theory aids in measuring the ambiguity of concepts that are associated with human being's subjective judgment. Since the evaluation is resulted from the different evaluator's view of linguistic variables, its evaluation must therefore be conducted in an uncertain, fuzzy environment. Nowadays, the fuzzy set theory has been applied to the field of management science, like decision making (Viswanathan, 1999; Xia et. al, 2000;) and airline service (Tsaur, et. al. 2001; Chang and Yeh, 2002). However, it is hardly used in the field of ferry service quality. Therefore, this study includes fuzzy multiple criteria decision making (MCDM) approach to strengthen the comprehensiveness and reasonableness of the decision-making process. Based on these premises, the purpose of this paper is to measure the quality of a ferry service from customer perceptions using a fuzzy decision making approach. Specifically, the objectives are to rank the performance of the ferry service criteria using a defuzification method and to measure satisfaction levels of the service using a fuzzy similarity approach.
2. FUZZY MCDM ANALYSIS APPROACH Since fuzzy set theory proposed by Zadeh (1965), and Bellman and Zadeh (1970) described the decision making method in fuzzy environments, an increasing number of studies have dealt with uncertain fuzzy problems by applying fuzzy set theory. Based on such initiatives, this study applies fuzzy decision making theory, considering the possible fuzzy subjective judgment of the evaluators during ferry service quality evaluation. This method for establishing ferry service quality can be made more objective. Data to evaluate the service quality of a ferry are based on customer perceptions. The applications of fuzzy MCDM in this study are elaborated as follows. eISSN 2067- 2462
96
Lazim A. and Wahab N. mrp.ase.ro
A FUZZY DECISION MAKING APPROACH IN EVALUATING FERRY SERVICE QUALITY MANAGEMENT RESEARCH AND PRACTICE Vol. 2 Issue 1 (2010) p: 94-107
The service quality evaluation procedures are divided into two subsections. The first subsection describes the steps in obtaining performance for each criterion while the second subsection elucidates the steps in obtaining level and degree of satisfaction. 2.1. Performance Criteria Measurement of performance especially in service quality has been conducted with the objective of getting a ranking order of criteria. Tsaur et al. (2001) applied Analytic Hierarchy Process in obtaining criteria weight and Technique for Order Preference by Similarity to Ideal Solution to achieve the final ranking results in evaluation of airline service quality. Chang and Yeh, (2002), employed fuzzy multi-criteria analysis model to
Volume 2, Issue 1 / March 2010
Management Research and Practice
formulate the evaluation of service quality for domestic airlines. The model is solved by an effective algorithm which incorporates the decision maker's attitude or preference for customers' assessments on criteria weights and performance ratings. With a very much straight forward approach, the present study utilized the supremacy of triangular fuzzy number and defuzzification to obtain ranking of performance criteria. The following steps are proposed to obtain ranking of performance criteria. Step 1: Setting a triangular fuzzy number, A based on responses from questionnaire Fuzzy numbers are a fuzzy subset of real numbers, and they represent the expansion of the idea of confidence interval. According to the definition made by Dubois and Prade (1978) those numbers that can satisfy these three requirements will then be called fuzzy numbers, and the following is the explanation for the features and calculation of the triangular fuzzy number. In this paper, a triangular fuzzy numbers A are parameterized by a triplet (a1 , a2 , a3 ) . The membership function µ A (x ) is defined below.
x − a1 a − a 1 2 x − a3 µ A ( x) = a 2 − a3 0
, a1 ≤ x ≤ a 2 , a1 ≤ x ≤ a 2 , otherwise
Each linguistic term was characterized by a triangular fuzzy number for representing its approximate value range between 0 and 2.5, and donated as (a1 , a2 , a3 ) , where 0 ≤ a1 ≤ a 2 ≤ a 3 ≤ 2.5 . Value of a 2 is the most likely value of the linguistic term, and a1 and a3 are the lower and upper bound used, respectively, to reflect the fuzziness of the term. The set of fuzzy number for the linguistic terms are defined and presented in Table 1. eISSN 2067- 2462
97
Lazim A. and Wahab N. mrp.ase.ro
A FUZZY DECISION MAKING APPROACH IN EVALUATING FERRY SERVICE QUALITY MANAGEMENT RESEARCH AND PRACTICE Vol. 2 Issue 1 (2010) p: 94-107
TABLE 1 - TRIANGULAR FUZZY NUMBERS (TFN) Linguistic terms Symbols TFN Very Poor VP (0.00, 0.00, 0.75) Poor P (0.00,0.75, 1.25) Fair F (0.75,1.25, 1.75) Good G (1.25,1.75, 2.50) Very Good VG (2.25, 2.50, 2.50)
Step 2: Compute overall evaluation of the fuzzy judgement The overall evaluation of the fuzzy judgement copes with the fact that every evaluator perceives differently toward every criterion. The subsequent valuation of the linguistic variable certainly varies among individuals.
Volume 2, Issue 1 / March 2010
Management Research and Practice
The overall fuzzy judgement can be integrated by the equation Aij=(1/m) (Aij1 Aij2, where
,
Aijm)
(1)
is the multiplication of fuzzy numbers,
is the add operation of fuzzy numbers, Aij the overall
average performance valuation of ferry i under criterion j over m assessors. Step 3: Obtain end point of fuzzy numbers, Aij Aij as a fuzzy number can be represented by triangular membership function as the equation Aij=(LAij, MAij, UAij)
(2)
where LAij , UAij are the ends points of fuzzy numbers and MAij is the middle point of fuzzy numbers. Step 4: Defuzzification To justify whether a ferry service criteria is at the level of ‘good’ or ‘poor’, defuzzification of the information is needed. The result of fuzzy synthetic decision of each alternative is a fuzzy number. Therefore, it is necessary that the nonfuzzy ranking method for fuzzy numbers be employed during service quality comparison for each alternative. In other words, Defuzzification is a technique to convert the fuzzy number into crisp real numbers, the procedure of defuzzification is to locate the Best Nonfuzzy Performance (BNP) value. In other words, defuzzification is a technique to convert the fuzzy number into crisp real numbers. The procedure of defuzzification is locating the Best Nonfuzzy Performance (BNP) value. In this paper, the formula to get the Best Nonfuzzy Performance that is define as BNPij=[(UAij−LAij)+(MAij−LAij)]/3+LAij
i, j
(3)
for the triplet (a1 , a2 , a3 ) of a tringular fuzzy number Ã. Step 5: Ranking the performance criteria Criteria are ranked based on the magnitude of BNP. eISSN 2067- 2462
98
Lazim A. and Wahab N. mrp.ase.ro
A FUZZY DECISION MAKING APPROACH IN EVALUATING FERRY SERVICE QUALITY MANAGEMENT RESEARCH AND PRACTICE Vol. 2 Issue 1 (2010) p: 94-107
2.2. Level and degree of Satisfaction Besides ranking of the criteria, satisfaction level for each criterion is equally important. It gives specific satisfaction level out of five defined linguistic levels perceived by customer. Level of satisfaction and its degree can be obtained using the following steps. Step 1: Define a linguistic level of service based on responses from questionnaire According to Zadeh (1965), it is very difficult for conventional quantification to express reasonably those situations that are obviously complex or hard to define; thus, notion of a linguistic variable is necessary in (Zimmerman, 1996). One example for the linguistic variable is ‘ferry service quality’. It means the service
Volume 2, Issue 1 / March 2010
Management Research and Practice
such situations. A linguistic variable is a variable with linguistic words or sentences in a natural language quality that customer experiences during ferry service. The possible values for this variable could be: ‘very poor’, ‘poor’ , ‘fair’, ‘good’, and ‘very good’. In this study, there were five linguistic variables with 5-point Likertscale. Membership functions for linguistic variables are defined by as follow: Very poor,
{1/1
0.75/2
0.5/3
0/4
0/5}
Poor,
{0.5/1
1/2
0.75/3
0.25/4
0/5}
Average,
{0/1
0.5/2
1/3
0.5/4
0/5}
Good,
{0/1
0.25/2
0.75/3
1/4
0.5/5}
Very Good,
{0/1
0/2
0.5/3
0.75/4
1/5}
Step 2: Obtain weight for each respondent Weight for each respondent, w is a proportion of the response’s linguistic value, v to the total of linguistic value for all respondents,
w
i
=
∑v .
v ∑ v i
n
i =1
(4)
i
Step 3: Obtain the overall value of membership function The value of membership function for all level satisfaction of the evaluators can be determined by using a distance formula. Faratin et al. (1998) propose a formal model of service-oriented negotiation between autonomous agents. They introduce a multi-attribute representation and evaluation model that uses evaluation functions, defined as weighted sums of score function values.
eISSN 2067- 2462
99
Lazim A. and Wahab N. mrp.ase.ro
A FUZZY DECISION MAKING APPROACH IN EVALUATING FERRY SERVICE QUALITY MANAGEMENT RESEARCH AND PRACTICE Vol. 2 Issue 1 (2010) p: 94-107
n
µi (x) = ∑ wi i =1
x
(5)
i
where xi represents the i-th linguistic level of respondents, wi is the weight of repondents. Step 4: Obtain level and degree satisfaction Turksen and Willson (1994), proposed a formula for calculating degree of similarity which involved the calculation of Euclidean distance between fuzzy sets given as:
1
SIM ( B ' ( y, m), B( yi, m)) =
Volume 2, Issue 1 / March 2010
Management Research and Practice
1+
∑ µ B' ( yj, m) − µ B ( yj, m) 2
(6)
where µ B is the fuzzy set defined for linguistic rating and µ B ' is the calculated overall value of membership functions. The distance formula reflects degree and level of satisfaction for criteria. Details on calculation of the Euclidean distance formula can be retrieved from Lazim et al., (2004) and Lazim (2009).
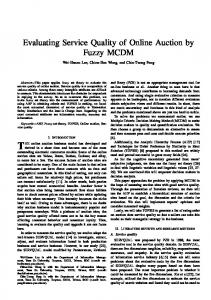
3. RESEARCH STRUCTURE The empirical study of ferry service quality is conducted according to the following research structure in order to meet the research objectives. 3.1. Design of questionnaire The questionnaire of this study is designed based on related studies with some modifications based on the research structure and purpose of the research. The evaluators are selected from the customers who are using the ferry’s service. The final version of the questionnaire is completed after amending or modifying words and sentences that are not clear in meaning. Linguistic variables ‘very poor’(1) to ‘very good’(5) are used in this paper to determine the satisfaction levels of ferry service criteria. The customers have to answer the questionnaire given in scale 1 to 5. 3.2. Evaluation aspects and Criteria The variables of the questionnaire are on-board comfort, ferry employees, handling of abnormal conditions and reliability of services. We used these criteria category in the questionnaire. The criteria in Fig. 1 are used for service quality evaluation of a ferry company. The criteria below are a modified version from Chang and Yeh (2002).
eISSN 2067- 2462
100
Lazim A. and Wahab N. mrp.ase.ro
A FUZZY DECISION MAKING APPROACH IN EVALUATING FERRY SERVICE QUALITY MANAGEMENT RESEARCH AND PRACTICE Vol. 2 Issue 1 (2010) p: 94-107
Objective
Criteria Categories
Evaluation Criteria C1- Cleanliness and noise level of ferry
On-board Comfort
C2- On-board facilities including seat comfort and spaciousness
Evaluate
C3- Helpful attitudes and courtesy of Ferry Employees
check-in personnel C4- Attention by employees
quality
Volume 2, Issue 1 / March 2010
Management Research and Practice
service
C5- Service efficiency of ferry
of ferry
Handling of abnormal conditions
C6- Security related accidents C7-Ferry safety and security measure C8- On-time performance
Reliability of Service
C9- Handling of customer complains or under-performance liability C10- Handling of ferry delays
FIGURE 1 - CRITERIA OF SERVICE QUALITY
3.3. Survey The sample of this research was a group of ferry passengers that used a ferry service from mainland of Peninsula Malaysia to a tourist spot island and vice-versa. The questionnaires were distributed to the customers who were using the ferry services. Hundred twenty six questionnaires were given out to the customers and eighty seven of questionnaires were completely filled. The results were evaluated from the answers given by customers or passengers. The questionnaire was structured into two sections. Section A contains personal data’s of customers such as genders, ages, races, occupations and nationalities. Section B contains customer’s perception about quality of ferry services. Customers have to fill the questionnaire given in the scale of 5, 4, 3, 2, 1 to represent very good, good, average, poor, very poor respectively. eISSN 2067- 2462
101
Lazim A. and Wahab N. mrp.ase.ro
A FUZZY DECISION MAKING APPROACH IN EVALUATING FERRY SERVICE QUALITY MANAGEMENT RESEARCH AND PRACTICE Vol. 2 Issue 1 (2010) p: 94-107
3.4. Evaluation Framework In accordance with the objectives described above, the evaluation procedure of this study consists of two parts. In the first part, the rank of performance for criteria by applying Average Fuzzy Judgment and BNP method are calculated. The criteria of service quality that customers consider the most important are identified. In the second part, degree of similarity between overall value of membership and linguistic rating are utilized to obtain the degree and satisfaction levels. The framework of two parts procedures are shown in
Volume 2, Issue 1 / March 2010
Management Research and Practice
Fig. 2.
Criteria of Service Quality Average
Fuzzy
Overall
Judgement
value
of
membership function
BNP
Degree of Similarity
Ranking of Performance Criteria
Level of Satisfaction Degree of satisfaction FIGURE 2 - EVALUATION FRAMEWORK
4. ANALYSIS AND RESULTS A fuzzy MCDM analysis approach as prescribed in previous section is utilised in this evaluation. For the purpose of clarity, examples of obtaining performance criteria and degree of satisfaction are given prior tabling full results. 4.1. Performance Criteria Assuming that we take 10 customers to evaluate of C1 (Cleanliness and noise level of the ferry). Set of customers, X = {X 1 , X 2 , X 3 , X 4 , X 5 , X 6 , X 7 , X 8 , X 8 , X 10 } Set of the level of the service = {5, 4, 2, 3, 1, 3, 1, 4, 3, 1} The average of fuzzy result (Equation (1)), Ai (a1 , a2 , a3 ) = 1/10(2.25 + 1.25+...+0.00, 2.5 +1.75+…+0.00, 2.5 +2.25+…+ 0.75) =
(0.70, 1.05, 1.58).
eISSN 2067- 2462
102
Lazim A. and Wahab N. mrp.ase.ro
A FUZZY DECISION MAKING APPROACH IN EVALUATING FERRY SERVICE QUALITY MANAGEMENT RESEARCH AND PRACTICE Vol. 2 Issue 1 (2010) p: 94-107
Equations (2) are used to obtain end points of fuzzy numbers. The next step is defuzzification which meant to convert fuzzy number to the crisp real number for find the BNP value. Using Equation (3), then BNPi = 1.16. Thus, the performance for criterion C1 is 1.16 The same fashions of calculations are executed for all criteria after considering score from all respondents.
Volume 2, Issue 1 / March 2010
Management Research and Practice
The performance and ranking for the all criteria are presented in Table 1. TABLE 1 - RANKING OF THE PERFORMANCE OF THE CRITERIA Criteria Defuzzification Ranking C1 4.17 4 C2 4.00 8 C3 4.33 2 C4 4.25 3 C5 4.35 1 C6 4.01 7 C7 3.98 9 C8 4.08 5 C9 4.03 6 C10 3.76 10
It is clearly seen that criterion C5 scores the highest value. Service efficiency of ferry personnel received the highest thumbs up from the customers. The criterion of C10 handling of ferry delay was ranked as the least defuzzification score. 4.2. Level of Satisfaction and Degree of Satisfaction Example below explains the calculation steps to obtain level of satisfaction and degree of satisfaction. Assuming that we take 10 customers for evaluate of C1 (Cleanliness and noise level of the ferry). Set of customer, X = {X 1 , X 2 , X 3 , X 4 , X 5 , X 6 , X 7 , X 8 , X 8 , X 10 } Set of the level of the service = {5, 4, 2, 3, 1, 3, 1, 4, 3, 1}. Using equation (4), Value of weight, wi = {
5 4 1 , , …, …, …, ………………..., } 27 27 27
We used sum of weighted for the membership function to evaluate the service (Equation (5)). Membership value for customer X i
eISSN 2067- 2462
103
Lazim A. and Wahab N. mrp.ase.ro
A FUZZY DECISION MAKING APPROACH IN EVALUATING FERRY SERVICE QUALITY MANAGEMENT RESEARCH AND PRACTICE Vol. 2 Issue 1 (2010) p: 94-107
µ
X1
=
5 {0/1 27
={
µ
X2
=
0/2
0/1
0.5/3
0/2
0.09259/3
4 {0/1 0.25/2 27
0.75/3
0.75/4
1/5}
0.13889/4
0.18529/5}
1/4
0.5/5}
Membership values for ten customers are executed and results are given in Table 2. TABLE 2 - VALUE OF MEMBERSHIP FUNCTION FOR TEN EVALUATORS
Volume 2, Issue 1 / March 2010
Management Research and Practice
Evaluators
Membership Value
X1
{
0
0
0.09259
0.13889
0.18529
}
X2
{
0
0.037404
0.11111
0.14815
0.07407
}
X3
{
0.037404
0.07407
0.5556
0.01852
0
}
X4
{
0
0.5556
0.11111
0.5556
0
}
X5
{
0.037404
0.02778
0.01852
0
0
}
X6
{
0
0.5556
0.11111
0.5556
0
}
X7
{
0.037404
0.02778
0.01852
0
0
}
X8
{
0
0.037404
0.11111
0.14815
0.07407
}
X9
{
0
0.5556
0.11111
0.5556
0
}
X 10
{
0.037404
0.02778
0.01852
0
0
}
The overall value of membership function for the criterion C1 given by ten customers is:
µ x ( X ) = {0.14816/1
0.39817/2
0.75926/3
0.62039/4
0.33343/5}
Degree of satisfaction can be calculated using Equation (6). The numerical results are
SIM ( X , Very Poor )
= 0.47782
SIM ( X , Poor )
= 0.48969
SIM ( X , Average )
= 0.50130
SIM ( X , Good )
= 0.51845
SIM ( X , Very Good )
= 0.51615
eISSN 2067- 2462
104
Lazim A. and Wahab N. mrp.ase.ro
A FUZZY DECISION MAKING APPROACH IN EVALUATING FERRY SERVICE QUALITY MANAGEMENT RESEARCH AND PRACTICE Vol. 2 Issue 1 (2010) p: 94-107
The consensus for ten customers is ‘good’ in rating the level of satisfaction for C1 with 0.51845 degree of satisfaction. The evaluation procedures for other criteria and customers are executed with the similar fashion. In summary, values of membership functions for all level of satisfaction in accordance to criteria are presented in Table 3.
Volume 2, Issue 1 / March 2010
Management Research and Practice
TABLE 3 - VALUES OF MEMBERSHIP FUNCTIONS BASED ON LEVEL OF SATISFACTIONS Criteria C1 C2 C3 C4 C5 C6 C7 C8 C9 C10
0.054216/1 0.05625/1 0.03468/1 0.041174/1 0.031614/1 0.065415/1 0.072335/1 0.064407/1 0.052802/1 0.083050/1
Value of membership function for all level of satisfactions 0.369723/2 0.795168/3 0.69276/4 0.392991/2 0.828129/3 0.704709/4 0.344633/2 0.794827/3 0.728332/4 0.345153/2 0.798568/3 0.697813/4 0.343389/2 0.795998/3 0.720527/4 0.395643/2 0.806869/3 0.659664/4 0.419814/2 0.816043/3 0.665095/4 0.391084/2 0.799049/3 0.667174/4 0.394397/2 0.824547/3 0.655255/4 0.462610/2 0.863797/3 0.65197/4
0.355416/5 0.19688/5 0.375712/5 0.361756/5 0.376435/5 0.32088/5 0.295587/5 0.337419/5 0.298133/5 0.222603/5
It can be seen that membership functions are greater that 0.5 for level of satisfaction ‘average’ and ‘good’ for all criteria. The consensus of all membership functions is needed to obtain degree of satisfaction. The degree of satisfaction and level of satisfaction according to the criteria are presented in Table 4. TABLE 4 - DEGREE OF SATISFACTION AND LEVEL OF SATISFACTION ON BOARD COMFORT CRITERIA C1: Cleanliness and noise level of ferry C2: On-board facilities including seat comfort and spaciousness C3: Helpful attitudes and courtesy of check-in personnel C4: Attention by employees C5: Service efficiency of ferry personnel C6: Security-related accidents C7: Ferry safety and security measures C8: On-time performance C9: Handling of customer’s complaints or underperformance liability C10: Handling of ferry delays
DEGREE OF SATISFACTION 0.561459 0.863388
LEVEL OF SATISFACTION VERY GOOD GOOD
0.659324
VERY GOOD
0.563578 0.670189 0.596082 0.783580 0.685633 0.725451
VERY GOOD VERY GOOD GOOD GOOD VERY GOOD GOOD
0.827914
GOOD
Table 4 shows the results obtained from analysing the satisfaction of customers for on board comforts criteria. The results show that the customers are happy with the service following the level of satisfaction at ‘very good’ and ‘good’. The identification of customers’ perceptions of service quality in ferry is essential to tailor marketing efforts in ensuring customer satisfactions are met.
eISSN 2067- 2462
105
Lazim A. and Wahab N. mrp.ase.ro
A FUZZY DECISION MAKING APPROACH IN EVALUATING FERRY SERVICE QUALITY MANAGEMENT RESEARCH AND PRACTICE Vol. 2 Issue 1 (2010) p: 94-107
5. CONCLUDING REMARKS In an attempt to promote the island as a tourist holiday destination through its ferry operation activities, ferry management should make concerted efforts for improving their customer’s satisfaction. In this paper, customers evaluated the service of ferry according to the ten criteria. Fuzzy numbers and membership function have been used as an adequate methodology to overcome the uncertainty of concepts that are associated with human beings’ subjective judgments. The defuzzification method has identified the best criteria and eventually the ranking for all criteria is established. The distance formula is also employed to determine level of satisfaction and its respective degrees. The fuzzy decision making approach gives the
Volume 2, Issue 1 / March 2010
Management Research and Practice
different in technique to estimate the perception of customer’s satisfactions rather than using statistical method. Service efficiency of ferry personnel was ranked as the best criteria. The level of satisfaction ‘good’ and ‘very good’ were given thumbs up from customers to all criteria. This study makes empirical contributions to hospitality and tourism marketing literature especially in the way the ferry service can be upgraded. The results obtained via the definition of fuzzy number and linguistic level together with their membership functions as methods to measure service quality. The results also help the ferry company to better understand how the customers view their services. REFERENCES Akbaba, A. (2006). Measuring service quality in the hotel industry: a study in a business hotel in Turkey, International Journal of Hospitality Management 25 (2), pp. 170–192. Bai, C. and Yee., C. (2005). Construct a public service quality evaluation model: evidence from Chinese public service industry, Proceedings of International Conference on Service Systems and Service Management, 1, pp. 508-5013. Bellman, R. E. and Zadeh, L. A. (1970). Decision making in a fuzzy environment. Management Science 17 (4), pp. 141–164. Bolton, R. and Drew, J. (1991). A longitudinal analysis of the impact of service changes on customer attitude. Journal of Marketing, 55, pp. 1–9. Chang, Y. H. and Yeh, C. H. (2002). A survey analysis of service quality for domestic airlines, Tourism Management, 23 (2), pp.107-115. Dubois, D. and Prade, H. (1978). Operations on fuzzy number. International Journal of System Science 9(6), pp. 613–626. Economic Planning Unit. (2006). Ninth Malaysian Plan Document. Prime Minister Department, Government Publication: Putrajaya. Retrieved September 16, 2006, from http://www.epu.jpm.my/rm9/html/english.htm Engel, J. F., Blackwell, R. D. and Miniard, P. W. (1995). Consumer Behavior (eighth ed.), The Dryden Press, Forth Worth, TX. Faratin, P., Sierra, C. and Jennings, N. (1998). Negotiation decision functions for autonomous agents. Rob. Autonomous Syst. 24, pp. 159–182. eISSN 2067- 2462
106
Lazim A. and Wahab N. mrp.ase.ro
A FUZZY DECISION MAKING APPROACH IN EVALUATING FERRY SERVICE QUALITY MANAGEMENT RESEARCH AND PRACTICE Vol. 2 Issue 1 (2010) p: 94-107
Ghobadian, A., Speller, S. and Jones, M. (1994). Service quality concepts and model, International Journal of Quality and Reliability Management, 11(9), pp. 43-66. Goodale, J. C., Koerner, M. and Roney, J. (1997). Analyzing the impact of service provider empowerment on perceptions of service quality inside an organization, Journal of Quality Management, 2 (2), pp. 191–215. Gronroos, C. (1990). Service Management and Marketing: Managing the moments of truth in Service Competition, Free Press, Lexington Books, Lexington, MA. Hensher, D. A., Stopher, P. and Bullock, P. (2003). Service quality – developing a service quality index in the provision of commercial bus contracts, Transportation Research Part A: Policy and Practice, 37 (6), pp. 499–517.
Volume 2, Issue 1 / March 2010
Management Research and Practice
Lazim, M. A., Wan Salihin, W. A. and Abu Osman, M. T. (2004). Fuzzy Sets in Social Sciences: An Overview of Related Research. Journal Teknologi, 41(E), pp. 43-54. Lazim, M. A. and Abu Osman, M. T. (2009). Measuring Teachers’ Beliefs about Mathematics: A fuzzy Set Approach, International Journal of Social Sciences, 4(1), pp.39-43. Mei, A. W. O., Dean, A. M. and White, C. J. (1999). Analyzing service quality in the hospitality industry, Managing Service Quality, 9 (2), pp. 136-143. Parasuraman, A., Zeithaml, V. A., and Berry, L. L. (1985a). A conceptual model of service quality and its implications for future research. Journal of Marketing , 49 (Fall), pp. 46–50. Parasuraman, A., Zeithaml, V. A. and Berry, L .L. (1985b). SERVQUAL: a multiple-item scale for measuring consumer perceptions of service quality. Journal of Retailing, 64 (1), pp. 38–39. Prioni, P. and Hensher, D. A. (2000). Measuring service quality in scheduled bus services, Journal of Public Transport, 3 (2), pp. 51–74. Reichheld, F. F. and Sasser, W. E. (1990). Zero defections: quality comes to services, Harvard Business Review, 68 (5), pp. 105–111. Rendeiro, M.-C. R. (2006). Tourism service quality begins at the airport, Tourism Management, 27 (5), pp. 874–877 Tsaur, S. H., Chang, T. Y., and Yen, C. H. (2001). The evaluation of airline service quality by fuzzy MCDM, Journal Tourism Management, 23, pp. 107-115. Turksen, I. B. and Willson, I. A. (1994). A fuzzy set preference model for consumer choice. Fuzzy Sets and Systems, 68, pp. 253- 353. Viswanathan, M. (1999). Understanding how product attributes influence product categorization: development and validation of fuzzy set-based measures of gradedness in product categories. Journal of Marketing Research, 36(1), pp. 75–95. Xia, X., Wang, Z. and Gao, Y. (2000). Estimation of non-statistical uncertainty using fuzzy-set theory. Measurement Science & Technology, 11(4), pp. 430–435. Zadeh, L. A. (1965). Fuzzy Sets. Information and Control, 8, pp. 338-353. Zadeh, L. A. (1970). The concept of a linguistic variable and its application to approximate reasoning. Information sciences, Part 1: 8, pp.199–249; Part 2: 8, pp. 301–357; Part 3: 9, pp. 43–80. Zeithaml, V. A. (2000). Service quality, profitability, and economic worth of customers: what we know and what we need to learn, Journal of the Academy of Marketing Science, 28(1), pp. 67-85. Zimmerman, H. J. (1996). Fuzzy set theory and its applications, Kluwer, Boston. eISSN 2067- 2462
107