Environment and Natural Resources Research; Vol. 4, No. 4; 2014 ISSN 1927-0488 E-ISSN 1927-0496 Published by Canadian Center of Science and Education
A Fuzzy Linear Optimization Investigation for Cropping Patterns and Virtual Water Transfers under Water Scarcity in Gansu Province, Northern China Chen Zhang1 & Edward A. McBean1 1
School of Engineering, University of Guelph, Canada
Correspondence: Chen Zhang, School of Engineering, University of Guelph, Canada. E-mail:
[email protected] Received: August 31, 2014 doi:10.5539/enrr.v4n4p189
Accepted: September 13, 2014
Online Published: October 22, 2014
URL: http://dx.doi.org/10.5539/enrr.v4n4p189
Abstract Water scarcity is occurring worldwide due to factors including climate change, population increases, and economic activity. The situation is most severe in arid areas. Based on a water supply stress index and virtual water for production, a fuzzy linear programming model is used to provide a set of solutions that contain a range of possible values rather than a specific optimal solution. The model is used to investigate cropping patterns that can obtain acceptable stress levels on local water resources for both current and future climate scenarios. Results in Gansu Province indicate that existing cropping patterns are causing extreme stress on local water resources, especially in eastern Gansu, and the stress will continue in the future if cropping patterns are not adjusted. The optimization model indicates that a considerable amount of water used is not necessarily needed, and deficits of virtual water demands can be covered by virtual water transfers. Optimal cropping patterns show that in the current scenario, total cropping areas in eastern Gansu should be reduced by up to 55% to attain acceptable water stress, and 24.2 and 22.5% for western Gansu and mid Gansu, respectively. The enormous cropping reduction in certain crops and the relatively larger decreases of cropping areas in the eastern region are indicated as a direction, to improve the balance between irrigation and municipal water needs. Virtual water transfer analysis shows that mid Gansu can be a major export region, while eastern Gansu will require large amounts of virtual water imports. Keywords: fuzzy linear programming, virtual water, water scarcity, Gansu 1. Introduction Increases in population, urbanization, and economic activities as well as climate change have led to increasing pressures on freshwater resources (Dalin et al., 2012). Water scarcity influences food security, human health and natural ecosystems, effects which are particularly severe in arid regions (Seckler et al., 1999). In response, the concept of virtual water is valuable, involving reducing water stress in a region by importing more food, especially food which requires significant water, instead of producing these foods (Allan, 1998). Since irrigation water represents a major use of freshwater, it is preferable in arid regions that crops using more water be imported and crops using less water can be exported, for purposes of saving water (Hoekstra & Hung, 2005). Virtual water for a crop is the amount of water used to produce the crop and “embedded” in the crop. With transfer of the crop from one place to another, the embedded water is transferred in a virtual sense. Virtual water has been applied as a water-saving strategy in many areas around the world. For example, both Morocco and the Netherlands depend more on external water resources – 14 and 95% from outside of the two countries, respectively; and an amount of 640 million m3 of water is saved per year for Morocco since the products are imported instead of being produced (Hoekstra & Chapagain, 2006). Another study assessing worldwide consumption of cotton production indicates that approximately 2.6% of the global water footprint is for the production of cotton products, and thus represents a large impact on water resources in nations such as China, USA, Mexico, and Germany (Chapagain et al., 2006). From the analysis of water economic productivity for the Mancha Occidental Region in Spain, it is noted that crops with high virtual water and low economic value are major crops in the region, and the region relies mostly on its domestic water resources, although import of virtual water would be beneficial to local water bodies (Aldaya et al., 2010). The findings of the water footprint analysis are indications of the current water policy, by
189
www.ccsenet.org/apr
Applied Physics Research
Vol. 6, No. 5; 2014
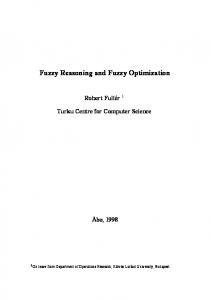
indicating that water can be allocated and used more effectively. Minimum water stress can be obtained through optimization of the cropping structure and virtual water transfers. One of the most effective techniques for optimization is linear programming (LP), which consists of a linear objective function and linear equality and/or inequality constraints. LP will return a crisp solution, meaning a number that is typically a single value. According to Klir et al. (1997), practical problems commonly contain uncertainties resulting from a variety of factors such as vagueness, which a crisp number is not able to capture. Compared with crisp numbers, a fuzzy number is a set of possible values that have different degrees between 0 and 1 showing the closeness of the value in the fuzzy set to the given crisp number, and hence reflects the sensitivities which exist in real problems. In other words, parameters in LP models are generally best estimates, regardless of the dynamic natural environments which, on the other hand, can be best handled by fuzzy numbers. LP models require precise data which would add difficulties in the process of data collection. Additionally, the solution of an LP model commonly relies only on a limited number of constraints thus leading to a waste of information (Rommelfanger, 1996). However, in real world situations, parameters in objective functions and constraints are often not entirely precise and contain vague information (Tanaka & Asai, 1984; Inuiguchi & Ramk, 2000; Maleki et al., 2000). In this case, fuzzy linear programming (FLP) provides a more reasonable and appropriate solution. In FLP models, parameters of objective functions and constraints are fuzzy numbers which contain a set of possible values of each parameter. These fuzzy numbers can avoid the crisp situation of “Yes” and “No”, thus making the linear programming model less crude (Zimmermann, 1978; Herrera & Verdegay, 1995). As well, satisfaction criteria such as “approximately” and “nearly” are more desirable than the precisely defined criteria such as “exactly” and “absolutely” for a realistic optimization problem (Tanaka & Asai, 1984). FLP is now widely applied to decision problems. Sahoo et al. (2006) developed a fuzzy optimization model for managing and allocating land and water resources system in Mahanadi-Kathajodi Delta in eastern India with three objectives – maximization of production, maximization of net annual return, and minimization of labour cost for the study area. Compared with models such as maximizing production and maximizing net return, a multi-objective fuzzy optimization model can provide the optimal solution when all three objectives are at the same priority level (Sahoo et al., 2006). In the research of Biswas and Pal (2005), production of seasonal crops is optimized using a priority-based fuzzy goal programming model. Biswas and Pal indicate that a better cropping plan is developed through use of fuzzy goal programming. Being one of the driest province in China, Gansu Province is facing the issue of water stress due to reasons such as climate change and inappropriate water use. It is useful to investigate strategies to reduce water stress. The impacts of cropping patterns on local water resources involve uncertainties due to factors such as climate conditions, locations and crop types. In such a case, parameters in the optimization model for cropping patterns should be fuzzy numbers instead of fixed numbers. Considering the merits of FLP indicated above, and that FLP for cropping patterns related to water stress have not been utilized for Gansu Province, the optimization of cropping patterns can be modified from “minimum water stress” to “acceptable water stress”. The objectives of this paper were to: (1) develop an FLP model for cropping patterns to achieve the goal of attaining acceptable stress on local water resources using virtual water constraints under two scenarios – current and future climate scenarios; and (2) given the attainment of acceptable water stress, use the optimized cropping patterns to determine virtual water transfers for the major crops. 2. Methods 2.1 Study Areas and Required Data Gansu Province is one of the most arid regions in China and has high stress on water resources. Three regions from the west to the east portions of Gansu Province were selected as study areas (see Figure 1). The West region is the most arid region, the Mid region has a moderate arid climate, while the East region is relatively humid. Typical stations representing the three regions were used based on the quality of required data (see Table 1). Major crops in the three areas are: wheat, corn, cotton, potatoes, and soy.
190
www.ccsenet.org/apr
Applied Physics Research
Vol. 6, No. 5; 2014
Figure 1. Location of Gansu Province and Selected Stations Table 1. Selected stations Portion West
Station Name Jiuquan Jiayuguan Zhangye
LAT(◦ ) 39.77 39.81 39.08
LON(◦ ) 98.48 98.30 100.28
ELEV(m) 1478 1558 1462
Mid
Wuwei Lanzhou
37.93 36.05
102.64 103.88
1535 1518
East
Tianshui Pingliang
34.58 35.55
105.75 106.67
1143 1135
Agricultural data including annual cropping areas and crop yield of major crops, as well as population data were obtained from Gansu Yearbooks on China Data Online (CDO, 2013), water resources data from Gansu Water Resources Bulletin, irrigation water demands of current and future scenarios as calculated in Zhang and McBean (2014) using data from National Climatic Data Centre (NCDC, 2013), and virtual water contents (VWC) generated in the study of Zhang et al. (2014). 2.2 Fuzzy Linear Programming Model for Cropping Patterns The Water Supply Stress Index (WaSSI), representing water supply stress from environmental and anthropogenic sectors as proposed by McNulty et al. (2010), characterizes the scarcity of water resources caused by the growing of the major crops. When WaSSI is 0.2, there is a stress; and when WaSSI increases to 0.4, the stress becomes scarcity (Brown & Matlock, 2011). WaSSI for the selected areas is expressed in Equation 1 as: ∑ WaS S I j =
WDi j WS j
(1)
Where: WaS S I j = water supply stress index in region j; WDi j = irrigation water demand of crop i in region j(m3 ); and WS j = total water supply volume to the crop field in region j (m3 ). To obtain acceptable stress on local water resources while ensuring the basic crop needs are met, the FLP model was developed that maximizes crop yields of the five crops, subject to constraints including acceptable WaSSI and appropriate cropping areas based on blue virtual water for producing each crop (See Equation 2.2). Blue virtual water refers to the amount of irrigation water including both surface and ground water, used for crop growth. Two climate scenarios were analyzed – (1) current scenario considered the time period from 2000 to 2010; and (2) future scenario considered the time period from 2030 to 2050. 191
www.ccsenet.org/apr
Applied Physics Research
Maximize subject to
Vol. 6, No. 5; 2014
∑ fi j yei j A ∑ g f (df i j Ai j )/WS j = 0.22 · α j , f df i j Ai j ≥ VW pi j , or
(2)
f f ^i j f df i j Ai j ≤ VW pi j and di j Ai j ≥ VWn fi j > 0 A Where: yei j = crop yield of crop i per cropping area in region j (1000kg/1000Ha); fi j = optimized cropping area of crop i in region j(1000Ha); A αej = ratio of effective irrigation area and cropping area (%) in region j, specifically, αWest = α Mid = 1, andαEast = 22%; df i j = irrigation need for crop i in region j(mm); ^ VW pi j = blue virtual water for producing crop i in region j(m3 ) before optimization; ^i j = blue virtual water needs for crop i in region j(m3 ), which is determined from: VWn ^i j = ^ VWn POP j · ^ pi j · VWCi j where: ^ POP j = population in region j (104 ); pi j = need for crop i per person in region j (kg/person); and ^i j = virtual water content of crop i in region j (m3 /1000kg). VWC i = crop type: wheat, corn, cotton, potatoes, soy; and j = region of the Province: West, Mid, and East. f Table 2 describes the criterion of whether the constraint of df i j Ai j should be greater or less than the blue virtual water for producing crop i in region j before optimization. Table 2 is primarily based on the suggestions for cropping patterns from Zhang et al. (2014), combined with existing cropping structures and crop needs by local people. For example, as suggested by Zhang et al. (2014), cropping of potatoes should be increased due to the low virtual water content and high economic value for the virtual water used. However, in fact, the production of potato is exceeding local demands; this indicates reduction in potato cropping is desirable instead of increased cropping. Based on Table 2, if crop i is to be decreased, the blue virtual water used for production of crops should be less than the current use of blue virtual water amount (VW pi j before optimization), otherwise, more blue virtual water is expected to be applied for production, in comparison with existing VW pi j . f Table 2. Criterion of df i j Ai j in FLP models West region Wheat Corn Soy Potatoes
Mid region Wheat Soy Potatoes
East region Wheat Corn Soy Potatoes
Crops can be increased
Cotton
Corn
-
Crops unchanged
-
Cotton
Cotton
Crops needing to be decreased
Some parameters are quantified as fuzzy numbers instead of fixed numbers since these parameters can be closely related to factors such as climate conditions and time period which commonly contains uncertainties. Specifically, the type of fuzzy numbers in the FLP model are LR triangular fuzzy numbers. LR fuzzy numbers are expressed e e α is the left spread, and β is the right spread. In addition, M e as , M=(m, α, β)LR , where m is the mean value of M, 192
www.ccsenet.org/apr
Applied Physics Research
Vol. 6, No. 5; 2014
e is described in is positive and m - α > 0 (Fan et al., 2009; Dehghan et al., 2006). The membership function of M e Equation 3, and M is a LR triangular fuzzy number if L(x) and R(x) are linear functions (Fan et al., 2009). L ( (m − x)/α ) R ( (x − m)/β )
x ≤ m, x ≥ m,
α>0 β>0
(3)
Each parameter varies over time due to climate variability. The mean values m herein are the mean values of each parameter during the selected time period, with the lower and upper values being the minimum and maximum values during the time period, respectively. For the future time period, mean values and extreme values were determined from projections for future scenarios. Taking the irrigation need (d) for example, an LR fuzzy number of de can be expressed as de = ( d, d − dmin , dmax − d )LR . The objective is to set WaSSI to be approximately 0.22 for g = (0.2, 0.22, 0.28), which, in the LR fuzzy number format, is (0.22, 0.02, 0.06)LR . the three regions – i.e. 0.22 For the future scenarios of A1B, B1, and A2, de was from the General Circulation Models (GCM models) predictions described in Zhang and McBean (2014). Parameters such as population, yield per cropping area, and cropping area before optimization were estimated using the moving average method. Since water supply delivered to the fields is very near the limit of the supply capacity of total water resources (as high as 95%), delivery capacities were assumed to be unchanged for the future scenario. The crop that a person comsumes is another parameter which was assumed as not changing. The solving of the FLP followed the approach of converting the FLP model to a crisp linear model, as indicated by R Fan et al. (2009) with the assistance of LINGO⃝ . 2.3 Water savings and virtual water transfers Optimization for cropping patterns for the three regions within Gansu Province will generate estimates of the potential saving in local water resources (Equation 4). Additionally, the difference (Di j )of virtual water for production after optimization (VW popt−i j ) and virtual water needs (VWni j ) can be transferred amongst the regions (Equation 5). If Di j is positive, the extra amount of virtual water for crop i can be exported to other regions; otherwise, if Di j is negative, imports of virtual water for crop i are required from outside of a region j. Sj=
∑
VW pi j −
∑
VW popt−i j
(4)
Where: S j = blue virtual water saving in region j; VW pi j = blue virtual water for production of crop i in region j before optimization(m3 ); and VW popt−i j = blue virtual water for production of crop i in region j after optimization(m3 ).
Di j = VW popt−i j − VWni j
(5)
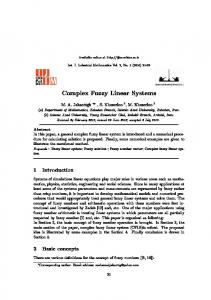
3. Results 3.1 Fuzzy linear optimization for cropping patterns Table 3 and Figures 2 (a) through (e) are the optimization results for the existing cropping areas of the five crops in the three regions. Existing WaSSI for the West, Mid, and East regions are 0.29, 0.28, and 0.49, respectively. The results show that total cropping areas in all three regions should be reduced to obtain acceptable WaSSI magnitudes of 0.22. Specifically, the West and Mid region need to reduce the total cropping areas by 24.2 and 22.5%, respectively; and the East region by 55.4%. Further, the East region will also have a relatively higher reduction in every crop except for potatoes, compared with the West and Mid regions. Major reductions of cropping areas in the East region involve decreases in soy (approximately 90%), followed by wheat (approximately 45%). Potatoes and soy in the West region, as well as wheat and soy in the Mid region will need to be decreased as well (see Table 3).
193
www.ccsenet.org/apr
Applied Physics Research
a1
a2
a3
194
Vol. 6, No. 5; 2014
www.ccsenet.org/apr
Applied Physics Research
Vol. 6, No. 5; 2014
a4
a5 Figure 2. Cropping Area of for the major crops in the three region(before and after optimization) In the future scenario, the predicted WaSSI for the West region will remain at the same level as existing. There is going to be a slight increase of WaSSI from 0.28 to 0.33 in the Mid region, due to climate change. WaSSI in the East region will decrease from 0.49 to 0.37. Results in Table 4 show that optimization for cropping patterns is still necessary in the future as a result of climate change, with reduction of 27.7, 33.0, and 40.3% in total cropping areas for the West, Mid, and East regions, respectively. Individual crops which need major reductions in the current scenario will still need major reductions in the future. Changes in optimized cropping areas from the current scenario to the future scenario for each crop tend to be larger for the Mid and East regions shown in Figures 2 (a) through (e), especially for corn, potatoes, and soy (see Figure 2 (b), (d), and (e)). Commonly, the changes in lower and upper bounds have the same trends as the mean values change from the current scenario to the future scenario (e.g. wheat and potatoes in the West region). However, for some crops such as the crops in the East region, lower bounds of optimized cropping areas are zeroes; and for some crops such as wheat in the East region and corn in the Mid region (see Figure 2 (a) and (b)), the trends are particularly steep. 3.2 Savings in blue water Tables 5 and 6 show savings of virtual water (S) if cropping patterns are optimized. For both current and future scenarios, there will be significant savings in water use for all three regions. The highest savings of water use are for the East region. From Table 5, if the East region changes the cropping patterns, the total water used would be 195
www.ccsenet.org/apr
Applied Physics Research
Vol. 6, No. 5; 2014
decreased by 5495 × 105 m3 (55.4%) from existing cropping patterns; the major savings are from decreased soy cropping – i.e. 75.9%. The savings are apparent for other crops in the East region as well. For example, savings from decreased cropping in cotton and corn will be approximately 70%, and will be approximately 54% for wheat cropping. There will be 2098 × 105 and 3063 × 105 m3 of water saved for the West and Mid regions, respectively. Among the changes, soy and potatoes in the West region are relatively larger, accounting for 97.3 and 82.3% respectively, followed by soy and wheat in the Mid region (81.6 and 77.8%). Cropping for corn in the Mid region, on the other hand, will involve a large increase in water used (4755×105 m3 ), adopting the optimized cropping patterns. Table 3. Comparison of cropping areas before and after optimization - current scenario (1000Ha)
West
Mid
East
Crop Types Wheat Corn Cotton Potatoes Soy sum WSI
Before OPT 19.9 18.5 42.3 0.95 1.05 82.7 0.29
Lower Limit 12.1 0.00 0.00 0.00 0.00 12.1 0.05
Mean 14.5 12.3 29.7 0.17 0.03 56.7 0.22
Upper Limit 18.0 15.7 34.6 0.27 0.03 68.5 0.28
%Change for mean value -27.2% -33.5% -29.7% -82.3% -97.3% -31.4% -24.2%
Wheat Corn Cotton Potatoes Soy sum WSI
159 108 14.7 4.41 19.3 305 0.28
0.00 0.00 0.00 0.00 0.00 0.00 0.00
35.3 273 11.9 5.14 3.55 329 0.22
35.3 282 11.9 10.3 3.55 343 0.28
-77.8% 152% -18.9% 16.5% -81.6% 7.56% -22.5%
Wheat Corn Cotton Potatoes Soy sum WSI
294 149 0.10 4.03 29.3 477 0.49
0.00 0.00 0.00 0.00 0.00 0.00 0.00
136 45.3 0.03 4.42 7.06 193 0.22
217 67.5 0.03 8.83 15.6 309 0.57
-53.6% -69.7% -70.4% 9.47% -75.9% -59.5% -55.4%
Table 4. Comparison of cropping areas before and after optimization - future scenario (1000Ha)
West
Mid
East
Crop Types Wheat Corn Cotton Potatoes Soy sum WSI
Before OPT 22.9 19.5 34.8 1.21 1.50 80 0.30
Lower Limit 12.0 3.71 0.00 0.00 0.00 15.7 0.09
Mean 13.3 11.3 26.2 0.14 0.33 51.4 0.22
Upper Limit 15.7 12.5 29.1 0.28 0.33 57.9 0.28
%Change for mean value -41.8% -41.9% -24.6% -88.4% -77.9% -35.8% -27.7%
Wheat Corn Cotton Potatoes Soy sum WSI
151 135 13.2 5.10 20.9 325 0.33
30.5 211 15.8 0.00 3.13 260 0.13
30.5 225 15.8 1.05 3.13 275 0.22
56.1 225 103 2.10 7.85 394 0.42
-79.7% 66.4% 20.2% -79.4% -85.0% -15.3% -33.0%
Wheat Corn Cotton Potatoes Soy sum WSI
188 161 0.04 5.08 20.8 375 0.37
0.00 0.00 0.00 0.00 0.00 0.00 0.00
103 162 0.04 3.70 2.06 270 0.22
429 162 0.07 7.41 2.62 601 1.32
-45.3% 0.1% -9.9% -27.1% -90.1% -28.0% -40.3%
From Table 6, in the future climate change scenario, the savings in water use will be larger for the West and Mid regions (34.5 and 33.0%). The major contributions will be the decreased cropping of potatoes and soy. On the contrary, savings will be smaller for the East region (40.3%) compared with the current scenario, and major contributions will be from reduced cropping in soy (90.1%) and wheat (45.3%).
196
www.ccsenet.org/apr
Applied Physics Research
Vol. 6, No. 5; 2014
Table 5. Blue virtual water savings for current scenario (105 m3 )
Wheat Corn Cotton Potatoes Soy Sum
West S 544 370 1103 9.31 72.3 2098
% Change 27.2% 33.5% 29.7% 82.3% 97.3% 30.4%
Mid S 7274 -4755 105 -5.67 444 3063
% Change 77.8% -152% 18.9% -16.5% 81.6% 22.5%
East S 4744 538 0.69 -1.73 215 5495
% Change 53.6% 69.7% 70.4% -9.5% 75.9% 55.4%
East S 2801 -1 0.04 7.43 182 2990
% Change 45.3% -0.1% 9.9% 27.1% 90.1% 40.3%
Table 6. Blue virtual water savings for future scenario (105 m3 )
Wheat Corn Cotton Potatoes Soy Sum
West S 1042 541 844 15.3 92.0 2534
% Change 41.8% 41.9% 24.6% 88.4% 77.9% 34.5%
Mid S 7716 -3078 -123 38.5 624 5177
% Change 79.7% -66.4% -20.2% 79.4% 85.0% 33.0%
3.3 Virtual water transfers Table 7 is the result for virtual water transfers in the current scenario if optimization solutions are adopted. It is noted that the East region will require major virtual water imports (3225 × 105 m3 ), of which wheat and cotton take the larger reductions. On the contrary, the Mid region is a major virtual water export area – an amount of 8209 × 105 virtual water can be exported in total. Additionally, there will still be an extra, remaining virtual water, of 7808 × 105 m3 consisting of virtual water for corn, potatoes, and soy that can be transferred to other areas outside Gansu in addition to exporting to the West and the East regions of Gansu. The majority of virtual water gaps can be filled through virtual water transfers amongst the three regions. However, there will still exist an import requirement of 107 × 105 m3 of virtual water import for wheat in the West region, and 1483 × 105 m3 (186 × 105 m3 of virtual water for wheat and 1297 × 105 m3 of virtual water for cotton) in the East region, which can be transferred from outside the Province. In the future scenario, the import demands are lower for the West and Mid regions, while there will be an increase for the East region (4240 × 105 m3 ). However, the capability of virtual water export will also decrease in the future. In other words, through virtual water transfers, the level of virtual water that still needs to be imported is higher for each region, and the extra remaining level of virtual water that can be exported to outside the Province is lower, in comparison with the current scenario. Table 7. Blue virtual water transfers for current scenario (105 m3 )
West
Mid
East
Crop Type Wheat Corn Cotton Potatoes Soy Sum Wheat Corn Cotton Potatoes Soy Sum Wheat Corn Cotton Potatoes Soy Sum
Import needs -413
-0.16 -15.1 -429
-386
From Mid
Mid Mid
West
-386 -186 -79.6 -2959
-3225
Mid West
Qim 307
0.16 15.1 322
386
Still in needs -107
0.00 0.00 -107
Can be exported
To
Qex
Remaining
To
Qex
Extra Remaining
376 2049
Mid
386
376 1662
East
1662
376 0.00
2425
376
307 7783
West East
307 79.6
0.00 7703
0.00 7703
38.7 80.6 8209
West West
0.16 15.1
38.6 65.5
38.6 65.5 7808
0.00
386
0.00
79.6 1662
-186 0.00 -1297
-1483
16.0 33.8 49.8
197
16.0 33.8 49.8
www.ccsenet.org/apr
Applied Physics Research
Vol. 6, No. 5; 2014
Table 8. Blue virtual water transfers for future scenario (105 m3 ) Crop Type Wheat Corn Cotton Potatoes Soy Sum Wheat Corn Cotton Potatoes Soy Sum Wheat Corn Cotton Potatoes Soy Sum
Import needs -394
From Mid
-394
Qim 98.4
Still in needs -296
98.4
-296
148
0.00
Can be exported
To
Qex
Remaining
To
Qex
631 1706 0.71
Mid
148
631 1558 0.71
East
1558
West
98.4
0.00 7597
0.00 7597
East
16.0
73.6
8.71 73.6 7680
2344 98.4 7597
-148
West
-148
148
-1117
0.00
8.71 89.6 7794
Extra Remaining 631 0.00 0.71 6.28 638
-1117
-3107
West
1558
-1549
-16.0 -4240
Mid
16.0 1574
0.00 -2666
667
667
15.8
15.8
686
686
4. Discussion From the analysis of optimization for cropping patterns through virtual water aspects, the results indicate that current cropping patterns are causing stress on the local water resources, and the objective of saving water and reducing the water stress to an acceptable level can be achieved by adjusting the cropping patterns and introducing virtual water transfers. The selected five crops are basic crops that are necessarily needed to be grown in the three regions. However, existing cropping patterns are mainly based on market value and market demands, rather than environmental concerns. There are many studies showing that water is becoming scarce due to overexploitation of water resources (e.g. Jiang (2009) and Kang et al. (2008)), and strategies need to be considered such as applying water-saving irrigation techniques and deficit irrigation, desalination, and water reuse policies (e.g. Belder et al., 2004), Fereres & Soriano, 2007, and Toze, 2006). Although introducing virtual water to respond to water scarcity, and analyses of water footprint are also mentioned as one of the strategies (e.g. Zheng et al., 2012), there is limited knowledge on how cropping patterns are influencing the allocation of water resources. Through optimizing cropping patterns and transferring virtual water, in fact, a considerable amount of local water does not need to be used, making it available for other uses such as municipal supply. Before optimization, the East region has the highest WaSSI (0.49) although the climate is the least arid amongst the three regions. It is possible for humid areas to have water scarcity, since major water resources can be used for agriculture, industry, and domestic purposes (Molden, 2007; Brown & Matlock, 2011). WaSSI for the West and the Mid regions are moderate (0.29 and 0.28). WaSSI is predicted to remain at the same level for the West region and to slightly increase to 0.33 for the Mid region. WaSSI for the East region will decrease to 0.37 in the future, due to the decreasing cropping areas in the future based on the moving average estimates. However, larger reductions in cropping areas still need to be obtained to attain acceptable water stress. It is noticeable that relatively large reductions in total cropping acreages are required in the East region (55.4% for the current scenario and 40.3% for the future scenario) and for some crops such as soy and potatoes in the West region (approximately 97 and 82%), as well as soy and wheat in the Mid region (approximately 81 and 78%), which seems not to be a feasible solution. The East region has the advantage of a relatively humid climate, and is the major crop contributing area of Gansu Province. However, the crop yield per unit area for crops such as wheat in the East region is only one-third of that in the West region. The West region has more sunshine hours and larger differences in daily temperature, which are helpful for crop growth. Therefore, the volume of water used to produce one kilogram of crop (e.g. wheat) in the East is larger than the volume used in the West region. In this case, inadequate water supply and inappropriate water management lead to excessive WaSSI in the East region. Alternatives include changing the irrigation water supply volumes, and reduce WaSSI to a lesser degree. However, if water supply volumes are increased for irrigation use, there will be shortages for municipal water use; if existing cropping patterns are not changed, there will be failures to meet the expected crop yields, or there would be risks of no irrigation water that can be applied. Large decreases for individual crops result for two reasons – (i) the crop is produced at levels more than local demands (e.g. potatoes and soy in the West region); and (ii) the crop has low economic value for the water used, thus imports of virtual water instead of producing locally are recommended, 198
www.ccsenet.org/apr
Applied Physics Research
Vol. 6, No. 5; 2014
(e.g. wheat and soy in the East region). Although the idea is to lower local cropping by virtual water imports, in order to avoid the huge sudden changes and to create a balance between irrigation water use and municipal water use, it is suggested that the large reduction can be a direction over time. For example, a solution between the mean values and the upper limit values of the FLP solution sets would make more sense than the solution which would change circumstances too rapidly. Research has been showing that climate change will have impacts on irrigation water needs and water resources in the future (e.g. Zhang & McBean,2014; Daz et al., 2007; Arnell, 2004; Christensen et al., 2004). The impacts of increasing volumes of blue virtual water for production are evident in relation to future scenarios, ranging from 3.0% to 60% regarding crop types and regions, and decreases are displayed for several crops as well – e.g. wheat and cotton in the East region. This is consistent with similar studies on impacts of climate change on crop water requirements and irrigation water needs (e.g. Wang et al., 2011; Chung et al., 2011). Water use for existing cropping patterns indicates that the water for major crop production mainly depends on local water resources although water supply stress already exists. These modelling results confirm that Gansu Province has high self-sufficiency in water in the current situation. However, the high self-sufficiency reflects high stress on water resources. Wang et al. (2005) note that self-sufficiency for water has reached 99.52% in 2003 under the situation of water scarcity. The water self-sufficiency of Gansu Province decreased to 97.2% in 2007 (Ge et al., 2011). From this analysis of virtual water transfers, water stress can be reduced and local crop demands can be satisfied by transferring virtual water amongst the three regions. In addition, the remaining virtual water after transfers can be used to produce crops that have a need of virtual water import, or be transported to other areas or to outside the Province for economic benefits. 5. Conclusion The fuzzy linear programming models (FLP) provide a range of possible solutions for cropping patterns to achieve the goals of saving water and attaining acceptable water stress. Cropping patterns were optimized using FLP models for three regions in Gansu Province from the West to the East under two climate scenarios – the current scenario and a future scenario. The results indicate that water is most scarce in the East region, since the irrigation water needs have exceeded the water supply in this region as a result of far too much cropping, in combination with municipal water demands. In this case, the East region is facing the risk of failing to meet the expected crop yields and inadequate applicable irrigation water. Although the East region is the least arid region amongst the three regions, water scarcity is likely to appear due to over-committing of water resources. The results show that water stress is occurring in both current and future scenarios if cropping patterns are not adjusted. Furthermore, existing cropping patterns are resulting in high self-sufficiency in water resources, especially for the East region. The results also show that the optimized cropping patterns can save local water resources to a substantial extent - as high as 50% of current use. Additionally, the deficits after the optimization, can be covered by virtual water transfers amongst the three regions, instead of producing the crops locally. There will still be remaining virtual water for some crops in the three regions which can be exported to other areas, or can be used to produce crops that can be managed by virtual water imports. The East region is the major virtual water import region if the optimization for cropping patterns is adopted, while the Mid region is the major virtual water export region. However, transfers of virtual water for crops such as wheat cannot satisfy local demands among the three regions; virtual water will need to be imported from other areas either in the Province or outside the Province. Huge, sudden changes in cropping patterns are not recommended although the idea is to save local water resources for minimized uses through virtual water transfers for crops. The optimization results can be a direction over time rather than a required change to avoid rapid circumstance changes. References Aldaya, M. M., Mart??nez-Santos, P., & Llamas, M. R. (2010). Incorporating the water footprint and virtualwater into policy: Reflections from the mancha occidental region, spain. Water Resources Management, 24, 941958. http://dx.doi.org/10.1007/s11269-009-9480-8 Allan, J. A. (1998). Virtual water: A strategic resource global solutions to regional deficits. Groundwater, 36, 545-546. http://dx.doi.org/10.1111/j.1745-6584.1998.tb02825.x Arnell, N. W. (2004). Climate change and global water resources: Sres emissions and socio-economic scenarios. Global environmental change, 14, 31-52. http://dx.doi.org/10.1016/j.gloenvcha.2003.10.004. Belder, P., Bouman, B., Cabangon, R., Guoan, L., Quilang, E., Yuanhua, L., Spiertz, J., & Tuong, T. (2004). Effect of water-saving irrigation on rice yield and water use in typical lowland conditions in asia. Agricultural Water 199
www.ccsenet.org/apr
Applied Physics Research
Vol. 6, No. 5; 2014
Management, 65, 193-210. Biswas, A., & Pal, B. B. (2005). Application of fuzzy goal programming technique to land use planning in agricultural system. Omega, 33, 391-398. http://dx.doi.org/10.1016/j.omega.2004.07.003 Brown, A., & Matlock, M. D. (2011). A review of water scarcity indices and methodologies. The Sustainability Consortium, White paper (p. 19). CDO. (2013). Retrieved from http://chinadataonline.org/ Chapagain, A., Hoekstra, A., Savenije, H., & Gautam, R. (2006). The water footprint of cotton consumption: An assessment of the impact of worldwide consumption of cotton products on the water resources in the cotton producing countries. Ecological economics, 60, 186-203. http://dx.doi.org/10.1016/j.ecolecon.2005.11.027. Christensen, N. S., Wood, A. W., Voisin, N., Lettenmaier, D. P., & Palmer, R. N. (2004). The effects of climate change on the hydrology and water resources of the colorado river basin. Climatic change, 62, 337-363. http://dx.doi.org/10.1023/B:CLIM.0000013684.13621.1f. Chung, S., Rodr??guez-D??az, J., Weatherhead, E., & Knox, J. (2011). Climate change impacts on water for irrigating paddy rice in south korea. Irrigation and Drainage, 60, 263-273. http://dx.doi.org/10.1002/ird.559.
Dalin, C., Konar, M., Hanasaki, N., Rinaldo, A., & Rodriguez-Iturbe, I. (2012). Evolution of the global virtual water trade network. Proceedings of the National Academy of Sciences, 109, 5989-5994. http://dx.doi.org/10.1073/pnas.120317610 Dehghan, M., Hashemi, B., & Ghatee, M. (2006). Computational methods for solving fully fuzzy linear systems. Applied Mathematics and Computation, 179, 328-343. http://dx.doi.org/10.1016/j.amc.2005.11.124. D??az, J. R., Weatherhead, E., Knox, J., & Camacho, E. (2007). Climate change impacts on irrigation water requirements in the guadalquivir river basin in spain. Regional Environmental Change, 7, 149-159.
Fan, Y., Huang, G., Li, Y., Cao, M., & Cheng, G. (2009). A fuzzy linear programming approach for municipal solid-waste management under uncertainty. Engineering Optimization, 41, 1081-1101. http://dx.doi.org/10.1080/030521509028 Fereres, E., & Soriano, M. A. (2007). Deficit irrigation for reducing agricultural water use. Journal of Experimental Botany, 58, 147-159. Ge, L., Xie, G., Zhang, C., Li, S., Qi, Y., Cao, S., & He, T. (2011). An evaluation of china’s water footprint. Water resources management, 25, 2633-2647. http://dx.doi.org/10.1007/s11269-011-9830-1. Herrera, F., & Verdegay, J. (1995). Three models of fuzzy integer linear programming. European Journal of Operational Research, 83, 581-593. http://dx.doi.org/10.1016/0377-2217(93)E0338-X. Hoekstra, A. Y., & Chapagain, A. K. (2006). The water footprints of morocco and the netherlands, . Hoekstra, A. Y., & Hung, P. Q. (2005). Globalisation of water resources: international virtual waterflows in relation to crop trade. Global environmental change, 15, 45-56. http://dx.doi.org/10.1016/j.gloenvcha.2004.06.004. Inuiguchi, M., & Ram?k, J. (2000). Possibilistic linear programming: a brief review of fuzzy mathematical programming and a comparison with stochastic programming in portfolio selection problem. Fuzzy sets and systems, 111, 3-28. http://dx.doi.org/10.1016/S0165-0114(98)00449-7.
Jiang, Y. (2009). China’s water scarcity. Journal of Environmental Management, 90, 3185-3196. http://dx.doi.org/10.1016/j.jenvman. Kang, S., Su, X., Tong, L., Zhang, J., & Zhang, L. (2008). A warning from an ancient oasis: intensive human activities are leading to potential ecological and social catastrophe. The International Journal of Sustainable Development & World Ecology, 15, 440-447. http://dx.doi.org/10.3843/SusDev.15.5:5. Klir, G. J., St Clair, U., & Yuan, B. (1997). Fuzzy set theory: foundations and applications. Maleki, H., Tata, M., & Mashinchi, M. (2000). Linear programming with fuzzy variables. Fuzzy sets and systems, 109, 21-33. http://dx.doi.org/10.1016/S0165-0114(98)00066-9. McNulty, S. G., Sun, G., Myers, J. M., Cohen, E., & Caldwell, P. (2010). Robbing peter to pay paul: tradeoffs between ecosystem carbon sequestration and water yield. In Watershed Management (pp. 23-27). http://dx.doi.org/10.1061/41143(394)10. Molden, D. (2007). Water for food, water for life: a comprehensive assessment of water management in agriculture: summary. International Water Management Institute (IWMI).
200
www.ccsenet.org/apr
Applied Physics Research
Vol. 6, No. 5; 2014
NCDC. (2013). Retrieved from http://www7.ncdc.noaa.gov/cdo/cdoselect.cmd Rommelfanger, H. (1996). Fuzzy linear programming and applications. European journal of operational research, 92, 512-527. http://dx.doi.org/10.1016/0377-2217(95)00008-9. Sahoo, B., Lohani, A. K., & Sahu, R. K. (2006). Fuzzy multiobjective and linear programming based management models for optimal land-water-crop system planning. Water Resources Management, 20, 931-948. http://dx.doi.org/10.1007/s11269-005-9015-x. Seckler, D., Barker, R., & Amarasinghe, U. (1999). Water scarcity in the twenty-first century. International Journal of Water Resources Development, 15, 29-42. http://dx.doi.org/10.1080/07900629948916. Tanaka, H., & Asai, K. (1984). Fuzzy linear programming problems with fuzzy numbers. Fuzzy sets and systems, 13, 1-10. http://dx.doi.org/10.1016/0165-0114(84)90022-8. Toze, S. (2006). Reuse of effuent water-benefits and risks. Agricultural water management, 80, 147-159. Wang, H. L., Wang, R. Y., Zhang, Q., Niu, J.-Y., & Lu, X.-D. (2011). Impact of warming climate on crop water requirement in gansu province. Chinese Journal of Eco-Agriculture, 4, 028. Wang, X. H., Xu, Z. M., & Li, Y. H. (2005). A rough estimate of water footprint of gansu province in 2003. Journal of Natural Resources, 6, 015. Zhang, C., & McBean, E. A. (2014). Adaptation investigations to respond to climate change projections in gansu province, northern china. Water Resources Management, 28, 1531-1544. http://dx.doi.org/10.1007/s11269014-0554-x. Zhang, C., McBean, E. A., & Huang, J. (2014). A virtual water assessment methodology for cropping pattern investigation. Water Resources Management, 28, 2331-2349. http://dx.doi.org/10.1007/s11269-014-0618-y. Zheng, Z., Liu, J., Koeneman, P., Zarate, E., & Hoekstra, A. (2012). Assessing water footprint at river basin level: a case study for the heihe river basin in northwest china. Hydrology and earth system sciences, 16, 2771-2781. Zimmermann, H. J. (1978). Fuzzy programming and linear programming with several objective functions. Fuzzy sets and systems, 1, 45-55. http://dx.doi.org/10.1016/0165-0114(78)90031-3 Copyrights Copyright for this article is retained by the author(s), with first publication rights granted to the journal. This is an open-access article distributed under the terms and conditions of the Creative Commons Attribution license (http://creativecommons.org/licenses/by/3.0/).
201