NAVDEEP KAUR. Computer Science and Engineering, National Institute of Technology,. Jalandhar, Punjab 144011, India. MANINDERPAL SINGH.
Navdeep Kaur et al. / International Journal of Engineering Science and Technology (IJEST)
A FUZZY LOGIC APPROACH TO MEASURE THE PRECISE TESTABILITY INDEX OF SOFTWARE NAVDEEP KAUR Computer Science and Engineering, National Institute of Technology, Jalandhar, Punjab 144011, India
MANINDERPAL SINGH Civil Engineering Department, National Institute of Technology, Jalandhar, Punjab 144011, India
Abstract : Many of the software fails as a result of poor quality. For large software projects testing has a deep influence on the overall acceptability and quality of the final software. Testability of the software can be effectively measured form the testability effort and the time required to test the software. In today’s software development environment, object oriented design and development become important. There is strong relationship between the object oriented metrics and the testability efforts in object oriented system. This paper integrate the object oriented metrics used to determine the testability of the software into a single overall value called the Precise Testability Index used to find out the testability efforts for the software project. The value of the Precise Testability Index is determined using the fuzzy logic approach and its concept i.e. Fuzzification of the crisp input metric values, aggregation and inferences and defuzzification to calculate the Precise Testability index. The approach used both the mamdani and the sugeno models of fuzzy logic to arrive at calculation of Precise Testability Index of software project. Keywords: Object Oriented Metrics; Precise Testability Index; Fuzzy Logic. 1. Introduction The significance of quality software is no longer an advantage but a essential feature as software error can have in terms of life, financial loss, or time delays. When dealing with the testing of object oriented software development the lots of questions are faced by the testing team. Why one class to hard to test than other? What makes the code hard to test? There a many definitions for the testing of the software. The most common is the ease of testing i.e. the testing efforts are required to test the software [IEEE (1990)]. A definition in Steve McConnell's Code Complete [McConnell (1993)] similarly divides software into two pieces: internal and external quality characteristics. External quality characteristics are those parts of a product that face its users, where internal quality characteristics are those that do not. The software quality is often described as the “fitness for purpose” of a piece of software. In the context of software engineering [Pressman (2005)], software quality measures how well software is designed with quality, and how well the software conforms to that design (quality of conformance), although there are several different definitions. It is often described as the 'fitness for purpose' of a piece of software. With respect to quality of conformance, quality of design measures how valid the design and requirements are in creating a valuable product [Pressman (2005)]. The definition by Dr. Tom DeMarco says "a product's quality is a meaning of how much it changes the world for the better” [Demarco (1999)]. This can be interpreted as meaning that user satisfaction is more important than anything in determining software quality. A primary principle for testing is to detect software failures so that defects may be discovered and corrected. The scope of software testing often includes examination of code as well as execution of that code in various environments and conditions as well as examining the aspects of code: does it do what it is supposed to do and do what it needs to do. In the current culture of software development, a testing organization may be separate from the development team. There are various roles for testing team members. Information derived from software testing may be used to correct the process by which software is developed [Kolawa (2007)]. Software testability can be easily predicted by using the metrics data. The tester can use this data to find out which piece of code to be focused during testing. The software engineer can use the testing data to refractor his code and build the class that can be reused and easily maintained in future.
ISSN : 0975-5462
Vol. 3 No. 2 Feb 2011
857
Navdeep Kaur et al. / International Journal of Engineering Science and Technology (IJEST)
1.2. Metrics affects the Software Quality Various object oriented metrics are suggested for the object oriented software. These metrics are proposed by [Chidambeer and Kemeerer (1994)]; [Li and Henry (1993)]. The most frequently used measure is the metric suite proposed by Chidambeer and Kemeerer also called the CK metric suite. This metric suite has also been used by the evaluation of many of the projects of NASA [Linda et al. (1998)]. CK have proposed the following 6 metrics – Weighted Method per class (WMC), Response for a class (RFC), Lack of Cohesion among Methods (LCOM), Coupling between Object (CBO), Depth of Inheritance Tree (DIT) and Number of Children (NOC). These metrics are used to measure the various software quality attributes like testability, reliability, usability, maintainability, understandability, complexity etc. In this paper the subset of these metrics are chosen that reflects the testability of the software. The object-oriented metrics that are chosen measure principle structures that, if they are improperly designed, negatively affect the design and code quality attributes. The selected object-oriented metrics are primarily applied to the concepts of classes, coupling, and inheritance. The metrics chose to measure the software quality is Average Cyclomatic Complexity (ACC), CBO, RFC and DIT. The descriptions of each metric chosen to measure the testability index of software are given in Table 1. This table describes how to define these metrics and their impact on the software quality. Table 1
Object Oriented Metrics for Testability
Metric Response for Class (RFC)
Description The RFC is the count of the set of all methods that can be invoked in response to a message to an object of the class or by some method in the class. This includes all methods reachable within the class hierarchy. If a large number of methods can be invoked in response to a message, the testing and debugging of the class becomes difficult in view of the fact that it requires a better level of from the test engineer side [Tang et al. (1999)].
Depth of Inheritance Tree (DIT)
Within the inheritance ladder, the depth of class is the maximum length from the class node to the root of the tree and is measured by the number of forerunner classes. If a class is deeper in hierarchy, it is most likely that it inherit more methods making it difficult to predict the behavior of class. Deeper trees amount to greater design complexity, as more methods and classes are involved but the greater the probable for reuse of inherited methods.
Average Cyclomatic Complexity (ACC) Coupling between Object Classes (CBO)
The Average Cyclomatic complexity is used to assess the complexity of an algorithm. The Cyclomatic complexity of individual methods in a class is measured to evaluate the ACC for class. A method with low average Cyclomatic complexity is superior because it leads to increased understandability and decreased testing effort of code. CBO is a count of the number of other classes to which a class is coupled. It only concerned with the non-inheritance related class hierarchies on which a class depends. Tremendous coupling is destructive to modular design and prevents reuse. The more self-directed a class is, the easier it is reuse in another application. The larger the number of couples, the higher the sensitivity to changes in other parts of the design and therefore maintenance is more difficult. Strong coupling makes a system complicated as a module is harder to understand, change or correct by itself if it is coupled with other modules and difficult to test. Modular solution should be such that it exhibits low coupling and high cohesion.
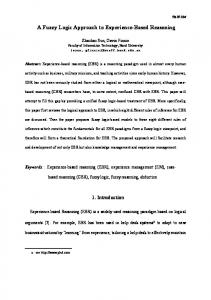
1.3. Evaluation of Object-Oriented Metric In order to understand the concept of object oriented metrics and how the recommended metrics could be applied to the software [Linda et al. (1998)], the example in Figure 1 was developed. Convex Set, which is the set of all geometric figures, is a super class. Convex Set has an operation to draw the specified figures and uses drawing methods found in another super set not shown here. From this, we can develop two subclasses, polygon and ellipse; these become classes since they have children objects that are subclasses. Polygon contains a method to calculate the perimeter. This equation is accessible to all child objects. Following the hierarchy to equilateral, through inheritance it is known that convex set is a closed figure of straight lines (polygon) with 3 sides and sum of the interior angles is 180 (triangle). If we create an equilateral triangle with the side length of 5, it is called an instantiation of the equilateral object. Since the object EQUILATERAL is a child of TRIANGLE/POLYGON, the formula for the perimeter is accessible. (A message is used to transfer the value to the equation so the perimeter can be calculated.) From TRIANGLE, the attribute of 3 sides is inherited. Since EQUILATERAL has the attribute that all sides are equal, the equation for the perimeter will be modified to 3 times the length of the side. Before applying the equation,
ISSN : 0975-5462
Vol. 3 No. 2 Feb 2011
858
Navdeep Kaur et al. / International Journal of Engineering Science and Technology (IJEST)
an instantiation of the TRIANGLE object must be created. This is where the actual value is assigned and the length of the side, X, is stored.
Fig 1. Geometric Classes with Attributes, Operations and Methods
The pseudo code to determine the perimeter of an equilateral triangle in given in Fig 2. STEPS: Create instantiation of equilateral triangle Assign the length of side=X Send message to class POLYGON for perimeter equation If X>0 Then Perimeter=3*X Else send error message Fig 2. Method for perimeter of equilateral triangle
1.3.1. Average Cyclomatic Complexity (ACC) This is an evaluation of the algorithm using a count of the number of test paths. There is one vertical path that spits into a second possible path, giving the method a average cyclomatic complexity of 2. 1.3.2. Response for a Class (RFC) Using the POLYGON class, for perimeter, 5 objects could invoke that method, and the method area (in TRIANGLE) could invoke 3 messages, so the RFC for POLYGON is 8. Class: POLYGON = number of messages for method (perimeter) = 5 + number of messages for method (area) = 3 ==> RFC = 8. 1.3.3. Coupling between Object Classes (CBO) CBO is measured by counting the number of non-inherited related class hierarchies on which a class depends. For the class Polygon, all coupling is within the class (messages to inherited methods do not count), so the CBO = 0.
ISSN : 0975-5462
Vol. 3 No. 2 Feb 2011
859
Navdeep Kaur et al. / International Journal of Engineering Science and Technology (IJEST)
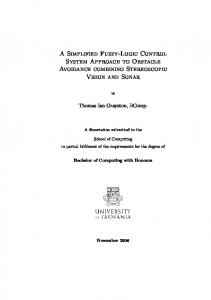
1.3.4. Depth of Inheritance Tree (DIT) The depth is measured by the maximum length from the class to the root of the tree. For POLYGON, DIT = 2, it is 1 level below the CONVEX SET. For TRIANGLE, DIT = 1. 2. Proposed Model All of the four metrics measures the different aspects of software quality and reflects the different properties of software quality. They can be easily measures manually by hand using the method discussed above or with the help of the automated tools like JHawk. No one only can reflect the reliable quality of the software therefore some integrated means are required to combine them into a single output. The model to predict the Precise Testability Index (PTI) of the software was built using the fuzzy logic [Gupta et al. (2005)] approach shown in figure 3. The Mamdani Model of Fuzzy Logic is used to find out the Mamdani Testability Index (TI) [Gupta et al. (2005)] and Sugeno Model of Fuzzy Logic is used to find out The Sugeno Testability Index. From these the Precise Testability Index of the software is calculated as the mean of the testability index from Mamdani Model and the Sugeno Model as shown in fig 3.
Fig 3. Proposed Model
To handle the doubtful, contradicting and divergent options, the fuzzy model is the best option [16]. All of the above suggested metrics are subjective in nature and due to the properties of fuzzy model; it is able to incorporate their relative impact on software testability. Fuzzy logic is a superset of Boolean logic [19] that handles the concept of partial true and partial false values between "completely true" and "completely false". A fuzzy subset F of a set S can be defined as a set of ordered pairs, each with a first element that is an element of the set S, and a second element that is a value in the interval [ 0, 1 ], with exactly one ordered pair present for each element of S. This defines a mapping between elements of the set S and values in the interval [0, 1]. The value zero is used to represent complete non-membership, the value one is used to represent complete membership, and values in between are used to represent intermediate degrees of membership. Fuzzy model consist of four modules. The first module is the fuzzification that transforms the crisp value(s) into the fuzzy values. The fuzzy values are inferences based upon the rule base incorporate in knowledge based. These rules are supplied by the domain expert(s). All the outputs obtained from the inference engine are integrated and defuzzied by the defuzzification module that transform the fuzzy output to crisp value(s). This section discusses the Sugeno, or Takagi-Sugeno-Kang, method of fuzzy inference. Introduced by Sugeno in 1985, it is similar to the Mamdani method in many respects. The first two parts of the fuzzy inference process, fuzzily the inputs and applying the fuzzy operator, are exactly the same. The main difference between Mamdani and Sugeno is that the Sugeno output membership functions are either linear or constant.
3. Working of Model First all the crisp values of four inputs are taken and degree to which each belongs to the membership function is determined [Patvra (1996)]. A membership function (MF) is a curve that defines how each point in the input space is mapped to a membership value (or degree of membership) between 0 and 1. The 0 value represents the completely out membership; 1 value represents the completely in membership; and all other values between 0 and 1 represents the intermediate membership. The input space is sometimes referred to as the universe of discourse. Depending upon the input values some rules from the knowledge based are get executed. All the inputs are considered parallel and combined with AND operator. The MIN membership operator is used to find out degree of membership of firing. The both Mamdani and Sugeno inference engines are used to determine the degree of membership of firing. The technique used to defuzzification is the centroid that transforms the fuzzy
ISSN : 0975-5462
Vol. 3 No. 2 Feb 2011
860
Navdeep Kaur et al. / International Journal of Engineering Science and Technology (IJEST)
values to the crisp value. After getting the Testability Index from both the inference engines, the mean of values is taken that represents the Precise Testability Index for the Object Oriented Software. PTI= ( TI ( Mamdani ) + TI ( Sugeno ) ) / 2 (1) 3.1. Membership functions for input metrics The curves for the membership functions are defined by the domain expert(s) [Gupta et al. (2005)]. The input metric ACC is divided into three stages Low, Medium and High as in fig 4. The input metric CBO is divided into three stages Preferred (PR), Acceptable (AC) and Not Acceptable (NA) as in fig 5. The input metric DIT is divided into three stages PR, AC and NA as in fig 6. The input metric RFC is divided into three stages PR, AC and NA as in fig 7.
Fig 5: Membership Function for CBO
Fig 4: Membership Function for ACC
Fig 6: Membership Function for DIT
Fig 7: Membership Function for RFC
3.2. Rule Based for the Proposed Model In this proposed model four input metrics are considered with each metric is defined by the three membership functions therefore rule based consist of all the possible combinations i.e. 34 = 81 rules. Table 2. Rule Based for Model
#Rule 1 2 . . 27
CBO PR Low . . NA
ACC Low Low . . High
DIT PR Med . . NA
RFC PR AC . . NA
TI Low Low . . High
3.3. Membership Grade Assignment to Testability Index The following example illustrates how the membership grade is assigned to TI. The inputs are fed to the fuzzification module and after Fuzzification of given values we find that CBO=2 belongs to fuzzy set PR with membership grade 1, CC = 8 belongs to fuzzy set high with membership grade 1, DIT = 2 belongs to fuzzy set AC and NA with membership grade 0.5 and RFC = 40 belongs to the fuzzy set AC with membership grade 1. With these input values the following rules get fired.
ISSN : 0975-5462
Vol. 3 No. 2 Feb 2011
861
Navdeep Kaur et al. / International Journal of Engineering Science and Technology (IJEST)
Table 3: Membership grade is assigned TI
CBO (2)
CC (8)
DIT (2)
RFC (40)
Membership grade of TI
PR
High
AC
AC
MIN [ 1,1,0.5,1 ] = 0.5
PR
High
NA
AC
MIN [ 1,1,0.5,1 ] = 0.5
Both rules give the testability value Low to an extent of 0.5. Testing index can be used to estimate testability of software unit in the object oriented system and having confidence in software quality and at same time to ensure that software get delivered within the cost and schedule. After that Precise Testability Index is calculated and lower the value of Precise Testability Index indicates the lower testing efforts. 3.4. Defuzzification The model is built using the Matlab tool for the fuzzy logic. The centroid technique of defuzzification is used. TI is calculated from both the models and PTI is calculated as mean of the TI obtained from the mamdani and fuzzy model as in Eq. 1. This is calculated in Mat Lab by using the following functions: readfis( ), evalfis( ) and mean( ). readfis( ): Load an FIS from the disk. Syntax: fismat = readfis ( ' filename ' ) ; Description: Read a fuzzy inference system from a .fis file (named filename) on the disk and bring the resulting file into the workspace.fismat = readfis (no input arguments) opens a getfile dialog box to assist with the name and directory location of the file. evalfis( ): Perform fuzzy inference calculations. Syntax: output = evalfis ( input , fismat ) ; Description: evalfis has the following arguments: input: a number or a matrix specifying input values. If input is an M-by-N matrix, where N is number of input variables, then evalfis takes each row of input as an input vector and returns the M-by-L matrix to the variable, output, where each row is an output vector and L is the number of output variables. fismat: an FIS structure to be evaluate. output: the output matrix of size M-by-L, where M represents the number of input values specified above, and L is the number of output variables for the FIS. mean( ): For vectors, mean (x) is the mean value of the elements in x. Syntax: output= mean (x) Description: calculate the mean of input arguments and returns the result in output. Consider the ACC=1.67, RFC=32, CBO=3 and DIT=0. a=readfis( ). From the getfile dialog box select the .fis file for Mamdani Testability Index Fuzzy Model. b=evalfis ([ 1.67 32 3 0 ] , a ) it gives b = 1.53 c= readfis( ). From the getfile dialog box select the .fis file for Sugeno Testability Index Fuzzy Model. d=evalfis( [ 3 1.67 0 32 ] , c ) it gives d = 1.3 e = [b d] PTI=mean (e) it gives value of PTI is 1.50. Low value indicates less testing efforts required to test the class. 3.5. Inference Output Surface view gives a two-dimensional curve that represents the mapping from two input variables ACC and CBO and output parameter TI. The following fig 8 and fig. 9 represents the surface view from Mamdani and Sugeno model respectively.
ISSN : 0975-5462
Vol. 3 No. 2 Feb 2011
862
Navdeep Kaur et al. / International Journal of Engineering Science and Technology (IJEST)
Fig 8. Surface View for TI (Mamdani)
Fig 9. Surface View for TI (Sugeno)
4. Results and Discussion The input data for the calculation of testability index is derived from [Gupta et al. (2005)]. The value of all four metrics is computed for each of the 14 java classes. The value of metrics for these classes is computed with the help of JHawk tool. The values of the input metrics for 3 classes are as below in Table 4. The corrosponding output metric is shown is Table 5. The last column indicates the testing time required to test the class. From the value of PTI it is clear that a class with lesser value of PTI indicates lesser time to testing and with higher value of PTI indicates higher time to testing and needs to be reconsidered.
Table 4.
Values of Input Metrics
#
Class
ACC
RFC
CBO
DIT
1
BussinessReportHandler
1.67
32
3
0
2
CombinedSchIIReportHandler
0.33
13
3
2
3
CombineReportHandler
0.3
12
1
0
4
AgingCashSchIIReportDAO
7.5
37
4
0
5
AuditCashSchIIReportDAO
7.5
38
4
0
6
BussinessMasterDAO
3.4
38
6
1
7
BussinessMasterReportDAO
2
22
4
1
8
BussinessMetricDataEntryDAO
6
60
19
2
9
BussinessReportDAO
4.8
35
8
0
10
CombinedSchIIReportDAO
7.5
37
4
2
11
CombineReportDAO
7.5
36
3
0
12
ExcelUploadDAO2
2
30
3
0
13
GeneralDataDAO
3.2
30
8
1
14
GroupMasterDAO
7.6
40
9
1
ISSN : 0975-5462
Vol. 3 No. 2 Feb 2011
863
Navdeep Kaur et al. / International Journal of Engineering Science and Technology (IJEST)
Table 5.
#
Class
1
Values of Output Metric Computed from Model
TI (Sugeno)
PTI
Hours
BussinessReportHandler
TI (Mamdani ) 1.71
1.3
1.5
2
2
CombinedSchIIReportHandler
1.74
1.5
1.62
3
3
CombineReportHandler
1.53
1
1.26
2
4
AgingCashSchIIReportDAO
4.5
5
4.75
4
5
AuditCashSchIIReportDAO
4.5
5
4.75
4.5
6
BussinessMasterDAO
4.5
5
4.75
5
7
BussinessMasterReportDAO
1.71
1.3
1.51
2
8
BussinessMetricDataEntryDAO
6.35
8.75
7.55
8
9
BussinessReportDAO
4.5
5
4.75
9
10
CombinedSchIIReportDAO
4.5
5
4.75
2.5
11
CombineReportDAO
2.71
2.5
2.61
2
12
ExcelUploadDAO2
1.78
1.3
1.54
2
13
GeneralDataDAO
4.5
5
4.75
2
14
GroupMasterDAO
6.18
10
8.09
15
5. Conclusion and Future Scope The Fuzzy models called Testability Index Mamdani Fuzzy Model and The Testability Index Sugeno Fuzzy Model was developed. The value of Testability Index is calculated from the corresponding fuzzy models. The new metrics that are proposed in this paper is the Precise Testability Index. The value of Precise Testability Index is mean of the Testability Index obtained from the Mamdani and Sugeno Testability Index Fuzzy Models i.e. PTI = ((TI (Mamdani) +TI (Sugeno))/2. In future we can plan an extensive validation of our metric suite in a variety of different industrial environments and collect data to analyze the reliability growth based on the failures encountered during testing. We can refine the metric suite by adding and deleting some of the metrics as per industry requirement. Focusing on a particular data set is performed to develop an accurate model since our work focused on developing a model which can predict more accurate. The results have shown that the developed model can predict accurate results in most points of the target dataset. We can build the user interface for the model to make it more users friendly. Acknowledgment I wish to express my deepest gratitude to Er. Sunint Saini Khalsa (Associate Professor, Computer Science and Engineering, GNDEC, Ludhiana) for helping me with hes experienced and professional ideas to reach where I am today and still showing the light to excel. Words fail the author to express her deep sense of gratitude towards her family members for their moral and financial support and encouragement without which the author would not have been able to bring out this paper. References [1] [2]
Basili V.; Briand L.; W. Melo W., (1996): A Validation of Object Oriented Design Metrics as Quality Indicators, IEEE Transactions on Software Engineering, 22, pp. 751-761. Chidamner S.R; .Kermer C.K., (1994): A metric suite for object-oriented design, IEEE Transaction on Software Engineering, pp. 476493.
ISSN : 0975-5462
Vol. 3 No. 2 Feb 2011
864
Navdeep Kaur et al. / International Journal of Engineering Science and Technology (IJEST)
[3] [4] [5] [6] [7] [8] [9] [10] [11] [12] [13] [14] [15] [16] [17] [18] [19]
DeMarco T., (1999): Management Can Make Quality (Im)possible, Cutter IT Summit, Boston. Fuzzy Logic: Theory and Applications. Prentice Hall of India, New Delhi. George; Klir J.; Yuan B. (2000), Fuzzy set and Fuzzy Logic, New Delhi. Gupta V., Aggarwal K.K and Singh Y. (2005): A Fuzzy Approach for integrated measure of Object Oriented Testability, Journal of Science 1(2): 276-282, ISSN 1549-3636. Gyimóthy T., Ferenc R. and Siket I. (2005): Empirical validation of object-oriented metrics on open source software for fault prediction. IEEE Trans. Software Eng., 31(10): pp. 897-910. IEEE Standards Glossary of Software Engineering Terminology, IEEE Computer Society,1990. Kolawa A., Huizinga D., (2007): Automated Defect Prevention: Best Practices in Software Management, Wiley-IEEE Computer Society Press, pp. 41–43. Li W.; Henry S., (1993): Object Oriented Metrics that predict maintainability, J. Systems and Software, pp.111-112. Linda, H. Rosenberg, R. Stapko and A. Gallo, (1998): Risk-based Object Oriented Testing”, NASA,GSFC SATC NASA, Unisys code 301 Code 301.1. Lorenz M.; Kidd J. (1994): object oriented metrics, Prentice Hall publishing. Marek, J. Patyra M.J.; Grantner L.J; Koster K.(1996): Digital Fuzzy logic controller: Design and Implementation, IEEE Transaction on Fuzzy Systems, 4: 439-459. McConnell S. (1993): Code Complete , First ed., Microsoft Press. Patyra, J.; Mlynek D.M. (1996): Fuzzy Logic Implementation andApplications”, John Wiley and Sons Ltd. And B.G. Teubner. Pressman R.; Scott (2005a): Software Engineering: A Practitioner's Approach ,Sixth International ed., McGraw-Hill Education, pp. 746. Pressman R.; Scott (2005b): Software Engineering: A Practitioner's Approach , Sixth International ed., McGraw-Hill Education, pp. 388. Tang M.H.; Kao M.H.; Chen M.H., (1999): An Empirical Study on Object-Oriented Metrics, Sixth International Software Metrics Symposium (METRICS'99), pp.242. Wang, L.X., (1994): Adaptive fuzzy systems and control: design and stability analysis, Prentice Hall
ISSN : 0975-5462
Vol. 3 No. 2 Feb 2011
865