to predicting the MSCI EURO index based on content analysis of ECB statements. ... while greedy forward selection enables an accuracy on the test .... statement consists of questions and answers from the press .... partition matrix U = [μk i ].
A Fuzzy Model of a European Index Based on Automatically Extracted Content Information Viorel Milea∗ , Rui J. Almeida∗ , Uzay Kaymak∗† , Flavius Frasincar∗ ∗ Econometric
Institute Erasmus School of Economics Erasmus University Rotterdam P.O. Box 1738 3000 DR Rotterdam the Netherlands Email: {milea, almeida, frasincar, kaymak}@ese.eur.nl † Industrial Engineering Department Technical University of Eindhoven the Netherlands Abstract—In this paper we build on previous work related to predicting the MSCI EURO index based on content analysis of ECB statements. Our focus is on reducing the number of features employed for prediction through feature selection. For this purpose we rely on two methodologies: (stepwise) linear regression and greedy forward feature subset selection. The original dataset consists of 13 features (General Inquirer content categories). Both methodologies provide an improvement in the overall accuracy of the model, while reducing the number of features employed. Through linear regression we achieve an accuracy of 67.58% on the testing set by relying on six features, while greedy forward selection enables an accuracy on the test set of 69.50% while relying on eight features.
I. I NTRODUCTION An important part of the information that is made available to the public by different institutions, such as the European Central Bank, is presented in text format. Different interested parties, such as analysts and financial traders, follow such information and incorporate the knowledge that is being communicated into their actions. However, the sources of information are numerous, and processing them comes with a time cost. One of the most interesting current challenges in this context relates to automatically extracting meaning, i.e., in the form of content, or sentiment, from textual information. Additionally, the extracted meaning should be employable in a practical context, such as determining the opinion on a new product, or help in forecasting variable(s). In this paper we build upon previous work [1], [2] towards extracting content from European Central Bank (ECB) statments. These statements have been published monthly since June 1998, and contain, next to an overview of key interest rates for the coming month, an extensive overview of the past state of the economy, as well as economical expectations regarding the future. Our results in previous work indicate that this information can be employed towards forecasting the state of the European economy, and we have shown that based on the content of ECB statements we can predict up or down movement in the MSCI EURO index.
In this paper we look deeper into whether all content categories that have been (manually) selected in previous work do indeed have an influence on the MSCI EURO index. For reducing the number of features we rely on two methodologies: (stepwise) linear regression and greedy forward feature subset selection. Both methods lead to a reduction in the number of features we employ in the model and, in the same time, an increase in the accuracy of the fuzzy model in predicting upward or downward movement in the MSCI EURO index. The outline of the paper is as follows. In Section II we present an overview of work related to our current endeavour. Section III details the selection of the data as well as the data processing steps. The fuzzy model is described in Section IV. In Section V we describe the feature selection process that we use for reducing the number of content categories used as input. The results we obtain, as well as a discussion of these results, are also presented. We conclude in Section VI. II. R ELATED W ORK In this paper we build on previous work [1], [2] related to the prediction of the MSCI EURO index based on ECB statements. In [1] we present an approach that is based on employing the frequencies of words across 13 General Inquirer (GI) content categories for predicting up and down movement in the index. A more expressive approach towards the same goal is presented in [2] where rather than focussing on the frequencies of individual words, the authors employ fuzzy grammar fragments [3]–[5]. Both works show that the movement in the MSCI EURO index can be predicted based on the content of ECB statements. The first attempt at content analysis in an economic context is presented in [6]. Here, the authors investigate the relationship between focus on wealth and wealth-related words in the speeches of the German Emperor and the state of the economy over the period 1870-1914. They find a strong relationship between the focus on wealth and the state of the German economy. More recent research, such as [7], relies
on the GI dictionary for explaining market prices and trading volumes. The author finds that a relationship exists between a daily Wall Street Journal column, ‘Abreast of the Market’, and the market prices and trading volumes of that day for the stocks discussed in the column. In [8] the authors develop a method for the automated extraction of basis expressions that indicate economic trends. They are able to classify positive and negative expressions which hold predictive power over economic trends, without the help of a dictionary. Other research has focussed on the extraction of sentiment from free text in an economic context. In [9] the authors focus on eight dimensions of sentiment: Joy, Sadness, Trust, Disgust, Fear, Anger, Surprise and Anticipation, and are able to provide visualizations of how these eight sentiments evolve over time on some concept, e.g., Iraq, based on news messages. The results are validated against ratings of human reviewers of the news messages, and the method performs satisfactorily in visualizing the evolution of these sentiments over time regarding the studied concepts. Staying in the realm of sentiment mining, we signal an approach in [10] related to the extraction of term subjectivity and orientation from text. The approach starts with two training sets consisting of Positive and Negative words, respectively. It extends these two sets with WordNet synonyms and antonyms of the words found in the sets. Next, a binary classifier is generated by a supervised learner that is able to categorize vectorized representations of terms and classify them as Positive or Negative. Extraction of fuzzy sentiment is done in [11], where the authors are able to assign a fuzzy membership of Positive or Negative to a set of words using the Sentiment Tag Extraction Program (STEP). The approach we present in this paper differs from the above approaches in that it relies on selected content categories from GI, and employs a fuzzy model for the prediction of movements in the MSCI EURO index. Rather than focussing on sentiment, we select a total of thirteen categories from GI and employ the percentages of words that fall under those categories as document fingerprints for the individual ECB statements. By using a fuzzy model, we are able to investigate how each category impacts the index, and draw economic conclusions from here. This is different from the approach that stands closest to the research outlined in this paper, namely [7], as it does not aggregate all content categories into one single indicator, thus losing the ability to question the impact of the different content categories on the explanandum. Finally, current work presents feature selection performed on the content categories selected from General Inquirer. Through this process, we select a subset of relevant content categories with the purpose of improving the robustness of our model. Feature selection algorithms can be characterized under two types, feature ranking and subset selection. We focus on subset selection, where we search for the optimal subset of features, i.e., content categories [12]. Subset selection algorithms can further be divided into wrappers and filters. While wrappers evaluate each possible subset of features in the search space against a model, filters do not rely on a
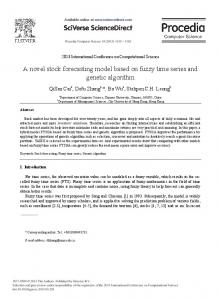
performance measure that requires a model [13]. III. DATA P ROCESSING In this section we provide an overview of the data we employ for our goal and the model we design. In the first part, an overview of the used data is provided. The second part focusses on steps that are needed to prepare the data from which fuzzy model can be developed. In our approach, we require data from two different sources. On the one hand, we employ ECB statements available from the ECB press website [14]. Additionally, we employ the MSCI EURO index, available from the Thomson One Banker website [15]. As the index is available starting from 31 December 1998, we select both the statements and the index values for the period 1 January 1999 to 31 December 2009. An ECB statement as employed for our current purpose consists of different parts. The first part deals with the key ECB interest rates and their levels for the coming months. The following four parts deal with the economic and monetary analysis, as well as the fiscal policies and structural reforms. These first five parts are considered relevant for the question at hand. Finally, approximately the second half of an ECB statement consists of questions and answers from the press directed towards the president of the ECB. For the current scope, we consider the Q&A part of an ECB statement relevant only indirectly, and only focus on the part describing the current and expected future state of the economy. The relevant parts of the ECB statements for the selected period are extracted by using an HTML wrapper from the ECB press website. Upon successful extraction, each statement is annotated for parts of speech using the Stanford POS Tagger [16], [17]. Based on the part of speech annotation, we extract only the adjectives from the text. It should be noted that all ECB statements, at least in the part we consider relevant for the current purpose, follow a similar structure. For this reason, we believe that the adjectives in the text could provide a good discrimination among the different statements. Upon creating, for each ECB statement from the relevant period, the set of all adjectives contained in the text, the data are fed to the General Inquirer web service. Based on this input, GI is able to generate a document fingerprint consisting of the percentages of words from the document that fall under each category supported by GI. GI currently supports over 300 content categories, but for our current purpose we only focus on 13 of them, namely [18]: • • • • • • • •
Positiv, consisting of 1045 positive words, Negativ, made up of 1160 negative words, Strong, consisting of 1902 words implying strength, Weak, containing 755 words implying weakness, Ovrst, consisting of 696 words indicating overstatement, Undrst, containing 319 referring to understatement, Need, made up of 76 words related to the expression of need or intent, Goal, consisting of 53 words referring to end-states towards which muscular or mental striving is directed,
HTML Wrapper
Stanford POS Tagger
General Inquirer
Rk : If x is Ak then y k = (ak )T x + bk , FIS
T1B MSCI EURO
ECB
Fig. 1.
Data processing steps
Try, containing 70 words indicating activities taken to reach a goal, • Means, made up of 244 words denoting what is utilized in attaining goals, • Persist, 64 words indicating endurance, • Complet, consisting of 81 words indicating the achievement of goals, • Fail, which consists of 137 words that indicate that goals have not been achieved. By feeding the adjectives from each relevant ECB statement to GI, we obtain a matrix of percentages that indicate for each document, for each content category, the percentage of words in that document that fall under that category. Upon generating this matrix, we normalize using min-max normalization across each content category. This resumes to applying Equation 1 individually to each datapoint, for each variable in the dataset (note that the min and max operations are applied over all values of each variable). •
xi = (xi − min(x))/(max(x) − min(x)),
(1)
(2)
where Rk is the k-th rule in the model rule base, x = [x1 . . . , xn ]T is the antecedent variable and Ak = Ak1 , . . . , Akn are the fuzzy sets corresponding to the antecedent variables. The rule consequent y k is an affine combination of the parameter vector ak , and the scalar offset bk . The consequents of the affine TS model are hyperplanes in the product space of the inputs and the output. To form the fuzzy system model from the data set with N data samples, given by the regressor X = [x1 , x2 , . . . , xN ]T and the regressand Y = [y1 , y2 , . . . , yN ]T where each data sample has a dimension of n (N >> n), the structure is first determined and afterwards the parameters of the structure are identified. The number of rules characterizes the structure of a fuzzy system. In this study the number of rules is the same as the number of clusters. Fuzzy clustering in the Cartesian product-space X × Y is applied to partition the training data into K clusters. The partitions correspond to the characteristic regions where the system behavior is approximated by local linear models in the multidimensional space. In this work, we use the fuzzy c-means (FCM) [22] algorithm. As result of the clustering process, we obtain a fuzzy partition matrix U = [μki ]. The fuzzy sets in the antecedent of the rules are identified by means of the matrix U that have dimensions [N × K], where K is the number of rules in the rule base. One dimensional fuzzy sets Akj are obtained from the multidimensional fuzzy sets by projections onto the space of the input variables xi . This is expressed by the point-wise projection operator of the form μAkj (xi ) = projj (μki ),
(3)
where xi is the i-th datapoint for variable x. Finally, we obtain the data on the MSCI EURO index from Thomson One Banker (T1B). We extract monthly, end-ofmonth data for the period January 1st 1999 until December 31st 2009. An overview of the all the data processing steps is provided in Figure 1.
after which the pointwise projections are approximated by Gaussian membership functions. When computing the degree of fulfilment βk (x) of the kth rule, the original cluster in the antecedent product space is reconstructed by applying the intersection operator in the Cartesian product space of the antecedent variables:
IV. T HE F UZZY M ODEL
βk (x) = μAk1 (x1 ) ∧ μAk2 (x2 ) ∧ . . . ∧ μAkp (xp ).
Several techniques can be used in fuzzy identification. One possibility is to use identification by product-space clustering to approximate a non-linear problem by decomposing it into several subproblems [19], [20]. The information regarding the distribution of data can be captured by the fuzzy clusters, which can be used to identify relations between various variables regarding the modelled system. Takagi and Sugeno (TS) [21] fuzzy models are suitable for identification of nonlinear systems and regression models. In this work, we address the prediction of the MSCI EURO index as a regression model. A TS model with affine linear consequents can be interpreted in terms of changes of the model parameters with respect to the antecedent variables as well as in terms of local linear models of the system. An affine TS model has the following structure:
(4)
Other t-norms, such as the product, could also be used instead of the minimum operator. The consequent parameters for each rule are obtained by means of linear least square estimation, which concludes the identification of the classification system. After the generation of the fuzzy system, rule base simplification and model reduction could be used [23], but we did not consider this step in our current study. V. F EATURE S ELECTION ON C ONTENT C ATEGORIES In this section we detail upon the feature selection performed on the ECB dataset. The setup of our experiments, with a focus on the fuzzy model, is oulined in Section V-A. The feature selection process and the corresponding results are described in Section V-B. We provide a discussion of these results in Section V-C.
TABLE I C LASSIFICATION ACCURACY AS A FUNCTION OF NUMBER OF CLUSTERS No. of clusters 2 3 4 5 6 7 8 9 10
TABLE II R EGRESSION COEFFICIENTS
Avg. Accuracy (%) 63.42 59.47 57.11 56.50 54.58 53.56 52.39 52.47 53.69
Content Category Positiv Negativ Strong Weak Ovrst Undrst Need Goal Try Means Persist Complet Fail
A. Experimental Setup For the experiments, we used a dataset of 122 ECB statements, from the period January 1st, 1999 until December 31st, 2009. For each experiment, a random sample consisting of 70% of the dataset is selected for the purpose of training, while the remaining 30% is employed for testing. The generated output of the system consists of the predicted level of the MSCI EURO index at the end of the month. However, our focus is on predicting whether the index will move up or down by the end of the month. For this purpose, we compare the predicted value with the known previous value of the index (the value of the previous month), and transform the generated output into a prediction of whether the index will be up or down by the end of the month. In order to limit the effects of an economic crisis on the model, the training data are randomly selected, and the accuracy of the model is tested on the remaining data. We repeat this procedure 100 times, generating random training and testing sets each time, where the training set comprises 70% of the dataset, and the testing set the remaining 30%. We set the number of clusters for the fuzzy model to 2. The number of clusters is determined through experimenting with different number of clusters in the fuzzy model, by employing all 13 variables, as displayed in Table I. We assume that, for a smaller number of content categories, the number of clusters will not increase, and thus perform all experiments with two clusters.
Coefficient -0.2161 -0.4574 0.2436 -0.4492 0.0184 -0.1670 0.0672 -0.1422 0.0177 0.0416 -0.1284 -0.3919 -0.0023
TABLE III R EGRESSION STATISTICS Statistic R2 F-value p-value
Value 0.6485 15.3260 < 10−4
words across each content category) as regressors. The regression coefficients that we obtain for a multiple linear regression applied to the previously described regressand and regressors are presented in Table II. Note that both the regressor, as well as the regressand, are normalized prior to the calculation of the regression coefficients. The statistics of the regression are presented in Table III. As can be observed from this table, the model obtained through multiple linear regression is significant, apparent from the relatively high F-value, with a corresponding p-value of 0. We plot the regression coefficients, from highest to lowest, in Figure 2, in an attempt to identify a possible “elbow”, i.e., the optimal number of variables to be included in the model based on the values of the regression coefficients. As visible from Figure 2, no such point can be identified, thus providing no indication for removing any of the variables already included in the model. For this reason, we move on
B. Feature Selection 0.45 0.4 0.35 Regression Coefficient
In this section we describe the feature selection process that enables us to reduce the number of GI content categories employed for modelling the MSCI EURO index. As previously stated, the 13 content categories that we employ in this study have been manually selected based on the content type they describe. For this reason, some form of feature selection should be employed on the 13 content categories in order to ensure that all categories are relevant in making predictions on the index. We focus on two methods for this purpose, namely linear regression and greedy forward search by employing the fuzzy model. 1) Linear Regression: Feature selection can be performed by relying on linear regression [24], [25], where the actual levels of the MSCI EURO index are used as regressand, and the document fingerprints (consisting of the frequencies of
0.3 0.25 0.2 0.15 0.1 0.05
Negativ Weak CompletStrong Positiv Undrst Goal Persist Need Means Ovrst Content Categories
Fig. 2.
Regression coefficients
Try
Fail
TABLE IV S TEPWISE REGRESSION STATISTICS Value 0.6345 33.2677 < 10−4
69
68
Model Accuracy
Statistic R2 F-value p-value
TABLE V F UZZY MODEL PERFORMANCE Training Testing
Min (%) 62.35 50.00
Max (%) 82.35 83.33
Mean (%) 70.88 67.58
St. dev. 3.78 6.54
67
66
65
64
Weak Persist Undrst Ovrst
to stepwise regression, where we increasingly add significant variables starting from an empty set. The significance is determined by their associated F-value or p-value. Through this method, six variables are added to the model, namely: Positiv, Negativ, Strong, Weak, Undrst, and Complet. The statistics of the model obtained by employing only these 6 content categories are presented in Table IV. The performance of the fuzzy model trained only using these 6 content categories, in terms of the accuracy in predicting up or down movement in the MSCI EURO index is presented in Table V. The results are averages over 100 randomly built models, where 70% of the data is used for training. The one-tailed paired t-test performed on the results of 100 experiments by relying on content categories selected through stepwise regression and the original results in [1] is much lower than 0.05, indicating a statistically significant improvement of the average accuracy. Given the order of variables selected by stepwise regression, we proceed to building fuzzy models on an increasing number of variables, where the variables are added based on their regression coefficient, from highest to lowest. The results hereof are graphically presented in Figure 3. Note that the same number of variables providing the best accuracy is selected as obtained through stepwise regression.
65
Model Accuracy
Fail Negativ Try
Fuzzy model accuracy (greedy forward selection)
2) Greedy Forward Feature Subset Selection: In this section we present the feature selection that we perform on the 13 content categories by employing directly the fuzzy model through greedy forward subset selection [26]. The variable selection process is as follows. We start by adding to the model the variable that provides the best accuracy in the prediction of upward or downward movement in the MSCI EURO index, computed as average over 100 generated models. We keep on adding variables to the model such that the added variable in combination with the content categories already included in the model provides the best accuracy. We repeat this until all content categories have been included in the model, regardless of the improvement in accuracy they provide. The results of this analysis are graphically depicted in Figure 4. The model achieves optimum accuracy with 8 features, namely: Weak, Persist, Undrst, Ovrst, Goal, Strong, Positiv, and Complet. The maximum level of accuracy obtained equals 69.5%, and decreases afterwards with the addition of new content categories. The one-tailed paired t-test performed on the results of 100 experiments by relying on content categories selected through greedy forward selection and the original results in [1] is much lower than 0.05, indicating a statistically significant improvement of the average accuracy. C. Discussion
66
64
63
62
61
60 Negativ Weak CompletStrong Positiv Undrst Goal Persist Need Means Ovrst Content Categories
Fig. 3.
Fig. 4.
Goal Strong PositivCompletMeans Need Content Categories
Try
Fuzzy model accuracy (regression coefficients)
Fail
In this section, we discuss two aspects related to our results. First, we provide a discussion on the current results in comparison with results obtained in previous work. Second, we provide an interpretation for the selected features, both through the linear regression as well as the greedy forward feature subset selection, and look at these results both from an economic perspective, as well as from the perspective of content analysis. In Table VI, we provide an overview of the results we obtain in the current work, as well as the results from [1]. As can be observed from this table, both feature selection methods that we have applied have led to, next to a significant reduction in the number of features, an increase in the accuracy of
the model on the testing dataset. While the feature selection through linear regression leads to an improvement of 4.55%, the features selected through greedy forward selection provide an even larger improvement equal to 6.47%. It can thus be concluded that a reduction in the number of features leads to an increase in the accuracy of the model on the testing set, for both the methods that we apply. The number of features is also reduced for both methods. We further note that linear regression provides a higher reduction in the number of features than greedy forward search. Although greedy forward search improves the overall accuracy of the model, it also uses a slightly higher number of features, thus raising the question whether the increase in performance is justified by the increase in the number of features. As our main goal is an increase in accuracy, we deem the cost of adding the two features reasonable. In Table VII we present an overview of the features selected by both models. The features in this table are not presented in the order of their significance. Rather, we focus on the overlap between the features selected through both methods. As apparent from this table, there is a significant overlap between the features selected by both methodologies. Roughly 83% of the features selected through the linear regression method are present in the features subset selected through the greedy forward search approach. We note that five of the selected features in the case of linear regression, namely Positiv, Negativ, Strong, Weak, and Undrst, are also the content categories with the largest coverage of words in the General Inquirer dictionary. This result relates to the intuition that, the more words that are included in a content category, the better the discrimination provided when predicting the MSCI EURO index. Additionally, the content category Complet is included in the features selected through linear regression. This is a category that indicates the completion of goals. The content categories Positiv, Negativ, Strong, and Weak are intuitively also the features that should provide the best discrimination of the dataset. Positiv and Negativ are general indicators of the sentiment being conveyed through the ECB statement, while Strong and Weak provide an indication of how strong the conveyed sentiment is. Linear regression also includes Undrst as selected feature, a collection of words indicating de-emphasis and caution. It can thus be concluded that caution in the ECB statements is related to changes in the MSCI EURO index. Although the Negativ content category is not included as relevant feature by greedy forward feature subset selection, the same method selects three content categories not in the feature set selected through linear regression, namely Ovrst, Goal, and Persist. The inclusion of Ovrst is rather intuitive when Undrst is selected. This category provides an indication for the emphasis specified in the text. The Goal category relates to words that indicate muscular or mental striving, and we thus conclude that goals set in an ECB statement have an impact on values of the index. Finally, the Persist category consisting of words that indicate endurance influences the index, and we thus conclude that persistence in the language used by the
ECB in the statements has an impact on markets. Finally, we present surface plots for selected pairs of content categories in Figure 5. Here, the values of content categories are plotted against the actual levels of the MSCI EURO index rather than upward or downward movement. These surfaces have been obtained from a fuzzy model generated on the eight content categories selected by the greedy forward feature subset selection. We note that the relationship between the index and the Strong and Weak content categories is almost linear, while for the other selected content categories the relationship with the index is highly nonlinear, coming to support our choice for a fuzzy system in modelling the MSCI EURO index based on ECB statements. We further note that high levels of understated words lead to higher levels of the index, and the same relationship holds for the Strong content category. When both Goal and Strong are high, or when both of them are low, the levels of the index are low, with some variability for in-between these extreme values for both content categories. Finally, we note that the frequency of positive words has a positive impact on the index up to a certain level; beyond this level, increases in the frequency of words in ECB statements leads to a decrease in the expected value of the MSCI EURO index. VI. C ONCLUSIONS AND F UTURE W ORK In this paper we build on previous work [1], [2] related to predicting the MSCI EURO index based on content analysis of ECB statements. Our focus is on reducing the number of features employed for prediction through feature selection. For this purpose we rely on two methodologies: (stepwise) linear regression and greedy forward feature subset selection. The original dataset consists of 13 features (General Inquirer content categories). Both methodologies provide an improvement in the overall accuracy of the model, while simultaneously reducing the number of features employed. Through linear regression we achieve an accuracy of 67.58% on the testing set by relying on 6 features, while greedy forward selection enables an accuracy on the test set of 69.50% while relying on 8 features. A large proportion of the features selected through both methodologies consist of those content categories that have the largest coverage in terms of words they are described by. We find this result intuitive, since a higher number of words provides for a more fine-grained distinction between statements that result in an upward movement in the index, and those resulting in downward movement, respectively. The remaining features that are selected related to overstatement and understatement, a general indication of the sentiment contained in ECB statements, as well as to the completion of goals, striving towards goals, and persistence in achieving those goals. Future work will focus on a larger number of content categories. The current dataset includes 13 content categories selected manually and based on their coverage as well as an intuition behind what market look for in ECB statements. A deeper analysis will take all General Inquirer categories
TABLE VI R ESULTS OVERVIEW Results from [1] Linear regression Greedy forward search
Accuracy on testing set (%) 63.03 67.58 69.50
0.4 MSCI EURO
MSCI EURO
0.6 0.4 0.2 0
0.35 0.3 0.25
−0.2 1
0.8
1 0.5
0.6
0.5 0
Weak
0.4 0.2
0
0
Undrst
Strong
0.4
0.2
0.6
0.8
Ovrst
0.35
0.35
MSCI EURO
MSCI EURO
Number of features 13 6 8
0.3 0.25
0.8
0.3 0.25 1
0.6
0.4
0.2
Positiv
Fig. 5.
0
0.2
0.4
0.6
0.8
1
Undrst
Strong
0.5 0
0
Goal
Surface plots for selected pairs of content categories and the MSCI EURO index
TABLE VII S ELECTED FEATURES OVERVIEW Linear regression Positiv Strong Weak Complet Undrst Negativ
1 0.5
Greedy forward search Positiv Strong Weak Complet Undrst Ovrst Goal Persist
into account, and select only those that are significant regarding movement in the MSCI EURO index based on the methodologies outlined in this paper. Additionally, learning dictionaries such as the General Inquirer from text, based on some performance measure such as an European index, should provide interesting challenges for future research.
ACKNOWLEDGMENT This work is partially supported by the European Science Foundation through COST action IC0702. R EFERENCES [1] V. Milea, R. J. Almeida, U. Kaymak, and F. Frasincar, “A fuzzy model of the MSCI EURO index based on content analysis of european central bank statements,” in 2010 World Congress on Computational Intelligence (WCCI 2010). IEEE, 2010, pp. 154–160. [2] V. Milea, N. M. Sharef, R. J. Almeida, U. Kaymak, and F. Frasincar, “Prediction of the MSCI EURO index based on fuzzy grammar fragments extracted from european central bank statements,” in The 2010 International Conference of Soft Computing and Pattern Recognition (SoCPaR 2010). IEEE, 2010, pp. 231–236. [3] T. Martin, Y. Shen, and B. Azvine, “Incremental evolution of fuzzy grammar fragments to enhance instance matching and text mining,” IEEE Transactions on Fuzzy Systems, vol. 16, no. 6, pp. 1425–1438, 2008.
[4] N. Sharef, T. Martin, and Y. Shen, “Minimal combination for incremental grammar fragment learning,” in The Joint 2009 International Fuzzy Systems Association World Congress and 2009 European Society of Fuzzy Logic and Technology Conference (IFSA-EUSFLAT 2009), 2009, pp. 909–914. [5] N. Sharef and Y. Shen, “Text fragment extraction using incremental evolving fuzzy grammar fragments learner,” in The 2010 IEEE International Conference on Fuzzy Systems (FUZZ-IEEE 2010), 2009. [6] H. Klingemann, P. Mohler, and R. Weber, “Das reichtumsthema in den thronreden des kaisers und die okonomische entwicklung in deutschland 1871-1914,” Computerunterstutzte Inhaltsanalyse in der empirischen Sozialforschung, 1982. [7] P. Tetlock, “Giving content to investor sentiment: The role of media in the stock market,” The Journal of Finance, vol. 62, no. 3, pp. 1139–1168, 2007. [8] H. Sakaji, H. Sakai, and S. Masuyama, “Automatic extraction of basis expressions that indicate economic trends.” Springer, 2008, pp. 977– 984. [9] J. Zhang, Y. Kawai, T. Kumamoto, and K. Tanaka, “A novel visualization method for distinction of web news sentiment,” in 10th International Conference on Web Information Systems Engineering (WISE 2009). Springer, 2009, pp. 181–194. [10] A. Esuli and F. Sebastiani, “Determining term subjectivity and term orientation for opinion mining,” in Proceedings the 11th Meeting of the European Chapter of the Association for Computational Linguistics (EACL 2006), 2006, pp. 193–200. [11] A. Andreevskaia and S. Bergler, “Mining WordNet for fuzzy sentiment: Sentiment tag extraction from WordNet glosses,” in Proceedings the 11th Meeting of the European Chapter of the Association for Computational Linguistics (EACL 2006), 2006, pp. 209–216. [12] R. Jensen and Q. Shen, “Fuzzy-rough data reduction with ant colony optimization,” Fuzzy Sets and Systems, no. 149, pp. 5–20, 2005. [13] S. Vieira, U. Kaymak, and J. Sousa, “Cohen’s kappa coefficient as a performance measure for feature selection,” in 2010 IEEE International Conference on Fuzzy Systems, 2010. [14] (2010, Dec) ECB press releases. [Online]. Available: http://www.ecb. int/press/pressconf [15] (2010, Dec) Thomson One Banker. [Online]. Available: http: //banker.thomsonib.com/ [16] K. Toutanova and C. Manning, “Enriching the knowledge sources used in a maximum entropy part-of-speech tagger,” 2000, pp. 63–70. [17] K. Toutanova, D. Klein, C. Manning, and Y. Singer, “Feature-rich part-of-speech tagging with a cyclic dependency network,” in The he 2003 Conference of the North American Chapter of the Association for Computational Linguistics on Human Language Technology (HLTNAACL 2003), 2003, pp. 173–180. [18] (2010, Dec) General Inquirer. [Online]. Available: http://www.wjh. harvard.edu/∼ inquirer/ [19] R. Babuska, Fuzzy modeling for control. Kluwer Academic Publishers Norwell, 1998. [20] U. Kaymak and R. Babuska, “Compatible cluster merging for fuzzy modelling,” in 1995 IEEE International Conference on Fuzzy Systems. IEEE, 1995, pp. 897–904. [21] T. Takagi and M. Sugeno, “Fuzzy identification of systems and its applications to modeling and control,” IEEE Transactions on Systems, Man, and Cybernetics, vol. 15, no. 1, pp. 116–132, 1985. [22] J. C. Bezdek, Pattern Recognition with Fuzzy Objective Function Algorithms. Kluwer Academic Publishers, 1981. [23] M. Setnes, R. Babuska, U. Kaymak, and H. van Nauta Lemke, “Similarity measures in fuzzy rule base simplification,” IEEE Transactions on Systems, Man, and Cybernetics, Part B, vol. 28, no. 3, pp. 376–386, 2002. [24] G. Seber, A. Lee, and G. Seber, Linear regression analysis. Wiley New York, 1977. [25] S. Chatterjee and A. Hadi, “Influential observations, high leverage points, and outliers in linear regression,” Statistical Science, vol. 1, no. 3, pp. 379–393, 1986. [26] I. Guyon and A. Elisseeff, “An introduction to variable and feature selection,” The Journal of Machine Learning Research, vol. 3, pp. 1157– 1182, 2003.