GRE
ETS GRE® Board Research Report ETS GRE® –18-03 ETS RR–18-37
A Generalizability Theory Study to Examine Sources of Score Variance in Third-Party Evaluations Used in Decision-Making for Graduate School Admissions Daniel F. McCaffrey Maria Elena Oliveri Steven Holtzman
October 2018
The report presents the findings of a research project funded by and carried out under the auspices of the Graduate Record Examinations Board. ∗∗∗∗∗∗∗∗∗∗∗∗∗∗∗∗∗∗∗∗∗ Researchers are encouraged to express freely their professional judgment. Therefore, points of view or opinions stated in Graduate Record Examinations Board reports do not necessarily represent official Graduate Record Examinations Board position or policy. The Graduate Record Examinations and ETS are dedicated to the principle of equal opportunity, and their programs, services, and employment policies are guided by that principle. ∗∗∗∗∗∗∗∗∗∗∗∗∗∗∗∗∗∗∗∗∗ As part of its educational and social mission and in fulfilling the organization’s non-profit Charter and Bylaws, ETS has and continues to learn from and also to lead research that furthers educational and measurement research to advance quality and equity in education and assessment for all users of the organization’s products and services. GRE-ETS PO Box 6000 Princeton, NJ 08541-6000 USA
To obtain more information about GRE programs and services, use one of the following: Phone: 1-866-473-4373 (U.S., U.S. Territories∗ , and Canada) 1-609-771-7670 (all other locations) Web site: www.gre.org ∗ America
Samoa, Guam, Puerto Rico, and US Virgin Islands
GRE Board Research Report Series and ETS Research Report Series ISSN 2330-8516
RESEARCH REPORT
A Generalizability Theory Study to Examine Sources of Score Variance in Third-Party Evaluations Used in Decision-Making for Graduate School Admissions Daniel F. McCaffrey, Maria Elena Oliveri, & Steven Holtzman Educational Testing Service, Princeton, NJ
Scores from noncognitive measures are increasingly valued for their utility in helping to inform postsecondary admissions decisions. However, their use has presented challenges because of faking, response biases, or subjectivity, which standardized third-party evaluations (TPEs) can help minimize. Analysts and researchers using TPEs, however, need to be mindful of the potential for constructirrelevant differences that may arise in TPEs due to differences in evaluators’ rating approaches, which introduces measurement error. Research on sources of construct-irrelevant variance in TPEs is scarce. We address this paucity by conducting generalizability theory (G theory) analyses using TPE data that informs postsecondary admissions decisions. We also demonstrate an approach to assess the size of interevaluator variability and conduct a decision study to determine the number of evaluators necessary to achieve the desired generalizability coefficient. We illustrate these approaches using a TPE whereby applicants select their evaluators, leading to a situation where most evaluators solely rate one applicant. We conclude by presenting strategies to improve the design of TPEs to help increase confidence in their use. Keywords measurement error; inter-rater reliability; sources of error; generalizability coefficient; D study
doi:10.1002/ets2.12225 Increasingly, evidence supports the importance of an expanded skillset that includes both cognitive skills (e.g., verbal and quantitative reasoning) and noncognitive attributes (e.g., teamwork, resilience, creativity) for workforce readiness and higher education success (Oliveri & Markle, 2017). In addition to using cognitive measures, there is growing interest in using data from noncognitive measures to inform higher education admissions decisions (Kyllonen, 2008, 2012; Sedlacek, 2011). Landrum, Jeglum, and Cashin (1994) and Millimet and Flume (1982) noted that scores from noncognitive evaluations (e.g., letters of recommendation written by supervisors) are heavily weighted in the graduate school admissions decision-making process. According to these authors, scores from noncognitive measures are more influential than other factors such as coursework, research experience, previous graduate work, and self-presentation factors such as one’s résumé, autobiographical statement, and interview. Only grade point average and scores from the GRE General Test are more highly valued than noncognitive measures. Briel et al. (2000) and Walpole, Burton, Kanyi, and Jackenthal (2002) described how stakeholders consider noncognitive attributes as important predictors of applicant success in graduate school. Sedlacek (2011) also pointed out that interest in noncognitive measures is increasing because their use can help narrow the racial/ethnic and gender gap in admissions rates. The inclusion of noncognitive measures in the admissions decision-making process yielded smaller differences between demographic subgroups in comparison to solely using cognitive measures (Sackett, Schmitt, Ellingson, & Kabin, 2001; Schmitt et al., 2009). Despite these benefits, the assessment of noncognitive attributes introduces challenges such as response biases, faking, or subjectivity (Oliveri & Ezzo, 2014). For instance, Callegaro (2008) pointed out that on assessments of noncognitive attributes, applicants may “fake” their responses by selecting traits that they suspect will be valued by the admitting institutions rather than the traits that actually describe them. Applicants may also “guess” at the seemingly most desirable answer, even if they do not fully comprehend the assessed concept or embody the desired trait (J. R. Campbell, 1999; Huff & Sireci, 2001). Because these challenges can greatly reduce confidence in the scores from noncognitive measures, third-party evaluations (TPEs) have been proposed as an alternative way to measure noncognitive attributes.
®
Corresponding author: D. McCaffrey, E-mail:
[email protected]
GRE Board Research Report No. 18-03 and ETS Research Report Series No. RR-18-37. © 2018 Educational Testing Service
1
D. F. McCaffrey et al.
A G Theory Study for Third-Party Evaluations
In TPEs, external evaluators, often selected by the individual who is evaluated, assess the individual’s personality traits or work attitudes. TPEs are used in various contexts, such as organizational settings in which managers rate employees’ performances or employers evaluate prospective employees to inform selection decisions. To augment data from cognitive sources, TPEs are used in higher education as a source of data to inform admissions decisions. Examples of standardized TPEs are the ETS Personal Potential Index (ETS PPI), which is used to evaluate graduate school applicants on noncognitive attributes (Kyllonen, 2008). Although TPEs avoid the pitfalls of self-assessment of noncognitive skills, they introduce new challenges such as rating inflation, which may occur when the applicant selects the evaluator. The process may also create a narrower universe of observations made by the evaluator about an applicant, which may produce observations that may not generalize to other evaluators, who may not know the applicant similarly well or for a similarly long time. Evaluators may also differ in their use of the TPE’s rating scale, and some may be more lenient and others stricter. Al Ansari et al. (2015) pointed out that this differential scale use is a main source of construct-irrelevant variance in standardized TPEs. Another issue to consider in the use of standardized TPEs is the magnitude of evaluator variability. When TPEs are used to inform postsecondary admissions decisions, variability among ratings for the same applicant may be large relative to variability between applicants. Under this scenario, the scores might primarily reflect variability in evaluators’ rating approaches and, to a lesser degree, variability in applicants’ possession of the assessed traits. This scenario is problematic because large variability has limitations including reducing confidence in the validity of the score-based inferences, and running counter to our primary goal in the use of TPEs, which is to differentiate among graduate applicants rather than other sources (e.g., differences in raters’ rating approaches). Consequently, it is important to analyze the degree to which TPE scores represent evaluator variability to help ensure that scores are interpreted and used in meaningful ways. However, such analyses are rarely done, and methods to analyze evaluator versus applicant variability have not been illustrated in high-stakes admissions contexts. We address this paucity in this paper. In this study, we used the PPI data, which is a standardized TPE that assesses six noncognitive attributes, including knowledge and creativity, communication skills, teamwork, resilience, planning and organization, and ethics and integrity. The appendix provides a list of the PPI attributes and the items belonging to each assessed attribute. We examined two research questions, which aimed to analyze the degree to which the PPI provides scores that can be used to meaningfully support score-based inferences to help inform admissions decisions among applicants. First, we asked to what extent is score variance in the PPI attributable to interevaluator variability versus applicant variability? This question sought to directly obtain evidence of the relative size of the evaluator and applicant variances. To examine this question, we used generalizability theory (G theory), which partitions the sources of score variance in data such as evaluators ratings of applicants (Brennan, 2001; Cronbach, Gleser, Nanda, & Rajaratnam, 1972; Kane, 2002; Shavelson & Webb, 1991). Second, we asked how many evaluators are necessary to obtain sufficient average score reliability, as measured by the generalizability coefficient (G coefficient), to confidently inform high-stakes admissions decisions when selecting among applicants on the traits assessed by the PPI? We examined this question using a decision (D) study (Brennan, 2001; Shavelson & Webb, 1991). A D study allowed us to calculate the G coefficient of the average rating as a function of increasing the number of evaluators. The G coefficient extends the traditional measures of reliability to the study of the sensitivity of scores to multiple distinct sources of variances.
®
®
Method The Personal Potential Index Instrument The PPI is the first large-scale, standardized web-based evaluation system used to assess graduate school applicants’ noncognitive attributes. It is designed to augment traditional data used for admissions decision-making, which to date primarily consists of scores from standardized cognitive ability assessments (Kyllonen, 2008; Kyllonen, Walters, & Kaufman, 2005). The PPI was developed in response to the need for an instrument that could reliably assess students’ personal attributes, specifically those reported to be important for success in graduate school (Briel et al., 2000; Walpole et al., 2002). Accordingly, attribute selection and item development were primarily based on relevant information in the academic literature as well as ETS survey results derived from graduate deans and faculty on the personality attributes deemed important for success in graduate school (Briel et al., 2000; Kyllonen et al., 2005; Kyllonen, Walters, & Kaufman, 2011; Walpole et al., 2
GRE Board Research Report No. 18-03 and ETS Research Report Series No. RR-18-37. © 2018 Educational Testing Service
D. F. McCaffrey et al.
A G Theory Study for Third-Party Evaluations
2002). Further informing the item and scale development was adjunct information from four primary sources: (a) “An Overview of the Army Selection and Classification Project” (J. P. Campbell, 1990); (b) “A Theory of Performance” (J. P. Campbell, McCloy, Oppler, & Sager, 1993); (c) “Are They Really Ready to Work? Employers’ Perspectives on the Basic Knowledge and Applied Skills of New Entrants to the 21st Century Workforce” (The Conference Board, Corporate Voices for Working Families, Partnership for 21st Century Skills, and Society for Human Resource Management, 2006); and (d) “Selecting Successful Graduate Students: In-depth Interviews with GRE Users” (Walpole et al., 2002). The Assessed Attributes The knowledge and creativity scale assesses evaluators’ perceptions of applicants’ knowledge of the field to which they are applying and their ability to generate ideas. Evidence of these skills was obtained from a study conducted by the U.S. Army based on a correlation analysis of training and performance outcomes measures. Study findings resulted in the creation of the taxonomy of higher-order performance components (J. P. Campbell, 1990; J. P. Campbell et al., 1993), which includes job-specific proficiency and non-job-specific proficiency, bearing a close resemblance to field-specific and general knowledge. A second source of evidence came from the results of interviews conducted with graduate faculty and deans wherein creativity was identified as an important admissions predictor (see Walpole et al., 2002). Creativity has also been identified as important to workforce readiness by U.S. employers (The Conference Board et al., 2006) and to predicting job training performance (Barrick, Mount, & Judge, 2001). Finally, knowledge and creativity are subsumed by the openness trait on the five-factor model of personality, which includes openness, conscientiousness, extraversion, agreeableness, and neuroticism (Goldberg, 1990). The communication skills attribute pertains to the organization and clarity of an applicant’s speech and writing. The skills subsumed within the communication scale (e.g., speaking clearly and in an organized fashion or in a way that is interesting) are important to tasks carried out in higher education institutions. Examples of such tasks include the need to communicate with other students in one’s field to achieve the project goals and objectives (Ennis, 2008) and to articulate abstract ideas effectively (González & Wagenaar, 2003; Strayhorn, 2006). The third scale, teamwork, assesses evaluators’ perceptions of applicants’ ability to work well in groups and interact effectively with others, such as behaving in an open and friendly manner or working well in teams. The importance of teamwork skills is documented in student learning outcomes frameworks (Association of American Colleges and Universities, 2011; Strayhorn, 2006) and workforce surveys (Hart Research Associates, 2015) for both higher education and workforce success, respectively. Teamwork skills are increasingly needed for higher education success for activities such as performing group projects and completing collaborative tasks. The resilience scale assesses recommenders’ perceptions of applicants’ commitment to hard work and their persistence to improve and overcome obstacles and challenges. Measuring these competencies is important: Employers throughout the United States have emphasized that for employees to be successful in the workplace, they must have a strong work ethic and they must put forth the requisite effort needed to perform their roles well (The Conference Board et al., 2006). Similarly, graduate faculty and deans suggested that persistence should be considered in admissions as a predictor (Walpole et al., 2002). The importance of persistence in the face of workplace stressors is supported by evidence showing that employees’ ability to tolerate stress well is predictive of their employers’ satisfaction with their overall job performance (Ones & Viswesvaran, 2001). In addition, to assess emotional responsiveness, this scale includes items that assess perceptions of how applicants react to stressors and to negative feedback. Examples include whether the applicant can work well under stress or can overcome challenges and setbacks. The assessed behaviors are relevant to higher education success, as graduate school often places complex and challenging demands on students that they need to overcome to complete projects and their study program (Ennis, 2008). The planning and organization attribute assesses applicants’ ability to set and reach goals. The importance of these competencies is cited in a number of studies using terms that are synonymous with these capabilities: planning and self-organization (Enright & Gitomer, 1989), responsibility and independence (Walpole et al., 2002), and maintenance of personal discipline (J. P. Campbell, 1990; J. P. Campbell et al., 1993). Conscientiousness, as reflected by a person’s organizational abilities and punctuality, was identified in a meta-analysis as the strongest predictor of academic performance in the five-factor model (Goldberg, 1990; Poropat, 2009). Success in higher education requires the use of these various attributes to manage and complete projects successfully (González & Wagenaar, 2003) within an allotted period (Ennis, 2008). GRE Board Research Report No. 18-03 and ETS Research Report Series No. RR-18-37. © 2018 Educational Testing Service
3
D. F. McCaffrey et al.
A G Theory Study for Third-Party Evaluations
The last scale, ethics and integrity, measures recommenders’ perceptions of applicants’ trustworthiness and degree of moral standards. Graduate school deans and faculty as well as employers have identified values and ethics as important for success in advanced study and in the workplace, respectively (The Conference Board et al., 2006; Walpole et al., 2002). This is not surprising, as employees’ levels of integrity are predictive of their training and job performance, level of productivity, and number of accidents on the job, in which the number of incidents and accidents decrease as the levels of integrity increase (Ones, Viswesvaran, & Schmidt, 1993). There were four items for each of the six attributes. There was an additional item for an overall assessment of the applicant. Items were purposefully designed to align with the types of activities and tasks carried out in higher education. They were written in collaboration with two expert personality psychologists, Lewis Goldberg and Gerard Saucier, and were informed by usability studies and focus group discussions between higher education experts (Kyllonen, 2008; Walters, Kyllonen, & Plante, 2006). The items were designed to capture observable behaviors or manifestations of each assessed attribute and to contribute to the PPI’s predictive validity (Aamont, Bryan, & Whitcomb, 1993). The Personal Potential Index Scale Evaluators respond to each of the items presented on a Likert-type response scale consisting of five options. A rating value of 1 indicates below average, 2 is average, 3 is above average, 4 is outstanding (top 5%), and 5 is truly exceptional (top 1%). In addition, there is a sixth option, insufficient opportunity to evaluate, which evaluators can use if they do not know the applicants well enough to rate them on a particular attribute or item. To complete the PPI, evaluators are requested to compare the applicant relative to others in the evaluator’s department or unit who attended graduate or business school. They are asked to rate the degree to which the applicants possess each of the six PPI attributes by considering each individual item within each scale; they are requested to not provide holistic (average) ratings. The resulting score report, which includes numerical ratings and written comments, if the evaluators choose to provide them, is meant to be considered along with the applicant’s undergraduate grades, test scores, recommendation letters, and other information. Sample We used data comprising 12,693 PPI ratings of 6,249 graduate school applicants who applied to various graduate fields across the sciences and humanities. Applicants had either completed or were in their senior year of their undergraduate studies in the United States. We used only evaluations with complete data, which meant that evaluators had filled a response for every one of the 25 PPI items. Each applicant was rated by one to 13 evaluators. Applicants chose their own evaluators. This approach is similar to using letters of reference wherein applicants select who will complete the letters. Analyses Generalizability Theory We conducted a G theory analysis to identify the possible sources of variance error in the PPI and to estimate the magnitude of each source separately. G-theory assumes that each applicant has a level of skill on each attribute of the PPI that can be effectively evaluated by a universe score for that attribute (Brennan, 2001). The universe score equals the expected value of a score across all levels of the measurement conditions or facets that contribute to the scores. The goal is to learn how well a score will generalize to the universe by measuring the variability across sources of error introduced by the facets. In the PPI, there are seven sources of score variation. The object of measurement is the applicant (A); the two facets are item (I) and evaluator (E). There also are three interactions (A × I, E × A, and E × I items) and the residual error, which subsumes the I × E × A interaction as well as unspecified error. In our analyses, we treated each of the six PPI attributes separately because evaluators are instructed to do so in their evaluations. Although the developers of the PPI carefully chose the items to evaluate the attributes within the context of graduate education, and a treatment of items as fixed could be justified, it is also the case that alternative items could have been selected. Lord and Novick (1968) provided a context for considering items as random: “We can conceive an item population from which the items might have been randomly drawn and then consider the score the examinee would be expected 4
GRE Board Research Report No. 18-03 and ETS Research Report Series No. RR-18-37. © 2018 Educational Testing Service
D. F. McCaffrey et al.
A G Theory Study for Third-Party Evaluations
to achieve over this population” (p. 235). Upon consideration of these notions, we treated item as a random facet. We further suggest that for each of the skills measured by the PPI, users of the assessment will make inferences that generalize beyond the performance on the specific items to the applicant’s performance across all items that purportedly measure the noncognitive skill and from which the observed items could have been drawn. Therefore, variation due to item selection could be a source of error.1 As is common with standardized TPEs such as the PPI, nearly all (92%) of PPI evaluators evaluated a single applicant. Thus, the applicant and evaluator data for our study conform to neither a fully crossed design nor a fully nested design. Only evaluators who evaluated multiple applicants provided data for estimating a variance component for E that is distinct from the component for E × A and for estimating an E × I component that is distinct from the error component. Consequently, if we modeled those data as if they were from a fully crossed design, estimates of E and E × I could be imprecise. Therefore, we chose to model the data as coming from a design in which evaluators are nested within applicants. For modeling purposes, we assigned evaluators who rated multiple applicants a separate ID for each applicant they evaluated. Thus, we created a dataset that had the evaluator ID fully nested within applicants. We used these data in our model and fitted a model that included terms for A, I, A × I, E:A (evaluators within applicants), and a residual error.2 Following the approach outlined in Haertel (2006) and Webb, Shavelson, and Haertel (2006), the variance component for E:A in the nested model confounds the variance components for E and E × A. The variance component for the residual error from the nested model combines the variance components for E × I and the residual error from the crossed model. Estimation of the Generalizability Theory Variance Components The estimation of the variance components is the basis for indexing the relative contribution of each source and determining the dependability of a measurement. Various approaches, such as an analysis of variance (ANOVA), Bayesian methods, minimum variance methods, and restricted maximum likelihood (REML; Schmidt McCollam, 1998), can be used to estimate the variance components. In this study, we used a Bayesian model. We selected a Bayesian model because, as we elaborate later, we had an unbalanced design with a different number of evaluators rating the applicants, and we had items crossed with applicants. Such designs require methods other than simple ANOVA, such as the REML (Searle, Casella, & McCulloch, 1992) or Bayesian estimation approaches. Although REML is more commonly used to estimate variance components than Bayesian estimation, software packages for REML estimation in the SAS suite (PROC HPMIXED) and R (lme4) do not provide standard errors for the estimated variance component. Bayesian methods, on the other hand, provide information on the posterior variance, which serves as a measure of the uncertainty in the estimated variance components and their functions, such as sums and ratios. Moreover, there are now multiple software options for Bayesian estimation via Markov chain Monte Carlo (MCMC) methods (e.g., winBUGS, JAGS, stan, or PROC MCMC in SAS), so it was straightforward to use this approach for estimating the variance components in our G-study. Based on these considerations, we implemented the MCMC fitting of our Bayesian model in winBUGS. Bayesian modeling requires a prior distribution for unknown parameters. We followed the approach described in Gelman (2006) in which the specified prior distribution for the square root of each variance component was a uniform distribution on a range chosen so that the specification of the prior distribution has little impact on the estimated variance components.3 We fit a separate model for each of the six PPI attributes. MCMC estimation uses an iterative process that must converge before yielding random samples from the posterior distribution. We ran 15,000 iterations. We discarded the first 5,000 iterations to allow the chain to converge and then saved every 20th iteration from the last 10,000 iterations to serve as our sample from the posterior distribution. We used the means of these samples as our estimates of the variance components and the standard deviation of these samples as the measure of uncertainty. Note that our results for the estimated variance components were nearly identical to the ones we obtained using REML estimation via PROC HPMIXED in SAS 9.4 or the lme4 package in R. Also, when fitting the model in SAS, we specified E as a nested effect in the model, and we excluded the E × I term to account for the nested G-study design. Evaluation of the Measurement Errors via the Generalizability Coefficient G-theory extends classical notions of reliability by exploring multiple sources of error. The G-coefficient (Brennan, 2001), such as the classic reliability coefficient, calibrates the impact of the various sources of error on the summative inferences. It is used to assess the error in making relative comparisons of scores among individuals. The G-coefficient equals the GRE Board Research Report No. 18-03 and ETS Research Report Series No. RR-18-37. © 2018 Educational Testing Service
5
D. F. McCaffrey et al.
A G Theory Study for Third-Party Evaluations
ratio of the universe score variance to the sum of the universe score variance plus the relative error variance. The relative error should include only those sources of error that are not constant across individuals. For inferences about the applicant’s noncognitive skills for each of the six attributes measured by the PPI, all applicants were evaluated on the same four items. Hence, items do not contribute to variability among applicants, and item variance does not contribute to the relative variance. On the other hand, the following factors did vary across applicants: (a) evaluators, (b) applicant by evaluator interactions, (c) applicant by item interactions, (d) evaluator by item interactions, and (e) residual errors. Therefore, variance components for these sources contributed to relative error. The score for an applicant on each attribute will equal the average of all the scores on the attribute for the applicant across items and evaluators. Consequently, the contribution of each of the various sources of variance to the applicant’s score will depend on the number of unique levels for each source. For example, the contribution of the evaluators equals the ratio of the evaluator variance component to the number of evaluators (cf. Brennan, 2001; Haertel, 2006). The relative error variance (σ2δ ) for the score on a PPI attribute of an applicant evaluated by nE evaluators is given by σ2δ =
σ2AI 4
+
σ2E + σ2EA nE
+
σ2EI + σ2EAI,e 4nE
=
σ2AI 4
+
σ2E∶A nE
+
σ2E∶AI,e 4nE
(1)
where σ2AI is the applicant by item variance, σ2E is the evaluator variance, σ2EA is the evaluator by applicant variance, σ2EI is the evaluator by item variance, σ2EAI,e is the residual variance from a model with evaluators crossed with applicants, which includes the evaluator by applicant by item variance and the residual error variance, σ2E∶A is the variance for evaluators nested within applicant, which equals the sum of σ2E and σ2AE , and σ2E∶AI,e is the error variance from the model with evaluators nested in applicants, which equals the sum of σ2EI and σ2EAI,e . ( ) The G-coefficient equals σ2A ∕ σ2A + σ2δ ,where σ2A equals the variance component for A. As the number of evaluators increases, the relative error will decrease and the G-coefficient will increase. As shown in Equation (1), relative error depends only on the sum of the E and E × A variance components, the sum of the E × I, and the residual error variance components. Hence, the variance components from a nested design are sufficient for the estimation of the relative error variance and the G-coefficient. Although the primary use of the PPI is to make comparisons between applicants, the “absolute” error might also be of interest as a measure of the precision in an applicant’s evaluation. The absolute error in any evaluation is equal to the sum of the errors from all sources, even those that are common across the applicants. Scores for a PPI attribute equal to the average of all evaluations for that attribute; the absolute error includes the item variance divided by 4 (because there are four items for each attribute) in addition to the relative error terms in Equation (1). As we elaborate below, with only four items per attribute, we had very little information to estimate the item variance component; moreover, the estimates are very sensitive to the specification of the prior distribution. Therefore, we only considered the relative error and the associated G-coefficient. Assumptions In our model, we implicitly assume that the evaluators’ ratings for each applicant are drawn from a random sample of evaluators from a common population of evaluators. Therefore, all random effects are assumed to be random samples, and the effects for each attribute have a common variance with a mean of 0. Although only a subset of the evaluators rates each applicant, we could obtain unbiased estimates of the combined E, E × A, and error variance components under the assumption that the effects associated with those evaluators are a random sample from homoscedastic distributions. We highlight, however, that the data we analyzed are not a random sample from well-defined populations of applicants, items, and evaluators. This issue is not new and is described in the framework provided in Kane (2002), where he discussed issues to consider to meaningfully inform inferences about G-study and D-study results from nonrandom samples. However, we note that even considering the assumptions outlined in Kane’s framework, the data from the PPI sample in which applicants select their evaluators and most evaluators solely rate a single applicant, we may face constraints that still 6
GRE Board Research Report No. 18-03 and ETS Research Report Series No. RR-18-37. © 2018 Educational Testing Service
D. F. McCaffrey et al.
A G Theory Study for Third-Party Evaluations
prevent us from having the data to support the desired inferences about the desired generalizability of the scores. Also, the scores themselves maybe insufficient to support some inferences about applicants. We elaborate on this issue in the Discussion. Test for Model Misspecification The model also assumes that PPI scores are normally distributed. To test for bias due to model misspecification by assuming normally distributed data, we conducted the following analyses. First, we averaged scores across items for each attribute for each evaluation of each applicant. We then randomly sampled two evaluations for each applicant who was scored by two or more evaluators. Data for applicants with a single evaluation were excluded from the sample. We then estimated the Pearson correlation between the two ratings by attribute. Evidence of robustness of the results to model specification was obtained if the Pearson correlation, which is a consistent estimate of the G-coefficient with a single evaluator, and the G-coefficient were highly similar. Sources of Evaluator Variance We explored variables that we thought might explain at least a portion of the variance among evaluators of the same applicants, as we hypothesized that an enhanced understanding of the sources of evaluator variance would be useful in interpreting differences in ratings across evaluators. We examined the two sources of information provided by the PPI data about evaluators. First, we examined the length of time the evaluator knew the applicant (1–5, 6–11, 12–24, 25–48, and more than 48 months). Second, we examined the nature of the evaluators’ relationship with the applicant, such as whether the relationship was through work, school research, volunteering, religious connection, coach, family member, friend, or teammate. Applicants could select multiple categories. Unfortunately, very limited background information was elicited with the PPI, so our analyses were confined to these two variables. To explore these sources, we included indicator variables (centered by applicant) in the model for each of the relationships (except for a holdout, which was the indicator for whether the evaluator knew the applicant through being a school instructor or administrator) and for four of the five levels for length of time that the evaluator knew the applicant. To assess the amount of evaluator variance for each applicant explained by these attributes, we compared the variance component for the evaluator estimated by models with and without these indicators. Decision Study We conducted a D study to investigate the impact of variability among the scores from different evaluators of an applicant. Of primary interest to our study was the relative error because we were interested in decisions that involved rank ordering individuals, such as identifying which applicants possessed more or less of the attributes measured by the PPI. Moreover, PPI evaluators are asked to rate individuals relative to other individuals in their departments. To this end, we focused on the impact of error for relative decisions related to the extent to which a PPI evaluation could rank order individuals by each of its attributes. Consequently, we estimated the G-coefficient (Brennan, 2001) using the relative error term given in Equation (1). We set a threshold of 0.70 or 0.80, which is often used as the threshold value to support the use of scores as part of a decision-making process (Downing, 2004). The utility of the PPI may be compromised if many evaluators are required to meet this threshold level.
Results Table 1 provides descriptive statistics, including the mean, median, standard deviation, and skew for each item. As illustrated in Table 1, for each of the assessed attributes, the data are highly skewed, as the evaluators consistently endorsed the higher categories of the PPI—over 95% of ratings were at 3 or above in the Likert scale. This high endorsement pattern may limit the utility of PPI scores as a differentiator between applicants, as we will explain in the Discussion. Table 2 shows the correlation coefficients among each of the PPI attributes. The correlations are high for all attributes. GRE Board Research Report No. 18-03 and ETS Research Report Series No. RR-18-37. © 2018 Educational Testing Service
7
D. F. McCaffrey et al.
A G Theory Study for Third-Party Evaluations
Table 1 Descriptive Statistics for the Personal Potential Index Items and Assessed Attributes Attribute Knowledge and creativity
Communication skills
Teamwork
1
Median 4.00
M 3.98
SD .59
Skew −0.50
2 3 4 Average 1
4.00 4.00 4.33 4.08 4.00
4.08 3.92 4.24 4.04 4.06
.65 .64 .60 .54 .63
−0.62 −0.51 −0.90 −0.75 −0.62
2 3 4 Average 1
4.00 4.00 4.00 4.00 4.33
3.91 3.96 3.96 3.97 4.27
.67 .64 .67 .57 .59
−0.52 −0.57 −0.52 −0.65 −0.98
2 3 4 Average
4.50 4.33 4.00 4.33
4.40 4.30 4.04 4.24
.56 .59 .67 .53
−1.21 −1.09 −0.67 −1.05
Attribute Resilience
Planning and organization
Ethics and integrity
1
Median 4.00
M 4.12
SD .62
Skew −0.74
2 3 4 Average 1
4.00 4.25 4.50 4.25 4.00
4.14 4.21 4.36 4.20 3.98
.63 .60 .60 .53 .61
−0.77 −0.77 −1.21 −0.93 −0.53
2 3 4 Average 1
4.00 4.33 4.20 4.17 4.67
4.11 4.21 4.17 4.11 4.52
.63 .63 .61 .56 .52
−0.72 −0.94 −0.82 −0.84 −1.44
2 3 4 Average
4.50 4.50 4.50 4.50
4.43 4.46 4.45 4.45
.57 .56 .55 .52
−1.36 −1.44 −1.42 −1.43
Table 2 Correlation Coefficients of the Attributes Assessed by the Personal Potential Index Attributes
Knowledge and creativity
Communication skills
Teamwork
Resilience
Planning and organization
0.88 0.78 0.87 0.83 0.72
0.75 0.80 0.82 0.67
0.89 0.79 0.81
0.90 0.81
0.74
Communication skills Teamwork Resilience Planning and organization Ethics and integrity
Generalizability Theory Study Table 3 summarizes the G-study results. For each of the six PPI attributes, the evaluator variance within applicants accounted for the largest proportion of the variance between scores, ranging from 45% of the variance between scores for knowledge and creativity to 66% for ethics and integrity. The residual variance was the next largest component for each attribute, ranging from 20% to 35%. Variance among the applicants accounted for between 13% and 17% of the variance in the scores. The two remaining sources of variance, I and A × I, accounted for under 4% of the variance among the scores. Estimation of the G-Theory Variance Components Table 3 also includes error bands (formally, 95% credible intervals) for the share of the total variance in PPI scores on each attribute associated with each of the components of variance. Given the data and prior distributions for the parameters, there is a 95% probability that the true variance components or shares of variance are in the error bands (see Carlin & Louis, 2009). The band for the E facet was largest for ethics and integrity, running from 2.0 percentage points below the estimate to about 2.0 percentage points above it. For other attributes, the bands typically ranged from about 1.7 to 1.8 percentage points below the point estimates to about 1.7 to 1.8 percentage points above it. The bands were around the same width for applicants and narrower for the other components. Given the large sample of applicants and ratings, these intervals were very tight, suggesting stable variance components for all sources of variance other than I. The error band for items is tight in Table 3 because we used a rather informative prior distribution that assumed that the standard deviation for items was uniformly distributed on the interval 0 to 0.115. Given this value, A would account for 95% and I for 5% of the variance between item mean scores for applicants scored by a very large number of evaluators. As mentioned, we chose this informative prior because the developers of the PPI were highly selective when choosing the items for the PPI. 8
GRE Board Research Report No. 18-03 and ETS Research Report Series No. RR-18-37. © 2018 Educational Testing Service
D. F. McCaffrey et al.
A G Theory Study for Third-Party Evaluations
Table 3 Variance Components and Share of Variance by Source and Personal Potential Index Attribute
Component
Estimated variance component
Items Applicants Items by applicants Evaluators Residual
0.01 0.09 0.02 0.27 0.21
Items Applicants Items by applicants Evaluators Residual
0.01 0.11 0.02 0.33 0.18
Items Applicants Items by applicants Evaluators Residual
0.01 0.08 0.01 0.30 0.17
Estimated error
% of variance
Estimated error
Knowledge and creativity (0.01, 0.01) 1.61 (0.85, 2.17) (0.08, 0.10) 14.97 (13.34, 16.67) (0.01, 0.02) 2.93 (2.45, 3.40) (0.26, 0.29) 45.51 (43.91, 47.23) (0.21, 0.22) 34.98 (34.09, 35.87) Communication skills (0.00, 0.01) 0.96 (0.26, 1.92) (0.10, 0.12) 16.52 (14.85, 18.23) (0.01, 0.02) 2.80 (2.39, 3.18) (0.32, 0.35) 51.5 (49.81, 53.25) (0.18, 0.19) 28.22 (27.42, 28.96) Teamwork (0.01, 0.01) 1.81 (1.03, 2.28) (0.07, 0.10) 14.61 (12.78, 16.47) (0.01, 0.01) 1.60 (1.16, 1.99) (0.29, 0.31) 52.10 (50.28, 53.92) (0.17, 0.17) 29.87 (29.13, 30.66)
Estimated variance component 0.01 0.08 0.02 0.29 0.20 0.01 0.10 0.01 0.34 0.16 0.00 0.06 0.00 0.30 0.09
Estimated error
Percent of variance
Estimated error
Resilience (0.00, 0.01) 1.55 (0.71, 2.18) (0.07, 0.09) 13.71 (12.07, 15.37) (0.02, 0.02) 3.48 (3.05, 3.91) (0.27, 0.3) 48.03 (46.36, 49.76) (0.19, 0.2) 33.22 (32.37, 34.10) Planning and organization (0, 0.01) 1.36 (0.56, 2.06) (0.09, 0.12) 16.65 (14.8, 18.56) (0.01, 0.01) 1.14 (0.81, 1.45) (0.33, 0.36) 55.06 (53.19, 56.87) (0.16, 0.16) 25.79 (25.11, 26.5) Ethics and integrity (0.00, 0.01) 0.59 (0.08, 2.28) (0.05, 0.07) 13.40 (11.57, 15.23) (0.00, 0.00) 0.70 (0.49, 0.94) (0.29, 0.31) 65.56 (63.58, 67.48) (0.09, 0.09) 19.74 (19.2, 20.27)
Notes. The sample size used is 12,693, which represents the number of ratings. Ratings are nested within applicants. Some applicants were rated by two or more evaluators. Bayesian 95% credible intervals are indicated in parentheses. The estimated evaluators component is an estimate of the sum of the evaluators and evaluators by applicants components. The estimated residual component is an estimate of the evaluators by applicants and error components.
Also, with just four items per attribute, the I variance component is highly dependent on the prior distribution. With the current prior distribution, the point estimates are very similar to the REML estimate. Uniform distributions on a larger interval highly distorted the point estimates compared with the REML estimates. Evaluation of the Measurement Errors The estimate of the I variance component had no bearing on the estimates of the other variance components. The point estimates and the error bands for the other variance components, which had very tight intervals, were the same regardless of the prior used for the I variance component. The I variance component did not contribute to the relative error, Gcoefficients, or the D-study. Consequently, results for these quantities were invariant to the items’ prior distribution. The error bands on the G-coefficients in the D-study results were generally about 0.02–0.03 above or below the point estimates. Thus, we have confidence in the stability of the key outcomes from our analysis. Test for Model Misspecification The results of the model misspecification test showed that the difference between the Pearson correlation and the Gcoefficient ranged from 0.01 to 0.02 for Pearson correlations that ranged from 0.16 to 0.22. These results suggest that there is limited bias resulting from model misspecification by assuming the skewed PPI data are normally distributed. Sources of Evaluator Variance Results of analyzing the sources of evaluator variance by adding the length of time the evaluator knew the applicant and the context of the evaluator and applicant relationship revealed that adding these features to the model indicator variables only reduced the estimated evaluator variance component by 0.9, 1.2, 1.4, 1.5, 1.7, and 2.7%, respectively, for planning and organization, communication skills, resilience, teamwork, ethics and integrity, and knowledge and creativity. These GRE Board Research Report No. 18-03 and ETS Research Report Series No. RR-18-37. © 2018 Educational Testing Service
9
D. F. McCaffrey et al.
A G Theory Study for Third-Party Evaluations
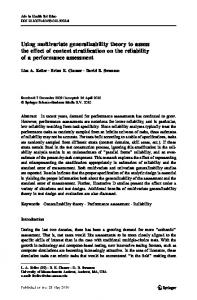
Figure 1 Generalizability coefficient by number of evaluators for each Personal Potential Index attribute.
results suggest that these features are not notable contributors to the variance between the ratings for different evaluators of the same applicant. Decision Study Figure 1 provides information on the number of evaluators needed to obtain a G-coefficient of 0.70 or 0.80 for each of the PPI attributes. These G-coefficient values are the ones typically desired for assessments used in decision-making contexts (Downing, 2004). Results indicated that at least 10 evaluators would be needed for all the attributes to achieve a G-coefficient of 0.70, and the G-coefficient only reaches 0.80 for planning and organization with as many as 16 evaluators. The remaining attributes require 17 or more evaluators to reach this threshold level, and for ethics and integrity and resilience, more than 20 evaluators would be required. The results are highly similar if items are treated as fixed, because the A × I is relatively very small. These results are perhaps not surprising, as we had relatively large variance components for evaluators within applicants and the residuals concomitant, with relatively modest variance components for applicants. Discussion Interest in assessing noncognitive skills is rapidly increasing, given their presumed role in narrowing the workforce readiness and higher education preparation gaps as well as their utility in providing data to inform admissions decisions (Kyllonen, 2008, 2012). However, there are challenges inherent in the assessment of noncognitive skills related to faking, response biases, or subjectivity, which can undermine our confidence in the use and score-based inferences derived from such assessments. TPEs in which evaluators assess individuals’ skills using a standardized instrument can help address some of the challenges associated with the assessment of noncognitive attributes, but despite the benefits of standardized TPEs, they raise a new set of challenges. These challenges may arise because the applicant selects the evaluator(s), there are few evaluators available to rate a particular applicant, and there are differences in evaluators’ rating approaches. Our study findings related to sources of variance from the PPI showed that the main source of variance across all attributes was evaluators; applicants represented a relatively small source of variance. The finding that evaluator variance is large is problematic and deserves further consideration. The large evaluator variance may occur as evaluators may rate applicants on a set of behaviors they directly observe within a particular context rather than all contexts in which such behaviors may occur. These context-dependent observations may yield differences in evaluators’ ratings. 10
GRE Board Research Report No. 18-03 and ETS Research Report Series No. RR-18-37. © 2018 Educational Testing Service
D. F. McCaffrey et al.
A G Theory Study for Third-Party Evaluations
A second concern related to using the PPI is the attainability of the desired number of evaluators to reach the desired Gcoefficient. The D-study results revealed that over 10 evaluators would be needed to obtain coefficients typically associated with assessments used in decision-making (Downing, 2004). Is this realistic? The recruitment of this high number of evaluators is unlikely, and although this is an important issue, one may also need to consider whether the expression of noncognitive skills is context dependent. In cases when observations are context dependent, the use of the PPI to estimate a single summative universe score for each applicant may be insufficient for informing admissions decisions. A single score may not provide the full picture of the applicant’s skills across contexts. Instead, to make more robust decisions, users of the PPI would need to be instructed to consider the full distribution of applicant scores. Moreover, the user may find information about the applicant and evaluator relationships useful for supporting their interpretation and use of PPI scores. Although we found that the effect of the following two features—(a) the time that the evaluator knew the applicant and (b) the context of the applicant–evaluator relationship—neither explained a significant amount of variance nor supported the hypothesis that the skills measured by PPI varied by context, we were restricted to these two features, which were measured somewhat coarsely. Additional data would be necessary to more fully examine the reasons for the large evaluator variance and the context-related variables that may exist in the applicant–evaluator relationship. Beyond considering the abovementioned issues, we discuss nonrandom sampling considerations, which have additional implications on the inferences about applicants and our interpretation of our G-study and D-study results. More specifically, PPI items were not randomly selected from a specified population, and there were only four items for each of the six assessed attributes. As discussed by Kane (2002) quoting Lord and Novick (1968), generalizations are made to “an item population from which the items of the test might have been randomly drawn” (p. 170); however, this inference requires justification on substantive grounds. As discussed by Thorndike (1966), nonrandom sampling is more acceptable when the universe consists of specific behaviors. In the PPI, items were carefully selected by the PPI developers to instantiate specific behaviors that are likely to occur in graduate school with the intent to generalize to a specific context (graduate school) rather than a more generic one. The items included in the PPI were carefully designed to specify behaviors relevant to graduate school in a fairly comprehensive fashion. Consequently, the population of “items like those observed” (Kane, 2002, p. 171) for the PPI is likely to align with the inferences users desire. Moreover, as shown in Equation (1), item variance does not affect the relative error in the scores or the G-coefficient, which depend on items only through the A × I variance component. Again, the developers chose items to cover the domain, the population of interactions between items such as those used, and applicants such as those sampled as relevant for inferences to be made by the user. The item sample also consisted of a small number of items, which resulted in imprecise estimates of the I component and its sensitivity to the specification of the prior distribution. Our data show that with only a few evaluators, results are not generalizable, even among the evaluators selected by the applicant. Moreover, differences in the leniency or stringency in the evaluator populations for different applicants will result in the variance component estimates for the evaluators that are biased low—that is, may be too small, whereas those for applicants will be biased high—that is, may be too large. Thus, our G-coefficients may be best understood as an upper bound to the G coefficient for generalizing to a common population of evaluators. As Kane (2002) noted, studies that use potentially unrepresentative samples but which can provide bounds can be useful for contradicting claims of invariance. Given that the evaluators’ variance component is large and the G-coefficient is small, our study clearly refutes claims of invariance of scores to the selected evaluators. As noted above, the results also rely on the assumption of constant variance components. The A variance component estimate will depend on the between-applicant sum of squares for the scores. The other variance components estimates will depend on the within-applicant sum of squares. The within-applicant sum of squares equals the weighted sum of the sample variances of the scores for each applicant. Hence, the estimated variance components will provide an estimate of the average of the variance components, if they are not constant across applicants. Also noteworthy is the fact that in the PPI, (a) applicants select their own evaluators, (b) most applicants (91%) were evaluated by an evaluator who solely rated one applicant, and (c) nearly all evaluators (92%) evaluated only a single applicant. And, even when evaluators assessed multiple applicants, they assessed only small subsets of applicants who purposively chose them as their evaluators. Therefore, the data best fitted a G-study design with evaluators nested within rather than across applicants. Models for nested designs yielded variance components that were sufficient for estimating relevant relative errors and G-coefficients. Because this design is an example of other TPE scenarios, we elaborate on the implications of these features and design issues next. GRE Board Research Report No. 18-03 and ETS Research Report Series No. RR-18-37. © 2018 Educational Testing Service
11
D. F. McCaffrey et al.
A G Theory Study for Third-Party Evaluations
Considerations for Observations from Nonrandomly Sampled Populations Kane (2002) and Zumbo (2007) provided frameworks that describe possible steps to follow when analyzing data from observations that are nonrandomly sampled, as is the case in TPEs. The authors note the importance of explicitly describing the conditions and design issues utilized in the samples, such as the populations to whom the inferences apply and the units that are to be excluded. Outlining these conditions is critical to making observations increasingly homogeneous and helping to increase confidence in TPEs. As mentioned, a high level of score variance that is attributable to evaluators or other sources outside the desired unit of inference (i.e., graduate applicants) can undermine confidence in the interpretation of TPE results. Following the logic of Kane (2002), with evaluators nested within applicant, for each applicant, generalization would be from the observed score to the universe score equal to the expected score across all evaluators such as those selected by the applicant. Applicant-specific evaluator universes are potentially problematic for comparing across applicants, which is likely to be the most common use of the PPI. Any systematic differences in the evaluators selected by different applicants would be conflated with differences in the level of applicants’ skills. For instance, in many applications, evaluators are differentially lenient or stringent and also may differentially endorse the extremes at each end of the scale (Kyllonen, 2008). If evaluators who rate different applicants do not apply the rating scale comparably for a common level of the assessed skill, the universe scores for applicants whose chosen evaluators are more lenient will tend to be higher than the universe scores for applicants whose evaluators are more stringent, even if the applicants possess equal skills. Such confounding of true differences between applicants and the rating tendencies of their evaluators may limit the utility of PPI scores. It may also limit the utility of the data for determining the generalizability of ratings to a universe score for the full population of interest. For comparing applicants to each other, universe scores across all evaluators from a common population would prevent the problems that arise from applicant-specific evaluator populations. However, TPEs require that the evaluators must know the applicants sufficiently well to evaluate their skills, and there is no way to create a common pool of evaluators. This shortcoming does not suggest a poor G-study design, because even if we had selected a set of evaluators who all knew a common set of applicants, the operational use of the PPI would still require that applicants select their evaluators. This shortcoming is a reflection of the operational constraints associated with the use of TPEs in high-stakes decisions. If populations of evaluators for different applicants were exchangeable, then it would be possible to compare the universe scores for applicants. This comparison would be permissible if there were no confounding effects such as those arising from differences in the evaluator populations. Moreover, a condition of exchangeability would need to be met. This condition requires that the evaluators for any given applicant evaluate applicants of equal skill (i.e., applicants with equal universe scores) equally and have the same variability among their ratings as the evaluators for any other applicant. In this case, the results of a G-study, such as the one presented here that used a sample from operational testing, could be used to assess the generalizability of operational scores. Given the current design of the PPI, we have limited substantive data to support such a claim of exchangeability. However, we suggest that considering the abovementioned suggestions might help improve the performance of evaluator, increase the homogeneity of evaluator populations across applicants, and increase the likelihood that evaluators for different applicants are exchangeable. In what follows, we also outline various strategies that can be used to enhance the instrument’s design with the goal of increasing the low G-coefficients we obtained and evaluate the possible reasons leading to the low coefficients we obtained. Strategies for Improving Third-Party Evaluation Designs in Instances of Low Generalizability Coefficients We believe that one reason for the low G-coefficients was the high number of evaluators who endorsed the upper (4- or 5point) score categories for each PPI item. This phenomenon was observed despite the PPI developers’ efforts to mitigate this threat by developing a scale that had a higher number of points in the higher categories as suggested by Klockars and Yamagishi (1988). This skewed rating pattern resulted in a restricted range, which possibly limited the utility of the scores to differentiate across applicants, as most applicants in our study received top scores across all items. Other possible reasons for the low coefficients may include limited variance among applicants themselves, potentially occurring because most applicants who apply to graduate school are top students. Moreover, evaluators may have been motivated to provide high ratings, as they likely knew that their ratings would be used to inform high-stakes decisions for the applicants. Thus, 12
GRE Board Research Report No. 18-03 and ETS Research Report Series No. RR-18-37. © 2018 Educational Testing Service
D. F. McCaffrey et al.
A G Theory Study for Third-Party Evaluations
as a way to support applicants’ chances for admissions, they may have rated them very highly. Further, evaluators received very little training in how to complete the reports, which may have led to large variability in how they rated applicants. Additionally, very few constraints were placed on who could be selected as an evaluator in terms of their relationship with the applicant or the length of time they knew the applicant. Alternatively, the evaluators may have been interpreting the attributes assessed by the PPI differentially, which may occur if evaluators construe their own meaning of each measured attribute. Finally, applicants may have chosen the evaluators they did because they wanted individuals who would rate them highly in the elicited attributes. Additional instrument improvements may include revising the instructions provided to evaluators, restricting the selection of evaluators, and augmenting the quantitative ratings in the PPI. These suggestions are intended to improve the quality of the data collected by the PPI and to minimize possible sources of error stemming from differences in evaluators’ rating approaches, among other sources. For instance, the PPI could include forced-choice item types to collect additional evidence from evaluators, or they could be asked to provide qualitative information about students as a way to supplement their quantitative ratings qualitatively. This information could be used to flag outliers (either unsuitable applicants or extraordinary qualities or behaviors) that might signal admissions committees about applicants who might (not) be suitable for the program to which applicants applied. We suggest providing evaluators with instructions that are more detailed and explicit. The intent is to minimize possible errors associated with differences in evaluators’ rating approaches. For example, some evaluators may generate halo effects, which can occur when an evaluator has a positive appraisal of the applicant in one area and then generalizes this positivity to all other evaluated areas. Various techniques could enhance consistency of interpretation by modifying evaluator training. One suggestion is to use behavioral anchoring techniques to exemplify the different behaviors associated with each item and attribute assessed. For example, PPI forms could include descriptions of highly creative and less creative applicants. A brief (2–3 minute) instructional video could be made available on the web alongside the PPI items and other supporting material. The overall goal is to standardize the evaluators’ evaluation process. Last, we suggest requesting applicants to rate themselves on the same PPI attributes as a complement to evaluators’ ratings. Self-evaluations generally are discounted because of faking concerns, but applicants may be deterred from exaggerating if they know TPEs are evaluating them on the same attributes. Applicants’ ratings could be used separately or bundled with the evaluators’ data, and the correlation between the applicants’ scores and the evaluators’ scores could be calculated. Any discrepancies could be flagged for further analyses. Additional quality assurance procedures and details on evaluator training, the comparison of scores across evaluators, and provision of evaluator feedback are outlined in Boulet, Rebbecchi, Denton, Mckinley, and Whelan (2004). Beyond studies for how to improve TPEs, future studies are needed to understand what drives evaluator variance, how to maximize variance due to applicants, and how to improve the design of standardized TPEs. Such research is needed not only for the PPI but also for other types of TPEs used in various contexts, such as clerkships in medical sciences (e.g., Al Ansari et al., 2015; van Barneveld, 2005) and in college students’ evaluations of their professors (Gross, Lakey, Orehek, & Edinger, 2009). An example of a concern to examine in future research is sources of the differences in evaluators’ rating approaches across test use contexts (e.g., medicine, education, selection) in which evaluators are also likely to be selected or may not be able to rate as many students. Answers to this question might help elucidate why TPEs in some test use contexts result in higher or lower G-coefficients as compared to other contexts. Additional studies should also be conducted on how to raise low reliability in evaluators’ ratings. The G-theory model may be particularly useful for such research because it enables the analyst to partition sources of score variance, and the model provides information about the components yielding the highest variance.
Conclusion To close, we note that despite the study’s limitations, it contributes to the discussion of evaluator variance and the possible contributing factors relative to TPEs in admissions contexts and, by extension, other contexts in which TPEs are used. Even if we cannot make claims about the generalizability of the universe scores across an entire population of common evaluators, our results are useful; large variability among ratings from different evaluators is problematic, even if we are only generalizing among the population of evaluators selected by an applicant. This research is also important to strengthen confidence in score-based interpretations. The results also inform PPI design improvement (e.g., by providing GRE Board Research Report No. 18-03 and ETS Research Report Series No. RR-18-37. © 2018 Educational Testing Service
13
D. F. McCaffrey et al.
A G Theory Study for Third-Party Evaluations
clearer instructions to evaluators or restricting the domains from which evaluators are sampled) as a way to reduce evaluator variance, making scores clearer and easier to interpret. This research is increasingly important, given the elevated interest in the assessment of noncognitive attributes for decision-making in selection and admissions, the potential utility of third-party assessment for that purpose, and the necessity of understanding evaluator variability for such third-party assessments. Notes 1 Note that the G and D study results for all variance components other than items were the same whether items were treated as fixed or random. 2 Our modeling approach ignores the fact that a very small proportion of evaluations for applicants (2.4%) share an evaluator with an evaluation of at least one different applicant, and the scores for these performances may be dependent. However, provided that the model is otherwise correctly specified, the estimated variance components should not be biased because the likelihood is correctly specified for each applicant. However, the precision of the estimated variance components may be slightly overestimated. 3 For the variance components A, and the sum of E and E × A, and A × I, we used uniform (0, 2) distributions for the priors. We used (0, 3) and (0, 0.115) uniform distributions for the error and items components, respectively. Because we had only four items and 3 degrees of freedom to estimate I, which is very sensitive to the prior given that we know that the items were carefully selected, the prior we selected enabled the prior mean of the ratio of A to the sum of A and I components to be equal to 0.95. The intraclass correlation for A was also 0.95. Using a uniform (0, 2) prior distribution for I yielded much higher posterior means for I, but the other variance components were effectively unchanged.
References Aamont, M., Bryan, D., & Whitcomb, A. (1993). Predicting performance with letters of recommendation. Public Personnel Management, 22, 81–90. https://doi.org/10.1177/009102609302200106 Al Ansari, A., Al Khalifa, K., Al Azzawi, M., Al Amer, R., Al Sharqi, D., Al-Mansoor, A., & Munshi, F. M. (2015). Cross-cultural challenges for assessing medical professionalism among clerkship sphysicians in a Middle Eastern country (Bahrain): Feasibility and psychometric properties of multisource feedback. Advances in Medical Education and Practice, 6, 509–515. https://doi.org/10.2147/ AMEP.S86068 Association of American Colleges and Universities. (2011). The LEAP vision for learning: Outcomes, practices, impact, and employers’ views. Washington, DC: Author. Barrick, M. R., Mount, M. K., & Judge, T. A. (2001). Personality and performance at the beginning of the new millennium: What do we know and where do we go next. International Journal of Selection and Assessment, 9, 9–30. https://doi.org/10.1111/1468-2389.00160 Boulet, J. R., Rebbecchi, T. A., Denton, E. C., Mckinley, D., & Whelan, G. P. (2004). Assessing the written communication skills of medical school graduates. Advances in Health Sciences Education, 9, 47–60. https://doi.org/10.1023/B:AHSE.0000012216.39378.15 Brennan, R. L. (2001). Generalizability theory. https://doi.org/10.1007/978-1-4757-3456-0 Briel, J., Bejar, I., Chandler, M., Powell, G., Manning, K., Robinson, D., . . . Welsh, C. (2000). GRE Horizons Planning Initiative: A research project funded by the GRE Board Research Committee, the GRE Program, and Educational Testing Service Research Division. Unpublished manuscript. Callegaro, M. (2008). Social desirability. In Paul J. Lavrakas (Ed.), Encyclopedia of survey research methods (pp. 825–826). https://doi .org/10.4135/9781412963947.n486 Campbell, J. P. (1990). An overview of the Army Selection and Classification Project (Project A). Personnel Psychology, 43, 231–239. https://doi.org/10.1111/j.1744-6570.1990.tb01556.x Campbell, J. P., McCloy, R. A., Oppler, S. H., & Sager, C. E. (1993). A theory of performance. In N. Schmitt & W. Borman (Eds.), Personnel selection in organizations. San Francisco, CA: Jossey-Bass. Campbell, J. R. (1999). Cognitive processes elicited by multiple-choice and constructed-response questions on an assessment of reading comprehension (Doctoral dissertation). Retrieved from Google Scholar database. (UMI No. 9938651) Carlin, B. P., & Louis, T. A. (2009). Bayesian methods for data analysis (3rd ed.). Boca Raton, FL: Taylor Francis Group. Cronbach, L. J., Gleser, G. C., Nanda, H., & Rajaratnam, N. (1972). The dependability of behavioral measurements. New York, NY: Wiley. Downing, S. M. (2004). Reliability: On the reproducibility of assessment data. Medical Education, 39(9), 1006–1072. https://doi.org/10 .1111/j.1365-2929.2004.01932.x Ennis, M. R. (2008). Competency models: A review of the literature and the role of the Employment and Training Administration (ETA). Washington, DC: U.S. Department of Labor. 14
GRE Board Research Report No. 18-03 and ETS Research Report Series No. RR-18-37. © 2018 Educational Testing Service
D. F. McCaffrey et al.
A G Theory Study for Third-Party Evaluations
Enright, M. K., & Gitomer, D. (1989). Toward a description of successful graduate students (GRE Board Research Report No. GREB-8517R). Princeton, NJ: Educational Testing Service. https://doi.org/10.1002/j.2330-8516.1989.tb00335.x Gelman, A. (2006). Prior distributions for variance parameters in hierarchical models (comment on article by Browne and Draper). Bayesian Analysis, 1, 515–534. https://doi.org/10.1214/06-BA117A Goldberg, L. R. (1990). An alternative “description of personality”: The Big Five factor structure. Journal of Personality and Social Psychology, 59, 1216–1229. https://doi.org/10.1037/0022-3514.59.6.1216 González, J., & Wagenaar, R. (Eds.). (2003). Tuning educational structures in Europe. Final report phase one. Bilbao, Spain: Universidad de Deusto. Retrieved from http://tuningacademy.org/wp-content/uploads/2014/02/TuningEUI_Final-Report_EN.pdf Gross, J., Lakey, B., Orehek, E., & Edinger, K. (2009). Person perception in the college classroom: Accounting for taste in students’ evaluations of teaching effectiveness. Journal of Applied Social Psychology, 37(7), 1609–1638. https://doi.org/10.1111/j.1559-1816 .2009.00497.x Haertel, E. H. (2006). Reliability. In R. L. Brennan (Ed.), Educational measurement (4th ed., pp. 18–64). Washington, DC: American Council on Education/Praeger. Hart Research Associates. (2015). Falling short? College learning and career success. Washington, DC: Association of American Colleges and Universities. Huff, K. L., & Sireci, S. G. (2001). Validity issues in computer-based testing. Educational Measurement: Issues and Practice, 20, 16–25. https://doi.org/10.1111/j.1745-3992.2001.tb00066.x Kane, M. (2002). Inferences about variance components and reliability-generalizability coefficients in the absence of random sampling. Journal of Educational Measurement, 39, 165–181. https://doi.org/10.1111/j.1745-3984.2002.tb01141.x Klockars, A. J., & Yamagishi, M. (1988). The influence of labels and positions in rating scales. Journal of Educational Measurement, 25(2), 85–96. https://doi.org/10.1111/j.1745-3984.1988.tb00294.x Kyllonen, P. C. (2008). The research behind the ETS Personal Potential Index (PPI). Princeton, NJ: Educational Testing Service. Kyllonen, P. C. (2012, May). Measurement of 21st century skills within the Common Core State Standards. Paper presented at the K–12 Center at ETS Invitational Research Symposium on Technology Enhanced Assessments, Princeton, NJ. Retrieved from https://www .ets.org/Media/Research/pdf/session5-kyllonen-paper-tea2012.pdf Kyllonen, P. C., Walters, A. M., & Kaufman, J. C. (2005). Noncognitive constructs and their assessment in graduate education: A review. Educational Assessment, 10, 153–184. https://doi.org/10.1207/s15326977ea1003_2 Kyllonen, P. C., Walters, A. M., & Kaufman, J. C. (2011). The role of noncognitive constructs and other background variables in graduate education (GRE Board Report No. GREB-03-11). Princeton, NJ: Educational Testing Service. https://doi.org/10.1002/j.2333-8504 .2011.tb02248.x Landrum, R., Jeglum, E., & Cashin, J. (1994). The decision-making process of graduate admissions committees in psychology. Journal of Social Behavior and Personality, 9, 239–248. Lord, F. M., & Novick, M. R. (1968). Statistical theories of mental test scores. Reading, MA: Addison-Wesley. Millimet, C. R., & Flume, M. E. (1982). Estimating graduate admission standards in psychology. Research in Higher Education, 17(2), 125–137. https://doi.org/10.1007/BF00973714 Oliveri, M. E., & Ezzo, C. (2014). The role of noncognitive measures in higher education admissions. The Journal of the World Universities Forum, 6(4), 55–65. Oliveri, M. E., & Markle, R. (2017). Continuing a culture of evidence: Expanding skills in higher education (ETS Research Report No. RR-17-09). Princeton, NJ: Educational Testing Service. https://doi.org/10.1002/ets2.12137 Ones, D. S., & Viswesvaran, C. (2001). Integrity tests and other criterion-focused occupational personality scales (COPS) used in personnel selection. International Journal of Selection and Assessment, 9, 31–39. https://doi.org/10.1111/1468-2389.00161 Ones, D. S., Viswesvaran, C., & Schmidt, F. L. (1993). Comprehensive meta-analysis of integrity test validities: Findings and implications for personnel selection and theories of job performance. Journal of Applied Psychology, 78, 679–703. https://doi.org/10.1037/00219010.78.4.679 Poropat, A. E. (2009). A meta-analysis of the five-factor model of personality and academic performance. Psychological Bulletin, 135, 322–338. https://doi.org/10.1037/0021-9010.78.4.679 Sackett, P. R., Schmitt, N., Ellingson, J. E., & Kabin, M. B. (2001). High-stakes testing in employment, credentialing, and higher education: Prospects in a post-affirmative-action world. American Psychologist, 56, 302–318. https://doi.org/10.1037/0003-066X.56.4 .302 Schmidt McCollam, K. M. (1998). Applied generalizability theory models. In G. A. Marcoulides, Modern methods for business research (pp. 1–22). Boca Raton, FL: CRC Press. Schmitt, N., Billington, A., Keeney, J., Oswald, F. L., Pleskac, T. J., Sinha, R., & Zorzie, M. (2009). Prediction of four-year college student performance using cognitive and noncognitive predictors and the impact on demographic status of admitted students. Journal of Applied Psychology, 94, 1479–1497. https://doi.org/10.1037/a0016810 Searle, S. R., Casella, G., & McCulloch, C. E. (1992). Variance components. https://doi.org/10.1002/9780470316856
®
GRE Board Research Report No. 18-03 and ETS Research Report Series No. RR-18-37. © 2018 Educational Testing Service
15
D. F. McCaffrey et al.
A G Theory Study for Third-Party Evaluations
Sedlacek, W. E. (2011). Using noncognitive variables in assessing readiness for higher education. Readings on Equal Education, 25, 187–205. Shavelson, R. J., & Webb, N. M. (1991). Generalizability theory: A primer. Newbury Park, CA: Sage. Strayhorn, T. L. (2006). Frameworks for assessing learning and development outcomes. Washington, DC: Council for the Advancement of Standards in Higher Education. The Conference Board, Corporate Voices for Working Families, Partnership for 21st Century Skills, & Society for Human Resource Management. (2006). Are they really ready to work? Employers’ perspectives on the basic knowledge and applied skills of new entrants to the 21st century workforce. Retrieved from https://www.conference-board.org/publications/publicationdetail.cfm? publicationid=1218 Thorndike, R. L. (1966). Reliability. In A. Anastasi (Ed.), Testing problems in perspective. Washington, DC: American Council on Education. van Barneveld, C. (2005). The dependability of medical students’ performance ratings as documented on in-training evaluations. Academic Medicine, 80(3), 309–312. https://doi.org/10.1097/00001888-200503000-00023 Walpole, M. B., Burton, N. W., Kanyi, K., & Jackenthal, A. (2002). Selecting successful graduate students: In-depth interviews with GRE users (GRE Board Research Report No. GREB-99-11R). Princeton, NJ: Educational Testing Service. https://doi.org/10.1002/j.23338504.2002.tb01875.x Walters, A., Kyllonen, P. C., & Plante, J. (2006). Developing a standardized letter of recommendation. The Journal of College Admission, 191, 8–17. Webb, N. M., Shavelson, R. J., & Haertel, E. H. (2006). Reliability coefficients and generalizability theory. In C. R. Rao & S. Sinharay (Eds.), Handbook of statistics: Psychometrics (Vol. 26, pp. 81–124). https://doi.org/10.1016/S0169-7161(06)26004-8 Zumbo, B. D. (2007). Validity: Foundational issues and statistical methodology. In C. R. Rao & S. Sinharay (Eds.), Handbook of statistics: Psychometrics (Vol. 26, pp. 45–79). https://doi.org/10.1016/S0169-7161(06)26003-6
®
Appendix Attributes Assessed in the Personal Potential Index
Attribute Knowledge and creativity
Communication skills
Teamwork
Resilience
Planning and organization
Ethics and integrity
16
Item # 1 2 3 4 1 2 3 4 1 2 3 4 1 2 3 4 1 2 3 4 1 2 3 4
Question asked by the item Has a broad perspective on the field Is among the brightest persons I know Produces novel ideas Is intensely curious about the field Speaks in a clear, organized, and logical manner Writes with precision and style Speaks in a way that is interesting Organizes writing well Supports the efforts of others Behaves in an open and friendly manner Works well in group settings Gives criticism/feedback to others in a helpful way Accepts feedback without getting defensive Works well under stress Can overcome challenges and setbacks Works extremely hard Sets realistic goals Organizes work and time effectively Meets deadlines Makes plans and sticks to them Is among the most honest people I know Maintains high ethical standards Is worthy of trust from others Demonstrates sincerity
GRE Board Research Report No. 18-03 and ETS Research Report Series No. RR-18-37. © 2018 Educational Testing Service
D. F. McCaffrey et al.
A G Theory Study for Third-Party Evaluations
Suggested citation: McCaffrey, D. F., Oliveri, M. E., & Holtzman, S. (2018). A generalizability theory study to examine sources of score variance in third-party evaluations used in decision-making for graduate school admissions (GRE Board Research Report No. GRE-18-03). Princeton, NJ: Educational Testing Service. https://doi.org/10.1002/ets2.12225
Action Editor: Brent Bridgeman Reviewers: This report was reviewed by the GRE Technical Advisory Committee and the Research Committee and Diversity, Equity and Inclusion Committee of the GRE Board. ETS, the ETS logo, GRE, and the GRE logo are registered trademarks of Educational Testing Service (ETS). All other trademarks are property of their respective owners. Find other ETS-published reports by searching the ETS ReSEARCHER database at http://search.ets.org/researcher/
GRE Board Research Report No. 18-03 and ETS Research Report Series No. RR-18-37. © 2018 Educational Testing Service
17