A Generalized Additive Soil Depth Model based upon Topographic and Land Cover Attributes Teklu K. Tesfa1, David G. Tarboton2, David G. Chandler3, James P. McNamara4 1
2
Civil and Environmental Engineering Department, Utah State University, Logan, UT,
[email protected]
Civil and Environmental Engineering Department, Utah State University, Logan, UT,
[email protected] 3 Department of Civil Engineering, Kansas State University, Manhattan, KS,
[email protected] 4 Department of Geosciences, Boise State University, Boise, ID,
[email protected] Paper presented at the 3rd Global Workshop on Digital Soil Mapping - Bridging Research, Production, and Environmental Applications, Logan, Utah, USA, 30 September - 3 October, 2008. http://dsmusa.org/. Abstract Soil depth is an important input parameter in hydrological and ecological modeling. Presently, the soil depth data available in national soil databases (STATSGO, SSURGO) is provided as averages within generalized land units. Spatial uncertainty within these units limits their applicability for spatially distributed modeling. This work reports a statistical model for prediction of soil depth in a semiarid mountainous watershed that is based upon topographic and other landscape attributes. Soil depth was surveyed by driving a rod into the ground until refusal at geo-referenced locations selected to represent the range of topographic and land cover variations in Dry Creek Experimental Watershed, Boise, Idaho. The soil depth survey consisted of a model calibration set, measured at 819 locations over 8 sub-watersheds, and a model testing set, measured at 130 locations randomly distributed throughout the remainder of the watershed. Topographic attributes were derived from a Digital Elevation Model. Land cover attributes were derived from Landsat remote sensing images and high resolution aerial photographs. A Generalized Additive Model was developed to predict soil depth over the watershed from these attributes. This model explained about 50% of the soil depth spatial variation and is an important improvement towards solving the need in distributed modeling for distributed soil depth data. Keywords: Hydrology, soil depth, topographic attributes, generalized additive models. 1. Introduction Soil depth is one of the most important input parameters for hydrological and ecological models. Consequently, its accurate representation is becoming increasingly important. Soil depth is highly variable spatially, and laborious, time-consuming and difficult to practically measure even for a modestly sized watershed [Dietrich et al. 1995]. The national soil databases (SSURGO & STATSGO) have been the main sources of soil depth information used in hydrology and ecology in the United States. In these databases, soils are represented as spatially discrete classes (map units) with sharp boundaries with a single value of
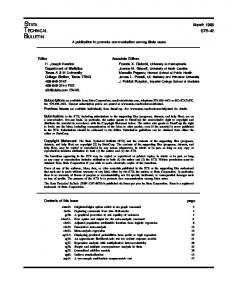
soil depth assigned to each class regardless of area or topographic complexity. Such a representation limits quantification of the variability of soil attributes within each class, and class boundaries generalize the spatial pattern of the soil properties, absorbing small scale variability into larger class units [Moore et al. 1993; Zhu 1997]. There is a need in spatially distributed modeling for fine scale models that do not have these limitations. Past efforts to develop fine scale models include fuzzy logic, statistical and physically based approaches [Moore et al. 1993; Dietrich et al. 1995; Zhu 1997]. In this paper, we develop a statistical model for prediction of the spatial pattern of soil depth from topographic and land cover attributes. Topographic attributes were derived from a digital elevation model (DEM); and land cover attributes were derived from Landsat remote sensing images. A Generalized Additive Model (GAM) [Hastie and Tibshirani 1990] was applied to predict soil depth based on these topographic and land cover attributes using soil depth data measured at 819 points at 8 sub-watersheds within Dry Creek Experimental Watershed (DCEW). This calibration data set was randomly divided into a training subset consisting of 75% of the data and a validation subset consisting of the remaining 25% that was used to estimate the prediction error for variable and model complexity selection [see e.g. Hastie et al. 2001 chapter 7]. Soil depth data measured at an additional 130 random points within DCEW was used as an out of sample data set to test the model results. The Nash-Sutcliffe efficiency coefficient was used to evaluate the efficiency of the model. 2. Study Area This study was carried out in the Dry Creek Experimental Watershed (DCEW), about 28 km2 in area, located in the semi-arid southwestern region of Idaho, USA (Figure 1). The area is composed of mountainous and foothills topography with elevations that range from 1000 m to 2100 m [Williams et al. 2008]. The average slope is about 25%, with steeper north facing slopes than south facing slopes. The climate is a steppe summer dry climate at low elevation and moist continental climate with dry summers at high elevation. Vegetation is grass and sagebrush at lower elevations, transitioning into chaparral and then fir, spruce, and pines at higher elevations. Soils are formed from weathering of the underlying Idaho Batholith, which is a granite intrusion ranging in age from 75 to 85 million years. The soils are generally well drained and have high surface erosion potential. 3. Methodology 3.1 Field and digital data Eight sub-watersheds were selected to represent the elevation, slope, aspect and land cover variability present within DCEW. Soil depth was surveyed at a total of 819 points within these sub-watersheds. Survey locations were chosen to represent the range of topographic and land cover variation in the sub-watersheds. At each survey location three depth replicates two to three meters apart were collected by driving a 220 cm long 1.27 cm diameter sharpened copper coated steel rod graduated at 5 cm interval into the ground using a fence post pounder until refusal. The
2
survey was carried out in the early springs of 2005 and 2006, when the soil was wet so that the rod penetrated more easily. The first author carried out this survey for 761 of the points in seven sub-watersheds, while soil depth data for 58 points in the eighth sub-watershed, had been previously collected using the same methods [Williams et al. 2008]. The data from these 819 points are designated as the calibration dataset. A further 130 soil depth observations were collected using the same method at randomly distributed locations, at least 50 meters away from the selected sub-watersheds, over the remainder of the watershed. These are designated as the testing dataset.
N
0 0.3 0.6
Dry Cre ek Wat ershed B ounda ry Distribu ted soil dept h point s
1.2
1.8
2.4 Kilo me ters
Sub wate rshe d soil de pth po ints: 1 2
3 4
5 6
7 8
Figure 1. Dry Creek Experimental Watershed (DCEW) near Boise, ID, in the Western USA. Points show locations where soil depth was sampled. A wide range of topographic and land cover attributes were chosen as potential regression explanatory variables for the prediction of soil depth. Fifty five topographic variables were derived from the DEM obtained from the USGS seamless data server. Of these, 36 were new topographic attributes that we derived following the approach described in Tarboton and Baker [2008]. Ten land cover variables were derived from Landsat TM imagery (path 41 row 30 obtained from the USGS) and an aerial photograph (obtained from NRCS Idaho State Office). Details on the derivation of these geospatial input variables are given in Tesfa et al. [in preparation]. 3.2 Statistical Analysis 3.2.1 Normalization Box Cox transformations (Eq. 1) were used to transform the measured soil depth (sd) and each explanatory variable so that their distribution was near normal.
3
t ( x) =
( x λ − 1)
λ
(1)
Here, t (x) denotes the transform of variable x with transformation parameter λ . λ was selected to maximize the Shapiro-Wilks Normality Test W-statistic as implemented in R [R Development Core Team 2007]. 3.2.2 Model We applied Generalized Additive Models (GAM) [Hastie and Tibshirani 1990] to predict soil depth using the explanatory variables. GAM is a statistical approach that generalizes multiple regression by replacing linear combinations of the explanatory variables with combinations of nonparamtertic smoothing or fitting functions, estimated through a backfitting algorithm. The GAM model is:
E ( sd | x1 , x 2 ,..., x p ) = α + f 1 ( x1 ) + f 2 ( x 2 ) + ... + f p ( x p )
(2)
where, x1 , x 2 ,..., x p are explanatory variables (predictors), sd is soil depth (response variable) and f i are non-parametric smoothing splines that relate sd to the x1 , x 2 ,..., x p . The model
assumes that the mean of sd is an additive combination of nonlinear functions of the explanatory variables x1 , x 2 ,..., x p . We used the GAM package as implemented in R [R Development Core Team 2007]. 3.2.3 Variable Selection and Model Complexity Questions in developing a predictive regression model include which potential explanatory variables to use and what to do about interdependent explanatory variables. Many of the explanatory variables that we derived from the DEM were variants on similar quantities, so we were specifically concerned about the effect of explanatory variable correlation on model prediction error. A correlation matrix giving the cross correlation between all 65 explanatory variables was computed using all 819 data points in the calibration dataset. Random Forest [Breiman 2001], a classification and regression package in R [R Development Core Team 2007], was used to calculate a measure of explanatory variable importance for the prediction of soil depth. Due to randomness in the Random Forest method the variable importance varies slightly each time it is run. We therefore ran Random Forest 50 times using all 819 data points in the calibration dataset with all 65 potential explanatory variables with soil depth as the response variable and averaged variable importance across these runs. Explanatory variables were then ordered based upon their importance measures. The number of explanatory variables in a model is a measure of model complexity. We used the correlation matrix, together with the Random Forest importance values to develop sets of explanatory variables representing models of differing complexity by eliminating the variable of lesser importance from pairs of variables with correlation above a designated threshold (from 0.15 to 0.9 in increments of 0.05). Variables were filtered out working sequentially from high to low correlation until no pairs with correlation greater than the threshold remained. Lower thresholds result in fewer variables, so a range of models with differing complexity were
4
developed. This approach reduced the correlation between variables selected for inclusion in a model. Models of differing complexity were also constructed using explanatory variables directly from the variable list ordered by importance. To evaluate appropriate model complexity, we randomly split the calibration sample of 819 data points into two parts, designated as the training and validation sets, as illustrated in Figure 2. The separate testing dataset of 130 points randomly distributed across the watershed was withheld from this process, so that it could be used for evaluation of the final model.
Calibration
Testing
819 points
130 points
Training
Validation
614 points
205 points
Figure 2. Data split into separate calibration and testing sets, with the calibration set split into a training and validation set for evaluation of model complexity.
GAM was applied, using the training data set of 614 data points to fit the models. Prediction error was computed for both the training and validation data set, the validation data set prediction error providing an out of sample estimate appropriate for trading off variance due to complexity with bias due to too few explanatory variables [see e.g. Hastie et al. 2001]. The results from this analysis allowed us to select the explanatory variables and degree of model complexity. 3.2.4 Calibration and testing Once the explanatory variables and model with appropriate complexity had been selected, GAM was applied using the full calibration data set as input. It was used to predict soil depth for the entire watershed. We then compared the testing dataset with the GAM soil depth values at testing locations using the Nash-Sutcliffe efficiency coefficient ( NSE ): NSE = 1 −
∑ (SD ∑ (SD
o
− SD p ) 2
o
− SDm ) 2
(3)
where; SDo , SD p , and SDm are observed (measured), predicted, and mean of observed (measured) soil depths respectively.
5
4. Results and discussion
4.1 Variable Selection and Model Complexity Figure 3 shows the variation of mean square prediction error for training and validation datasets versus model complexity in terms of the number of input variables. The continuous lines in this figure are from models developed using explanatory variables selected based on Random Forest importance directly. There is a new GAM model for each additional input variable. The symbols in this figure are from models developed using cross correlation as a filter to reduce inter-dependence among explanatory variables. There is a new GAM model with different number of input variables for each correlation threshold. The figure reports training and validation errors separately.
Figure 3. Number of input variables (Model complexity) vs. mean squared error. Explanatory variables selected directly using importance (continuous) and filtered by correlation (symbols) For both the importance selected and correlation filtered models the training error decreases progressively as additional input variables are added while the validation error decreases initially and then flattens out and starts to increase. The use of correlation filtered explanatory variables resulted in lower error. The validation error starts to increase for complexity more than 11 correlation filtered variables (Figure 3). Although there are fluctuations on validation MSE that go slightly below the 11 variable complexity, for 18 and 21 input variables, in our judgment the point of diminishing returns has been reached at 11 input variables. Consequently we selected 11 correlation filtered explanatory variables as representing the optimum GAM complexity for this dataset. Table 1 lists the explanatory variables identified by this procedure. Ten of these 11 explanatory variables are topographic variables, with three (avr, lspv, lvs), variables derived using new DEM analysis methods.
6
Table 1. GAM explanatory variables Symbol
Description
sca
Specific catchment area from the D∞ method. This is contributing area divided by the grid cell size (from TauDEM1 specific catchment area function).
modcurv
Curvature modeled based on field observed curvature using a regression equation on plan curvature, D8 horizontal slope position, wetness index inverse and general curvature (see Tesfa et al. [in preparation] for details).
ang
The D∞ flow direction: This is the direction of the steepest outwards slope from the triangular facets centered on each grid cell and is reported as the angle in radians counter-clockwise from east (TauDEM Dinf Flow Directions function).
avr
Average vertical rise to ridge computed over multiple (D∞) paths from ridge to each point (see Tesfa et al. [in preparation] for details).
lvs
Longest vertical drop to stream computed over multiple (D∞) paths from point to stream (see Tesfa et al. [in preparation] for details).
lspv
Longest vertical slope position computed as longest vertical drop divided by the longest vertical drop plus longest vertical rise to ridge (see Tesfa et al. [in preparation] for details).
slpg
Magnitude of topographic slope computed using finite differences on a 3x3 grid cell window (From ArcGIS spatial analyst tools slope function).
sd8a
Slope averaged over a 100 m path traced downslope along D8 flow directions (from GRAIP2, D8 slope with downslope averaging function).
elv
Elevation above sea level.
plncurv
Plan curvature is the curvature of the surface perpendicular to the direction of the maximum slope (From ArcGIS spatial analysis tools curvature function). A positive value indicates upwardly convex surface; a negative value indicates upwardly concave surface; and zero indicates flat surface.
pc1
First principal component from ERDAS IMAGINE principal component analysis of Landsat Thematic Mapper bands 1, 2, 3, 4, 5, and 7.
4.2 Model Evaluation Based on the selection of 11 correlation filtered explanatory variables above, GAM was applied using these variables with the full calibration set of 819 data points. Figure 4 shows the scatter plots of predicted versus measured soil depth for the calibration (left) and testing (right) data and their Nash-Sutcliffe Efficiency (NSE) and root mean squared errors (RMSE) after transforming 1
TauDEM is the Terrain Analysis Using Digital Elevation Models software (http://www.engineering.usu.edu/dtarb/taudem) 2 GRAIP is the Geomorphologic Road Analysis Inventory Package software (http://www.engineering.usu.edu/dtarb/graip)
7
back into space of soil depth. The testing data was not used at all in model development. In this figure the diagonal (central) lines represent the 1:1 line (predicted = observed). The two diverging dash lines, above and below the 1:1 line, show the predicted soil depth plus and minus two standard errors representing 95 percent confidence intervals. These lines diverge as a result of the Box-Cox back transformation.
Figure 4. Predicted soil depth vs. measured soil depth with plus and minus two standard error for calibration (left) and testing (right) data
Figure 5. Soil depth map predicted using GAM model
8
Figure 5 shows the soil depth map created using GAM at 5 meter grid scale. This models the ridges (convex areas) and south facing slopes as having shallower soils compared to the valleys (concave areas) and the north facing slopes respectively. This agrees with existing literature [e. g. Dietrich et al. 1995]. 5. Conclusions
A statistical model has been developed that predicts soil depth using topographic and land cover attributes. The topographic attributes were found to be more important than the land cover attributes in predicting the soil depth. The model was able to explain about 50% of the measured soil depth variability in an out of sample test. New topographic variables derived from the DEM played an important role in this model. Considering the uncontrolled uncertainties due to the complex local variation of soil depth, DEM errors and GPS reading errors, this is considered an important improvement towards solving the need for distributed soil depth information in distributed hydrological and ecological modeling. 6. Acknowledgements
The data collection part of this research was funded by the Utah Drought Management project, a project of USDA-CSREES Special Research Grant no. 2005-34552-15828 from the USDA Cooperative State Research, Education, and Extension Service. The modeling part was funded by the Inland Northwest Research Alliance (INRA). Field assistance was provided by Pam Aishlin and other students at Boise State University. 7. References
Breiman, L. (2001). "Random Forests." Machine Learning 45: 5-32. Dietrich, W. E., R. Reiss, M.-L. Hsu and D. R. Montgomery (1995). "A Process-Based Model for Colluvial Soil Depth and Shallow Landsliding Using Digital Elevation Data." Hydrological Processes 9: 383-400. Hastie, T. and R. Tibshirani (1990). "Generalized Additive Models." Chapman and Hall, London. Hastie, T., R. Tibshirani and J. Friedman (2001). The Elements of Statistical Learning: Data Mining, Inference, and Prediction, Springer. Moore, I. D., P. E. Gessler, G. A. Nielsen and G. A. Peterson (1993). "Soil Attribute Prediction Using Terrain Analysis." Soil Science Society of America Journal 57(2): 443-452. R Development Core Team (2007). R: A Language and Environment for Statistical Computing. R Foundation for Statistical Computing, Vienna, Austria. 3-900051-07-0, http://www.Rproject.org.
9
Tarboton, D. G. and M. E. Baker (2008). Towards an Algebra for Terrain-Based Flow Analysis. Representing, Modeling and Visualizing the Natural Environment: Innovations in GIS 13. N. J. Mount, G. L. Harvey, P. Aplin and G. Priestnall. Florida, CRC Press. Tesfa, T. K., D. G. Tarboton, D. G. Chandler and J. P. McNamara (in preparation). "Modeling Soil Depth based upon Topographic and Landscape Attributes." Williams, C. J., J. P. McNamara and D. G. Chandler (2008). "Controls on the temporal and spatial variability of soil moisture in a mountainous landscape: the signatures of snow and complex terrain." Hydrol. Earth Syst. Sci. Discussion 5(4): 1927-1966. Zhu, A. X. (1997). "A similarity model for representing soil spatial information." Geoderma 77(2-4): 217-242.
10