generative model captures the probabilistic relationships among relevant classification tags, tentative ... treatment, prognosis and prevention of stroke. In practice ...
A generative model based approach to retrieving ischemic stroke images Thien Anh Dinh1, Tomi Silander, PhD1, C. C. Tchoyoson Lim, MD2, Tze-Yun Leong, PhD1 1 National University of Singapore, Singapore; 2 National Neuroscience Institute, Singapore Abstract This paper proposes a generative model approach to automatically annotate medical images to improve the efficiency and effectiveness of image retrieval systems for teaching, research, and diagnosis. The generative model captures the probabilistic relationships among relevant classification tags, tentative lesion patterns, and selected input features. Operating on the imperfect segmentation results of input images, the probabilistic framework can effectively handle the inherent uncertainties in the images and insufficient information in the training data. Preliminary assessment in the ischemic stroke subtype classification shows that the proposed system is capable of generating the relevant tags for ischemic stroke brain images. The main benefit of this approach is its scalability; the method can be applied in large image databases as it requires only minimal manual labeling of the training data and does not demand high-precision segmentation of the images.
Introduction Images of different modalities play a significant role in the health care process. An increasing amount of digital images are being generated and stored in the health information systems worldwide. There have been many attempts in building image retrieval systems to exploit these resources for teaching, research and diagnosis. Two main approaches to retrieving digital images are query-by-text and query-by-visual. The query-by-visual approach may experience problems when the queries are abstract or ambiguous. The query-by-text approach resolves such ambiguity by using keyword search. However, text based query or retrieval mechanisms often depend on the availability of metadata and annotations on the images. Efficient and effective image search is only possible if the metadata and annotations are reliable and sufficient. Metadata is usually found in textual form attached to the images during diagnosis process. Nevertheless, such metadata usually document final diagnosis without explanations on the reasoning processes of the doctors or clinicians. Annotating images, on the other hand, is usually done manually; the process is time-consuming, expensive, subjective and not scalable in practice. These issues have caused difficulties in effective retrieval and usage of the images. Therefore, automatic annotation technologies are essential for supporting image retrieval from large and ever changing collections. In this work, we propose a new approach to automating the annotation process of medical images to improve the quality of the retrieval systems. Motivated by the identified relationship between lesion patterns found in diffusion weighted imaging (DWI) and clinical causes, we construct a generative model based retrieval system for ischemic stroke brain images to improve accuracy of diagnosis and usability of images for research and teaching. Stroke is a leading cause of death and permanent disability in the world; much research is ongoing in diagnosis, treatment, prognosis and prevention of stroke. In practice, clinicians typically tailor acute stroke treatment strategies with respect to the stroke subtypes present. Early diagnosis of the ischemic stroke subtype in the first few hours is important and would significantly help in directing treatment, prognostication, and risk management [1]. Our work aims at building a semantically relevant retrieval system for ischemic stroke images using readily available DWI images as training data. The only requirement for the training data is that the images have been classified but not necessarily segmented. The uncertainties resulting from imperfect
312
automatic image segmentation are handled using a probabilistic model that also incorporates medical expert knowledge. The main advantages of our approach include minimal requirement for labeled training data and less demand for a high-precision segmentation system. Background and Related Work Stroke is a sudden development of neurological damage. Stroke can be classified into two main types: hemorrhagic (15%) and ischemia (85%). In this paper, we only consider ischemic stroke, which occurs when blood vessels to the brain become narrowed or occluded, causing insufficient blood supply for normal cellular function. Early classification of ischemic stroke subtype is important for both short-term and long-term treatment and management of ischemic stroke patients. The Trial of ORG 10172 in Acute Stroke Treatment (TOAST) [2] and Oxfordshire classification criteria [3] are the most widely used formal systems for stroke subtype classification. Our work is based on the TOAST system which consists of five stroke subtypes - large artery atherothromboembolic (LAA), cardioembolic (CE), small vessel occlusion (SVO), stroke of other determined etiology, and stroke of undetermined etiology. Magnetic resonance imaging (MRI), especially DWI, has shown to be superior compared to other imaging modalities such as computed tomography (CT) in improving the accuracy of classifying ischemic stroke subtypes. DWI images reveal relative hyperintense signals in regions with potential ischemic brain lesions. Previous studies [1, 4] have found close relationships between the distribution pattern of ischemic lesion patterns in DWI images and specific ischemic stroke causes. Although ischemic stroke imaging has been a very active field of research in recent years, the focus has been limited to attempts in the segmentation of ischemic lesions from various image modalities such as CT and MRI. To the best of our knowledge, there has not been any work taking the next step to automated image annotation in this domain. The earliest attempt in an automated segmentation of stroke lesions from DWI images is by Martel et al [5], who introduced a method of using the adaptive thresholding algorithm with spatial constraints for segmentation. Matesin et al. [6] applied seeded region growing algorithm and rule-based labeling to recognize brain lesions from CT images. Usinskas [7] introduced an unsupervised classifier to identify stroke and non-stroke regions. However, thresholds had to be specified separately. Kabir et al. [8] suggested taking advantage of different kinds of anatomical information provided by different imaging modalities by using multiple MRI sequences such as T2, FLAIR and DWI.
Data and Methods 143 DWI scans of patients with ischemic stroke symptoms were retrospectively selected from the database of the Neuroradiology Department in a tertiary referral hospital specializing in neurological diseases in Singapore [9, 10]. Internal Review Board approval was obtained for this anonymized dataset for retrospective data mining. The dataset consists of 96 scans of three main subtypes LAA (43 cases), SVO (35 cases), CE (18 cases) and 47 scans of non-stroke cases. Each scan is a stack of 27 – 32 images called slices. Each slice is an image with a resolution of 256×256 pixels.
Image processing component
Generative model
Retrieval component
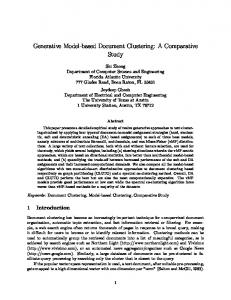
Figure 1. System overview. Our proposed system consists of three main subcomponents: image processing component, generative model component and retrieval component (Figure 1). The image processing component segments out potential lesions and extracts their features from the dataset. Based on the tentative segmentation, the generative model generates symbolic tags including the subtype-tags according to the TOAST system.
313
The retrieval component allows doctor to make queries and access stroke images according to their subtype and other tags. Image processing component The purpose of this component is to extract a list of potential lesions from a scan by automated segmentation. Since we are unaware of any completely automated segmentation techniques for ischemic stroke images, we will briefly discuss our implementation of a common segmentation technique. This segmentation technique is based on two popular segmentation methods: thresholding and region growing algorithm [11]. These techniques are generally fast and simple to implement. In the preprocessing phase, the DWI images are rescaled from 12-bit pixel depth to 8-bit pixel depth for faster performance. The skull and neck portions are eliminated from the images using the Brain Extraction Tool from FSL toolkit [12]. Due to magnetic resonance signal inhomogeneities, intensity shading artifacts could substantially reduce the accuracy of the system. We apply a nonparametric approach for automatic correction of intensity inhomogeneities in MRI1. Automated lesion segmentation We use threshold segmentation for segmenting lesions from DWI images because infracted tissues usually have higher signal intensities than other regions. Consequently, potential infarcts are among the maximum intensities of each slice. 1. Create a grayscale histogram of a scan 2. Calculate maximum intensities and variances for each slice in a scan 3. Calculate an average of the above variances 4. Choose a threshold value from the set of maximum intensities which satisfies the following criteria • • •
Must be the smallest intensity possible Must belong to a slice which has variance larger than the average variance Must belong to the last 15th percentile of the above histogram
Figure 2. Algorithm for selecting a threshold. The threshold segmentation algorithm starts by selecting a right value of threshold. Figure 2 illustrates our heuristic algorithm in selecting a threshold. Since segmentation is not our main focus in this paper, the heuristic is a domain-specific and data-specific algorithm. Notice that step 4 is to prevent choosing a candidate with the artifacts’ intensity. This selection is made based on prior investigation of our dataset. Once the threshold value is chosen, the thresholding segmentation technique is applied to transform an image into a binary image. If the pixel value is below the selected threshold, it is designated as “background”. If the pixel value is above the selected threshold, it is designated as “foreground”. Since segmented regions are extracted based on a certain threshold, some potential regions might not be detected due to this inflexibility. Hence, these initial segmented regions will be chosen as seeds for a region growing technique to address this issue. This region growing process consists of deciding whether neighboring pixels should be considered as part of the object. We use a criterion based on the statistics of the region. Neighboring pixels are considered as part of the region if their intensity values fall within one standard deviation from the mean of the intensity values of all pixels in the region. Since 1
http://hdl.handle.net/10380/3053
314
we use a 3-dimensional neighbourhood, the segmentation results are a collection of 3-dimensional objects that represent potential lesions. The image processing component is implemented with Insight Segmentation and Registration Toolkit (ITK)2. Feature Extraction The proposed technique was applied to 143 DWI cases. Since we do not have the ground truth on which regions are lesions and which are not, quantitative analysis of the segmentation results is not possible. By manually investigating the result, we noticed that all the potential lesions were successfully recognized by the algorithm. Figure 3 and Figure 4 show some examples of the segmentation results. However, false positive findings for lesions were also detected. There are two main reasons for the false positive findings: image defects (artifacts) and real lesions having large, non-uniform intensity resulting in a single lesion being recognized as multiple lesions. These issues have posed challenges for our generative model to overcome.
Figure 3. Segmentations of ischemic lesion.
Figure 4. A single lesion tracked through multiple slices of a DWI scan. From the segmentation results, we extract the physical size and the location, (x,y,z)-discretized coordinates of a centroid, of each potential lesion. For each scan, the segmentation results are formulated as a list. Table 1 illustrates an example of such a list for a single scan. The example vector consists of n potential lesions. Due to the inaccuracy of the segmentation technique and the characteristics of the image modality, there are both real lesions and artifacts in this list. While each scan in our data is manually labeled with the stroke subtype, the lesions themselves are not segmented. Thus, even after the automatic segmentation, we do not know for sure which potential lesions are true lesions and which are artifacts. This missing information will be estimated by a generative model. x
y
z (slice index)
Size
Real lesion?
1
97
112
15
33830.2
?
2
102
163
4
14576.5
?
3
150
168
5
11130.1
?
4
122
63
15
6541.66
?
2
http://www.itk.org
315
…
…
…
…
…
…
N
78
130
7
848.815
?
Table 1. An example of a feature vector for a single scan. Notice the missing information for true lesions. For the training data the TOAST class of the stroke is also known.
Generative model The central component of our system is the generative model that describes the joint probability distribution of the tags and the segmentation results. Tags are similar to keywords but they represent information inferred directly from images. Motivated by Kang et al.’s work [1], our tag vocabulary is built from the stroke subtypes (e.g. LAA, SVO, CE) and lesion patterns such as single lesion, multiple lesions, lesion location, lesion size. The generative model approach was pursued for three main reasons. Firstly, the segmentation output contains artifacts but the tag generation, including the TOAST class tag, depends on true lesions only. Uncertainty about which of the lesions are artifacts can be handled in a principled way using probabilistic models. Secondly, generative models allow integration of expert knowledge and knowledge learnt from data. Both types of knowledge are used in building our model. Thirdly, the resulting tags are naturally assigned probabilities which can then be used in the retrieval phase to rank the cases based on probability. Figure 5 presents a structure of our generative model as a Bayesian network, where some of the nodes in the dotted rectangle are aggregates of the underlying set(s) of random variables. A Bayesian network is a factored representation of the joint distribution among a set of random variables and encodes the conditional independences among the random variables through the Markov condition: if we know the values of variable X's parents, X is conditionally independent of its non-descendants. For example, in Figure 5, the tag variables Ti in our model are independent of the variable O once we know the values of the variables embedded in C and S. These variables will be explained later in this section.
O T S
C
T1
TK
…
Figure 5. The generative model describes the joint probabilities of scans S and tags (T1,T2… TK). O denotes the TOAST subclass of the scan. C is a binary vector of length N denoting which lesions are real. The generative model above describes the joint probabilities of scans S (see Table 1 for its structure) and tags (T1,T2… TK). The random variable O denotes the TOAST subclass of the scan and it may take one of the values from the set {LAA, SVO, CE, non-stroke}. C is a binary vector of length N denoting which lesions are real. First, we focus on the upper part of the system, thus omitting the tags T1 … Tk. Each scan is a list of N locations and sizes of potential lesions as in Table 1 but we separate out the “real lesion” column and mark that with a binary vector C of length N. In this vector, ci=1 denotes the hypothesis that ith lesion is
316
a real one while ci=0 suggests that ith lesion is an artifact. For example, in a scan in which two first lesions are real, C would be a vector (1, 1, 0,…, 0). The joint probability can now be expressed as ���, �, �� �������|�����|�, ��. S denotes a scan in the form of vector (S1,…, SN) in which Si is a ith row of a scan (see Table 1). To further factorize the distribution, we assume that if we know the subtype O, the probability of any vector C depends only on the number n(C) of the real lesions in C and that (x,y,z)-location and the size size of real lesions and artifacts only depend on the TOAST sub-class O. We may then write �
���, �, �� �������|�����|�, �� �������|�� � ��� | , �� ���� ����
������|�� � ����� �
������|�� � ����� �
�
��
� ��� | , ��
(1)
�� �
� ������ | , ����� | , � ���� , � |� , , ��. ��
After deriving a suitable factorization of the upper part of the model, the task is then to estimate the factors appearing in it. The TOAST subtype distribution P(O) can be derived from the training data or from the expert knowledge (or both). Since we do not manually label correct segmentation of lesions in our training data, we also have to resort to expert knowledge in estimating the probability distribution P(n(C)|O) that tells what are the typical numbers of lesions for each subtype. The rest of the terms in Equation 1 are trickier since the vector C is missing from our training data. To estimate those, we proceed as follows. We first estimate the factors for non-stroke cases (O=non-stroke) since for those we know that the C vector only contains zeros, i.e., artifacts. This estimation can be done directly using Gaussian kernel density estimation (KDE) [13]. KDE is a non-parametric procedure to estimate the probability density function of a random variable based on a finite data sample. We then divide the training data into three sets by the subtype O and estimate the terms ������ | 1, ��, ��� | 1, �� and ��� , � |� , 1, �� while fixing the corresponding terms for ci=0 to estimates learnt in first step for artifacts in the non-stroke cases. Here xi, yi, zi are coordinates of the ith potential lesion, and sizei is the physical size of Si. ������ | 1, �� denotes the probability that a true lesion of type O having size size. ��� | 1, �� is the probability of a type O lesion to occur in slice z. ��� , � |� , 1, �� is the probability of a type O lesion occurring at location (x,y) in a certain slice z. The estimation is done by the EM algorithm [13], which is a common technique in statistical estimation problems involving latent data. The latent data in this case is ci which we should have known but are unknown as we have avoided performing the time-consuming, manual labeling process. Figure 6 and Figure 7 illustrate two distributions of size and vertical location z for three subtypes and non-stroke cases. There is noticeable difference between artifacts and true lesions when comparing the size feature. On the other hand, the vertical location z of the lesion appears to be similar in all subtypes. Figure 8 visualizes the high probability region of lesions in different subtypes at different slices. As we can see, the distinctions among subtypes get more visible when comparing distribution functions of ��� , � |�, , � �. Such differences are crucial for differentiating between the subtypes. Generating tags We will now explain how the generative model can be used to generate the TOAST subclass tag for a scan. Instead of assigning a single TOAST subclass to a scan, we will assign a probability to each possible subclass. Formally, that corresponds to estimating the conditional probability distribution ���|�� ! ���, �� ∑# ���, �, ��, the terms in the sum are the joint probabilities defined in Equation 1.
317
Figure 6. KDE for ������ | , �� for different subtypes LAA, SVO, CE.
LAA
Figure 7. KDE for ��� |�, � for different subtypes LAA, SVO, CE.
SVO
CE
Slice Z = 12
Slice Z = 6
Slice Z = 20 Figure 8. KDE of ��� , � |�, , � � with zi = {12, 6, 20} after EM for different subtypes LAA, SVO, CE respectively.
To sum over all possible binary vectors C of length N is infeasible for large N. In practice, we use N=15, taking into account only the 15 largest lesion candidates. This heuristic appears to include all the true lesions in our dataset. The sum can be handled by utilizing prior knowledge that tthere re should ���|�� usually be no more than 5 real lesions in one scan. Consequently, in Equation 1, the term ����� 0 for ���� ( 5, thus it is sufficient to sum over combinati combinations C of length N that have at most 5 real lesions. We will next explain the generation of other tags. In order to stay within probabilistic framework, we interpret the tags as the values of a set of discrete random variables. This probabilistic treatment treatmen of tags is the key to both annotating scans and retrieving scans.
318
Following the generative model in Figure 5, we can assign a probability to any subset G of tags by ��*|�� ! ��*, �� + ��*, �, �, �� + ���, �, ����*|�, �, �� ,,�
+ ���, �, �� � ��-|�, �, �� . ,,�
,,�
(2)
./0
The last equation follows from the model structure that assumes that the tags are conditionally independent once we know the location and size of the true lesions. Content-based retrieval The elegance of the generative probabilistic model approach is that the tag-based content retrieval is very similar to the actual tag annotation. This is because, for the subset G of query tags, the conditional probability ���|*� ! ��*, ��, thus the computation can proceed according to Equation 2. Consequently, for each query, we can rank the scans in terms of their conditional probability. Notice, however, that in the query phase G may also contain a TOAST subtype tag. Equation 2 still works fine, since the subtype is also independent of other tags given the location and size of true lesions. In case of the subtype being included in G, the summation over other values of O is not needed.
Scans input Tag generation engine save Tagged scans with tag probabilities
Retrieved scans
Query tags Figure 9. Retrieval component. The general structure of the tagging and retrieval system is shown in Figure 9. To achieve reasonable retrieval times, it is possible to calculate the probability ���|*� for all scans and queries beforehand. The calculation can also be parallelized and the disk space should not be a bottleneck either. However, much of the resources would probably never be used, since we do not expect the number of query tags to be very large for any single query. For a considerably less resource intensive solution, we may want to approximate ��*|�� by the product ∏./0 ��-|�� terms of which can be pre-computed and stored for each scan in the database for fast retrieval. The computation of a single ��-|�� is a special case of the general tag probability computation detailed in Equation 2. However, all the single scan probabilities can be computed at once by single summation over O and C-vectors, which makes the computation very efficient. The resulting database would then contain single tag probabilities for each scan. Naturally, any solution between calculating single tag probabilities and all tag subset probabilities can also be implemented by balancing between retrieval time and storage space. These considerations can possibly take on query distributions into account as well.
319
Results Image retrieval systems should be evaluated by human user studies. While preparing for such studies, we evaluated our system by testing how well it was able to generate the correct stroke subtype tags. This task can be modeled as a multi-class classification task in which we search for the subtype tag with the highest conditional probability given the scans: 23-42�5 ��� 6|��. We used ten-fold cross validation to evaluate the accuracy of our classifier. Table 2 and Table 3 below show the precision and recall of the classifier in classifying different subtypes. Table 2 indicates that our classifier obtains high precision in classifying LAA and SVO cases. However, it achieves only moderate precision for CE cases. One possible reason, due to the relative rarity of the subtype, there are only a small number of this subtype images in our training dataset. On the other hand, in practice, the CE subtype is also the most difficult subtype to distinguish from LAA and SVO. Table 3 gives a detailed breakdown on the performance of our classifier on different subtypes. The LAA subtype appears to induce the highest false-positive rate in classification, mainly because it is the most common subtype both in our dataset and in reality. Predicted LAA
Precision
Recall
93.58%
55.5%
SVO
74.57%
54.9%
CE
51.67%
87.5%
True
Table 2. Precision and recall of the classifier for each subtype.
LAA
SVO
CE
LAA
93.59%
5.64%
0.07%
SVO
22.29%
74.57%
3.14%
CE
29.44%
18.89%
51.67%
Table 3. Confusion Matrix.
These classification results demonstrate the feasibility of building a completely automated stroke subtype classification system based on a promising tag based image retrieval system. In the near future, we aim at a careful analysis of the misclassifications to improve the model and subsequent tag generation, so that validation of the image retrieval system can be meaningfully conducted. Discussion In this paper, we have proposed a tag-based retrieval system for ischemic stroke images. Tags are automatically generated directly from the images by using a generative model. The model captures the relationships between image segmentation results and tags. The probabilistic generative model supports integration of expert knowledge and effectively handles the uncertainties inherent in the images and image processing techniques. Preliminary evaluation shows that our approach is promising in generating accurate stroke subtype tags. The main benefit of this approach is that it is scalable to large image database due to its minimal requirement for manual labeling of the training data. It can also be generalized to other biomedical imaging domains. However, there are some limitations in our approach which leaves room for further improvement. For instance, the relative positioning among the lesions and the lesion patterns are not yet fully considered.
Future work should involve adding more relevant tags into the system. One direction is to further study the retrieval routines of clinicians and other experts in practice. In another direction, we could incorporate an ontology into our tag pools to broaden the scope of the system. Comprehensive human evaluation of our retrieval system will be carried out to assess the system performance. In addition, the predictive power of our model could be improved by applying more accurate image segmentation
320
techniques; this is possible due to the separate image processing component and generative model. Furthermore, the generative model could also be enhanced by relevance feedback [14], through getting real-time feedback from the users in practice.
Acknowledgements This research was partially supported by an Academic Research Grant no. T1251RES1005 and a research scholarship from the Ministry of Education, Singapore. Part of this work was done when the first author was supported by a Singapore Millennium Fellowship. References 1. Kang D, Chalela J, Ezzeddine M, Warach S. Association of ischemic lesion patterns on early diffusion-weighted imaging with TOAST stroke subtypes. Archives of neurology. 2003;60(12):1730-4. 2. Adams Jr H, Bendixen B, Kappelle L, Biller J, Love B, Gordon D, et al. Classification of subtype of acute ischemic stroke. Definitions for use in a multicenter clinical trial. TOAST. Trial of Org 10172 in Acute Stroke Treatment. Stroke. 1993;24(1):35. 3. Bamford J, Sandercock P, Dennis M, Warlow C, Burn J. Classification and natural history of clinically identifiable subtypes of cerebral infarction. The Lancet. 1991;337(8756):1521-6. 4. Lee L, Kidwell C, Alger J, Starkman S, Saver J. Impact on Stroke Subtype Diagnosis of Early Diffusion-Weighted Magnetic Resonance Imaging and Magnetic Resonance Angiography. Stroke. 2000 2000/05/01;31(5):1081-9. 5. Martel A, Allder S, Delay G, Morgan P, Moody A. Measurement of Infarct Volume in Stroke Patients Using Adaptive Segmentation of Diffusion Weighted MR Images. Medical Image Computing and Computer-Assisted Intervention MICCAI™ 1999. p. 22-31. 6. Matesin M, Loncaric S, Petravic D, editors. A rule-based approach to stroke lesion analysis from CT brain images. Image and Signal Processing and Analysis, 2001 ISPA 2001 Proceedings of the 2nd International Symposium on; 2001. 7. Usinskas A, Dobrovolskis R, Tomandl B. Ischemic Stroke Segmentation on CT Images Using Joint Features. Informatica, Lith Acad Sci. 2004;15(2):283-90. 8. Kabir Y, Dojat M, Scherrer B, Garbay C, Forbes F, editors. Multimodal MRI segmentation of ischemic stroke lesions. Engineering in Medicine and Biology Society, 2007 EMBS 2007 29th Annual International Conference of the IEEE; 2007. 9. Yang G, Tan Y, Loh S, Lim C. Neuroradiology imaging database: using picture archive and communication systems for brain tumour research. Singapore medical journal. 2007;48(4):342. 10. Tchoyoson Lim C, Yang GL, Nowinski WL, Hui F. Medical Image Resource Center–making electronic teaching files from PACS. Journal of Digital Imaging. 2003;16(4):331-6. 11. Shapiro LG, Stockman GC. Computer Vision. 2001. Prentice Hall; 2001. 12. Smith S. Fast robust automated brain extraction. Human Brain Mapping. 2002;17(3):143-55. 13. Hastie T, Tibshirani R, Friedman JH. The elements of statistical learning: data mining, inference, and prediction: Springer Verlag; 2009. 14. Salton G, Buckley C. Improving retrieval performance by relevance feedback. Readings in information retrieval. 1997:355–64.
321