Galesia ’97, IEE/IEEE Conf. Genetic ALgorithms in Engineering Systems:Innovations and Applications, 2 - 4 September 1997, Glasgow, United Kingdom, pp. 174-179- © 1997 IEE. Personal use of this material is permitted However, permission to reprint/republish this material for advertising or promotional purposes or for creating new collective works for resale or redistribution to servers or lists, or to reuse any copyrighted component of this work in other works must be obtained from the IEE.
A Genetic Algorithm For The High-Level Synthesis Of DSP Systems For Low Power M.S. Bright and T. Arslan School of Electrical and Electronic Engineering Cardiff University Of Wales, UK.
[email protected],
[email protected]
ABSTRACTThis paper presents a Genetic Algorithm for the synthesis of Very Large Scale Integration low power Digital Signal Processing systems. The genetic algorithm operates on a high level signal flow graph of the system, which contains functional blocks such as adders, multipliers, etc. Evaluation of each design involves consideration of issues at different levels throughout the design hierarchy, such as functionality and silicon level implementation. A multi-objective genetic algorithm is used to concurrently track aspects of speed, area and power to produce optimum low power designs. A distinct feature of the genetic algorithm is the use of a library of high level transformations which is referenced by the genetic operators. The paper describes the Genetic Algorithm in detail and presents results showing its effectiveness with a number of signal processing systems. I. INTRODUCTION With the requirements for increases in speed and integration of VLSI devices, both heat dissipation and power consumption have become important design parameters. Excessive heat dissipation reduces device reliability and creates the need for expensive heat management systems, which add significantly to the cost of a device [1]. The projected growth in the portable computing market [1] will compound the power issue. The limiting factor in portable systems is the operating time provided by the battery. Though significant improvements have been made to increase battery life, future portable systems will make even greater demands on the power budget. Therefore the power consumption of the system needs to be reduced to extend operating life. These power consumption issues have identified low power VLSI design as an important area for investigation. Various techniques have been developed to tackle power reduction at different levels of the VLSI design process. At the physical level, gate sizing and floorplanning have been identified as key elements in power reduction [1]. Reduced threshold voltages at the
technology level have also been considered [2]. However, the consideration of power as a high level design parameter requires a comparatively small investment and will have the greatest impact on power [1]. The disadvantage of this approach is that it changes the design problem from synthesising for speed and area into synthesising for speed, area and power, adding an extra dimension to the design task. Therefore there is a need for the provision of CAD systems to automate this task, to reduce the burden on the design engineer. The high level power synthesis problem requires consideration of parameters at many levels of the design hierarchy. Factors such as functionality, fabrication technology and implementation of execution units all have to be considered when determining the optimum design. In addition power, speed and area have to be concurrently monitored to synthesise the optimum low power design. The combination of these factors from different levels of the design process implies that high level power synthesis is a multi-objective problem. A tool is required that can efficiently deal with this complex multi-objective search space, synthesising optimum low power designs while considering all factors. A Genetic Algorithm (GA) [3] is a powerful tool that has been used to solve a range of complex VLSI problems such as test pattern generation [4] and bus size minimisation [5]. Previous research has demonstrated the effectiveness of GAs when applied to the multiobjective search space of structural synthesis [6]. The authors have previously demonstrated the application of GAs in low power synthesis [7], using a restricted GA with limited genetic operators. This work considers the task of reducing the power of CMOS based application specific Digital Signal Processors (DSPs) used in applications such as telecommunications, speech and image processing. Recent low power research has shown that high level transformations, traditionally used to optimise for speed and area, can be used to significantly reduce the power of these data-path-intensive architectures [8]. However, even with a restricted set of these transformations no time-optimal algorithm can be developed to determine the lowest power solution [2]. Thus the complex search
Page 1
Galesia ’97, IEE/IEEE Conf. Genetic ALgorithms in Engineering Systems:Innovations and Applications, 2 - 4 September 1997, Glasgow, United Kingdom, pp. 174-179- © 1997 IEE. Personal use of this material is permitted However, permission to reprint/republish this material for advertising or promotional purposes or for creating new collective works for resale or redistribution to servers or lists, or to reuse any copyrighted component of this work in other works must be obtained from the IEE.
space of low power synthesis is compounded when using high level transformations. This paper describes a low power synthesis GA that applies high level transformations to a population of DSP circuits to determine a low power implementation. The nature of the synthesis problem required the modification of the standard genetic operators. The reasons for the modifications are discussed in detail. Results are presented for a variety of signal processing circuits which demonstrate the effectiveness of the GA in producing low power systems, while satisfying area and speed requirements. II. HIGH LEVEL POWER REDUCTION A. Power Dissipation Power dissipation in a CMOS device consists of three elements: short-circuit power, leakage power and switching power. The short-circuit and leakage components can be made negligible through the application of appropriate design techniques [2]. This leaves switching power, which is the power required to perform the switching events across the device, and is expressed in (1) [9]. P = VDD2 × Ce × fsamp
(1)
From (1), Ce is the effective capacitance switched within the device (switched capacitance). This is a function of the device’s physical capacitance and switching activity. VDD is the supply voltage and fsamp is the sampling frequency of the device. Equation (1) identifies that power has a quadratic dependency on the supply voltage. Therefore a reduction in supply voltage is targeted as the most effective method of reducing power.
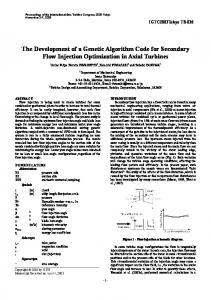
Normalised Delay
B. Power Reduction 28 24 20 16 12 8 4 0 1
2
2.9V will double the delay time of the device and hence halve the computational throughput. The induced delay can be compensated for through the application of a number of high level transformations [9][8], thus allowing for operation under reduced supply voltage with no change in device throughput. Preservation of device throughput is the constricting parameter when using transformations to reduce power. No loss in device throughput can be tolerated, regardless of the power saving obtained. The high level transformations are applied to the device at the design stage, to alter the final implementation speed and capacitance. Assuming an initial supply voltage of 5V, the transformations are applied to increase the speed of the device. The graph of figure 1 is then used to determine a lower supply voltage that induces a delay in the device to exactly compensate for the increased speed. This produces a device with the same throughput but a lower supply voltage. A transformation that increases speed may also increase capacitance (Ce) and area through the insertion of extra elements in the device. Excessive capacitance increase will negate any power reduction obtained through reducing supply voltage. Hence there is a tradeoff between increasing speed and reducing capacitance.
3
4
5
VDD (Volts) Fig. 1. Relationship between VDD and delay [10]. 2µm CMOS. Previous research [10] has shown that reducing supply voltage does yield significant power reduction, at the cost of increasing the delay time in the device. Figure 1 illustrates the effect of reducing the supply voltage of a 5V device on delay. For example, reducing the voltage to
C. High Level Transformations High level transformations have been well documented in the VLSI design literature [11],[12] and [13]. They operate on a high level description of the system represented as a Data Flow Graph (DFG). The GA in this work utilises a library of four transformations, chosen for their properties of increasing system speed with minimum increase in capacitance. These transformations are: • Retiming [11], which is the process of moving delay elements around the DFG to minimise the critical path. The maximum speed of a DFG is bounded by its critical path, which is the path with the longest computation time. In a DFG this is identified as the longest path between delay elements. • Pipelining [12], which attempts to minimise the critical path through the insertion of delay elements at specific cutset points within the DFG. • Automatic Pipelining [11] is a specialised form of retiming, delay elements are inserted on every input of the DFG and retimed. • Loop Unfolding [13] attempts to increase system speed by creating a parallel implementation of the DFG. An N unfolded DFG represents N parallel instances of the original DFG. Throughput may be increased through unfolding as the iteration period of an N unfolded DFG is 1/N times its critical path [9]. The high capacitance overhead of the unfolding transformation is minimised with the application of the postponing principle [14]. Using this principle the
Page 2
Galesia ’97, IEE/IEEE Conf. Genetic ALgorithms in Engineering Systems:Innovations and Applications, 2 - 4 September 1997, Glasgow, United Kingdom, pp. 174-179- © 1997 IEE. Personal use of this material is permitted However, permission to reprint/republish this material for advertising or promotional purposes or for creating new collective works for resale or redistribution to servers or lists, or to reuse any copyrighted component of this work in other works must be obtained from the IEE.
optimum solution is obtained before unfolding is applied. Unfolding is then used to attempt to improve the solution. III. THE GENETIC ALGORITHM The GA is used to determine a low power solution of a specified high level design, represented as a DFG, within the specified timing and area constraints. The following sections describe the main components of the GA. A. Chromosome Representation. n1
n2
X
Y n4
D
n3
for future growth, may not be large enough to accommodate all possible designs. For this reason the chromosome is of variable length. B. Genetic Evolution A prime prerequisite of a GA is a diverse initial population. This is generated by creating randomly transformed copies of the original specified DFG. Each member of the population represents a possible target design. The design evaluation procedure calculates the fitness of each individual within the population. The roulette wheel method [3] is used to select population members for mutation, crossover and reproduction [3]. Continued application of the genetic operators produces a new population of solutions. Genetic evolution is concluded when the DFG with the required design specifications (power, speed, etc.) has been produced.
Data Flow Graph Outputs Y INPUT
ADD
MUL
DEL
Chromosome
F: Mult S : 20 Cap : 12 in1: n2 out : n3
C. Fitness Evaluation The fidelity of the fitness function is central to the generation of optimum low power circuits. The objective of this GA is to minimise power, therefore the objective function is the power consumption of each DFG, as expressed in (1). However, sampling frequency can be removed from the equation as we consider systems that maintain a constant sampling frequency. This leaves (3) as the objective function (Fo).
Gene
Fo = VDD2 × Ce
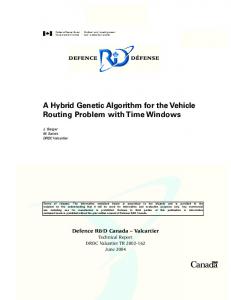
Fig. 2. Chromosome Representation The DFG is presented to the synthesis system as a netlist that details the elements and connectivity for that DFG. This is encoded into a chromosome structure, an example of which is shown in figure 2. This example contains three execution elements (multiplier, adder and delay) and four connection nets (n1-n4). The characteristics of the chromosome are as follows : • Each element within the DFG is encoded as an individual gene in the chromosome. • Each gene contains the information for that element’s function (F), capacitance (Cap) and speed (S). This is illustrated in figure 2 for the multiplier element. • Connectivity data is stored within each gene so that the chromosome is an exact representation of the DFG. The multiplier in figure 2 has stored n2 and n3 as its input and output connections. • The primary inputs of the DFG are encoded as functional elements, as this simplifies the application of the transformations. • The primary outputs for each chromosome are stored in a separate lookup table. • During the evolution process the application of transformations can significantly effect the amount of elements within the DFG to an unpredictable extent. A fixed length chromosome, with empty genes left
(3)
To aid comparison of different designs the fitness of each design is scaled in relation to that of the original. Equation (4) is used to calculate the fitness of each population member, where VDDo and Ceo are the supply voltage and capacitance of the original circuit respectively. Using (4) a circuit with a lower power will be assigned a higher fitness. Fitness =
1 VDD × Ce 2
÷
1 VDDo × Ceo 2
(4)
VDD is estimated by calculating the speed of a DFG compared to that of the original DFG. For example, reducing the critical path of a DFG by half results in a two-fold speed increase. A piece-wise linear model of the graph in figure 1 is used to calculate that a supply voltage of 2.9V will halve the speed of the DFG, thus returning its speed to that of the original DFG. Physical capacitance is estimated by calculating the number of data-path units of each type (adders, multipliers, etc.) required to implement the DFG. Each unit is a standard module taken from a library of predesigned units, each with associated capacitance and size values. These values are used to estimate the physical size and capacitance of the implementation of the datapath of the DFG.
Page 3
Galesia ’97, IEE/IEEE Conf. Genetic ALgorithms in Engineering Systems:Innovations and Applications, 2 - 4 September 1997, Glasgow, United Kingdom, pp. 174-179- © 1997 IEE. Personal use of this material is permitted However, permission to reprint/republish this material for advertising or promotional purposes or for creating new collective works for resale or redistribution to servers or lists, or to reuse any copyrighted component of this work in other works must be obtained from the IEE.
80
23.5
10
2.95
1400 1200 1000 800 600 400 200 0
0
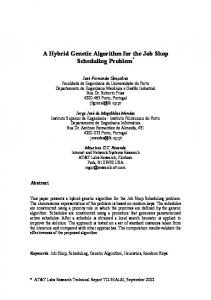
Interconnect Cap pF
Interconnect capacitance is estimated from a statistically derived model [8] shown in figure 3. This model relates interconnect capacitance to the physical size of the DFG. The current GA does not include the estimation of capacitance due to control logic. This cannot be discounted but, within the data-path-intensive architectures discussed in this paper, the data-path units will account for the majority of the total capacitance.
2
Area mm Fig. 3. Interconnect Capacitance Versus Area
D. Genetic Operators The genetic operators Mutation [3] and Crossover [3] are modified to suit the nature of the low power synthesis problem. Both mutation and crossover utilise the transformation library to effect changes to the chromosomes. Mutation Standard genetic mutation, in which a DFG element is selected at random and replaced with an element of a different function, would corrupt the functionality of the DFG. The mutation operator is redesigned to incorporate the high level transformations as non-corrupting mutation operators. The transformations operate on randomly selected elements within the DFG, mutating the DFG characteristics while following specified design rules.
through decreasing supply voltage. The different mutation transformations are applied to the population at pre-calculated application rates. These application rates were determined using a combination of design heuristics and experimental results. For example, retiming and pipelining are both powerful transformations for reducing the critical path, but pipelining has a latency overhead from inserting extra delay elements, therefore retiming is applied at a higher rate than pipelining. The following application rates were determined: Retiming = 20%, Pipelining = 1%, and Automatic Pipelining at 1%. Unfolding is initially applied at a relatively low rate which is increased after a number of generations. Crossover Standard genetic crossover [3] randomly selects a point in two parent chromosomes, separating the chromosomes into a head and tail. The head of chromosome 1 is spliced with the tail of chromosome 2 and vice versa. Applying this directly to the DFGs in the synthesis GA could affect their functionality. One solution to this problem is to employ a repair operator to restore the functionality of corrupted chromosomes [6]. However, this requires detailed knowledge of both the required and current functionality of the DFG. This information would be provided by simulating the DFG, which would be too computationally expensive. An alternative is to ensure crossover does not corrupt the DFGs. Parent 1
Child 1
D
D
e1
e3
e4
D
Retime D Critical Path=2
Pipeline
D Pipeline
Parent 2
Critical Path=1
Pipeline
Child 2
D
e2
D
D Retime
D Pipeline
D
D
Retime D
D
IN
OUT
Critical Path=2
Critical Path=1
Pipeline
Critical Path = 2 e3 e1 IN
r5
Fig. 5. Example Crossover Operation
e4
D OUT
Critical Path = 1 Fig. 4. Mutation Operation (Retiming) Figure 4 shows an example of a simple mutation operation. A delay element and a retime operation are randomly selected. The delay is retimed through the multiplier, altering the DFG’s chromosome. In this case the critical path has been halved, increasing the speed of the DFG, which will result in lower power consumption
The crossover operator introduces inheritance into the evolution process. Characteristics from parent chromosomes are inherited by child chromosomes. Within this GA each chromosome's characteristics are a function of the transformations it has had applied. The non-corrupting crossover system examines parents for previously applied transformations. The transformations of one parent are applied to the other and vice versa, creating two children with a combination of the transformations of both parents. Crossover is applied at a rate of 30%.
Page 4
Galesia ’97, IEE/IEEE Conf. Genetic ALgorithms in Engineering Systems:Innovations and Applications, 2 - 4 September 1997, Glasgow, United Kingdom, pp. 174-179- © 1997 IEE. Personal use of this material is permitted However, permission to reprint/republish this material for advertising or promotional purposes or for creating new collective works for resale or redistribution to servers or lists, or to reuse any copyrighted component of this work in other works must be obtained from the IEE.
Figure 5 is an example of a crossover operation. Two parents are selected from the population. The chromosomes are scanned from a random starting point, to randomly identify a transformation. A pipeline operation is identified in parent 1. This is applied to parent 2 in the same location, producing child 2. A retime operation identified in parent 2 is applied to parent 1 to produce child 1. In some cases a transformation applied to one parent may not be possible in the other. If this occurs the parent is scanned again for another transformation. IV. RESULTS The performance of the GA is illustrated with examples of recursive and non-recursive signal processing circuits of varying complexity. The circuits are a 3 Tap FIR Filter (FIR3), an 8 Tap FIR Filter (FIR8), a 2nd Order Lattice Filter (LAT2), an 8th Order Parallel Form Avenhaus Filter (AV8) [3] and a 6th Order Direct Form Avenhaus Filter (AV6). Table 1 lists the estimated power consumption of each optimised benchmark circuit, expressed as a percentage of the initial power consumption. The corresponding supply voltage and area increase is listed, together with the number of generations required to reach the power reduction shown. Each result is an average of 10 runs for that circuit. The GA was executed with a population size of 750 circuits which was experimentally determined to provide optimum performance. The table shows that in all cases a substantial power reduction was achieved by the GA synthesis system. Circuit
Power (%)
VDD
FIR3 FIR8 LAT2 AV6 AV8
7.98 8.28 21.30 11.98 21.44
1.38 1.41 2.29 1.70 2.29
Area Increase 8.0231 3.9972 2.0057 2.0057 1.0153
application of the other transformations. The application of these transformations re-enables the postponing principle, holding off unfolding until it is needed again. This iterative process accounts for the comparatively large number of generations for the less complex nonrecursive filters. The considerable area increase is evidence of the repeated application of unfolding, creating faster implementations through the increased use of parallel architectures. LAT2, AV6 and AV8 are progressively complex examples of recursive circuits, filters with progressively larger feedback loops. This bounds the maximum power reduction obtainable with the core transformation library, resulting in the lower power reductions obtained compared to the non-recursive examples. The feedback loop also limits the gains achievable with the application of the unfolding transformation, hence the smaller area increase for the recursive circuits compared to the nonrecursive circuits. LAT2 and AV6 did benefit from a limited application of unfolding whereas AV8 did not. This results in the smaller area increase and lower number of generations for the more complex AV8 circuit. Figure 7 illustrates the profile of the fittest member of the 6th order Avenhaus population, the average profile was calculated from 10 runs. The results demonstrate a steady increase in fitness, reaching the optimum solution within an average of 189 generations. In the case of the Avenhaus filter the best and worst case number of generations was 70 and 365 respectively.
Generations 311 642 331 559 189
Table 1. Results For Example Circuits Generations - Average Over 10 Executions FIR3 and FIR8 are examples of non-recursive filters, they do not contain feedback loops. When applying high level transformations to reduce power the maximum gain is often bounded by the largest loop within a DFG [14]. In non-recursive structures this bound is not present, thus enabling the considerable power reductions obtained for these two filters. With non-recursive circuits the unfolding transformation can have a significant effect on power. The postponing principle holds the application of unfolding until a number of generations with no improvement in the best solution has passed. Unfolding is then applied, improving the solution, enabling the
Fig. 7. Fitness Profile Of Avenhaus Population The suggested supply voltages for each design are significantly below the current 3.3V and 5V used in industry. However previous research has developed efficient voltage level converters with very low power and area overhead [15]. In each case the GA produced a number of circuits with the same power and area specifications. This
Page 5
Galesia ’97, IEE/IEEE Conf. Genetic ALgorithms in Engineering Systems:Innovations and Applications, 2 - 4 September 1997, Glasgow, United Kingdom, pp. 174-179- © 1997 IEE. Personal use of this material is permitted However, permission to reprint/republish this material for advertising or promotional purposes or for creating new collective works for resale or redistribution to servers or lists, or to reuse any copyrighted component of this work in other works must be obtained from the IEE.
provides greater flexibility for later stages in the design process such as floorplanning and routing. V. CONCLUSION A multi-objective genetic algorithm has been presented that successfully searches the complex search space inherent in high-level low power synthesis. The results presented for a variety of signal processing architectures demonstrate that the GA is an effective tool for DSP synthesis. The combination of the transformation library, the pre-determined application rates and the modified genetic operators produce designs with good area and power trade-offs. VI. REFERENCES [1] D. Singh, J.M. Rabaey, M. Pedram, F. Catthoor, S. Rajgopal, N. Sehgal and T.J. Mozdzen, “Power Conscious CAD Tools And Methodologies : A Perspective”, Proceedings Of The IEEE, Vol. 83, No. 4, pp. 570-594, April 1995 [2] A.P. Chandrakasan and R.W. Broderson, “Minimizing Power Consumption In Digital CMOS Circuits”, Proceedings Of The IEEE, Vol. 83, No. 4, pp. 498-523, April 1995 [3] D.E. Goldberg, “Genetic Algorithms In Search, Optimization and Machine Learning”, Addison Wesley Publishing Company Inc. USA, January 1989 [4] M.J. O’Dare and T. Arslan, “Generating Test Patterns For VLSI Circuits Using A Genetic Algorithm”, IEE Electronics Letters, Vol. 30, No. 10, pp. 778-779, May 1994 [5] R.S. Martin and J.P. Knight, “Genetic Algorithms For Optimisation Of Integrated Circuits Synthesis”, Proceedings Of The Fifth International Conference On Genetic Algorithms, pp. 432-438, July 17-21 1993 [6] T. Arslan, D.H. Horrocks and E. Ozdemir, “Structural Cell-Based VLSI Circuit Design Using A Genetic Algorithm”, International Symposium On Circuits And Systems, Atlanta, USA, Vol. 4, pp.
308-311, 1996 [7] M.S. Bright and T. Arslan, “A Genetic Framework For The High-Level Optimisation Of Low Power VLSI DSP Systems”, IEE Electronics Letters, Vol. 32, No. 13, pp. 1150-1151, 20th June 1996 [8] A.P. Chandrakasan, M. Potkonjak, R. Mehra, J. Rabaey and R.W. Broderson, “Optimizing Power Using Transformations”, IEEE Transactions On Computer Aided Design Of Integrated Circuits And Systems, Vol. 14, No. 1, pp. 12-31, January 1995 [9] T. Arslan, D.H. Horrocks and A.T. Erdogan, “Overview And Design Directions For Low-Power Circuits And Architectures For Digital Signal Processing”, IEE Colloquium (Digest),No. 122, pp. 6/1-6/5, 1995 [10] A.P Chandrakasan, S. Sheng and R.W. Broderson, “Low Power CMOS Digital Design”, IEEE Journal Of Solid-State Circuits, Vol. 27, No. 4, pp. 473483, April 1992 [11] L.E. Lucke and K.K. Parhi, “Data Flow Transformations For Critical Path Time Reduction In High Level DSP Synthesis”, IEEE Transactions On Computer Aided Design Of Integrated Circuits And Systems, Vol. 12, No. 7, pp. 1064-1067, July 1993 [12] K.K. Parhi, “High-Level Algorithm And Architecture Transformations For DSP Synthesis”, Journal Of VLSI Signal Processing, Vol. 9, pp. 121-143, 1995 [13] K.K. Parhi, “Static Rate-Optimal Scheduling Of Iterative Data-Flow Programs Via Optimum Unfolding”, IEEE Transactions On Computers, Vol. 40, No. 2, pp. 178-195, February 1991 [14] S. Huang and J. Rabaey, “Maximimising The Throughput Of High Performance DSP Applications Using Behavioural Transformations”, Proceedings Of EDAC-ETC-EUROASIC ‘94, Paris, France, pp. 25-30, March, 1994. [15] A.P. Chandrakasan, A. Burstein and R.W. Broderson, “A Low-Power Chipset For Portable Multimedia Applications”, IEEE Int. Solid-State Circuits Conf., pp. 82-83, Feb. 1994
Page 6