A Gentle Introduction to Optimal Design for Regression Models Timothy E. O’BRIEN and Gerald M. FUNK
This article demonstrates and underscores the equivalence between a variance-maximization exercise and the methodology involved in obtaining and verifying the optimal design for a key model function. It thus provides an alternate solution to the variance exercise as well as a means to introduce and illustrate the concepts of optimal design theory and practice in a simple and clear manner. KEY WORDS: D-optimality;Design measure; G-optimality; General equivalence theorem; Optimal design theory; Variancemaximization.
1.
INTRODUCTION
With only rare exception, instructors of experimental design and other courses in academic and industrial settings typically avoid addressing issues of optimal experimental design possibly due to the complexity of some of the material and publicationsin this eld. This theory was developed by Smith (1918), Chernoff (1953), Kiefer (1959, 1961, 1974, 1975), Kiefer and Wolfowitz (1960), White (1973), and Dette and O’Brien (1999), and was discussed by Silvey (1980), Atkinson and Donev (1992), and Pukelsheim (1993). Thus, although this rich literature exists for optimal design theory, it is only rarely encountered by undergraduate and graduate students of statistics in their coursework. In the applied spirit of Brady and Allen (2002), because researchers are often very interested in obtaining ef cient designs in practice, we feel that students should be exposed to their usefulness. One reason instructors may nd optimal design theory to be a dif cult topic to cover in a course is that its methodology does not easily build on established results, and thus requires a good deal of preliminary de nitions and results before meaningful applications can be made. This article shows how results from optimal design theory can be easily introduced and used to solve an interesting exercise from basic statistical theory, and thus also serves to bridge this gap in their coursework. We have had surprising success and positive feedback in distributing and discussing earlier versions of this note to students enrolled in undergraduate and graduate statistical theory and experimental design courses and in devoting roughly one or two class periods covering its contents. 2.
A FAMILIAR STARTING POINT
Consider the following exercise encountered by students enrolled in a post-calculus undergraduate course in basic statistical Timothy E. O’Brien is Assistant Professor, and Gerald M. Funk is Associate Professor, Department of Mathematics and Statistics, Loyola University Chicago, Chicago, IL 60626 (E-mail:
[email protected]).
® c 2003 American Statistical Association DOI: 10.1198/0003130032378
theory (see, e.g., DeGroot and Schervish 2002, p. 236, exercise 14). The discrete random variable X has probability mass function (pmf) !(x) which takes the value zero outside of the unit interval, [0; 1], and the exercise is to nd the pmf which maximizes the variance. Hence, we seek the (at most countably in nite) points x1 ; x2 ; : : : ; xk and corresponding weights !1 ; !2 ; : : : ; !k , with !j = !(xj ), which maximize the criterion function CF = P
k X
!j (xj ¡
· )2 ;
j= 1
where the mean · = !j xj . Students of elementary statistical theory, using algebraic results and properties of variances, can show that the optimal mass function places mass ! = 1=2 at each of the points x1 = 0 and x2 = 1. However, it turns out that this rather simple exercise also provides an excellent example useful to introduce and illustrate optimal design theory and methods, thereby giving an alternative proof of the above result and a means to demonstrate uniqueness and optimality of this solution. 3.
A BASIC INTRODUCTION TO OPTIMAL DESIGN THEORY
This section brie y reviews basic optimal design theory for regression models; readers interested in more extensive developments are referred to Silvey (1980), Box and Draper (1987, chap. 14), Seber and Wild (1989, sec. 5.13), and Atkinson and Donev (1992). For a given linear or nonlinear regression model function, E(Y ) = ² (x; µ) with unknown p £ 1 parameter vector µ; the optimal design problem typically involves choosing a design with k design points, ¹ , to best estimate the parameter vector. Here ¹ can be written as ½ ¾ x1 ; x2 ; : : : ; xk ¹ = ; !1 ; !2 ; : : : ; !k where the k design support points x1 ; x2 ; : : : ; xk are elements of the design space ¢, and the associated weights !1 , !2 ; : : : ; !k are nonnegative real numbers which sum to one. For the design ¹ , the k £ p Jacobian matrix, V = @´=@µ with stth element @´(xs )=@µt , depends on µ for nonlinearmodels and does not for linear models. When the model errors are normally distributed, the corresponding (Fisher) information matrix associated with µ is given by M = M(¹ ; µ) =
k X j= 1
!j
@´(xj ) @´(xj ) = V T « V; @µ @µ T
where « = diagf!1 ; !2 ; : : : ; !k g. Because the asymptotic covariance matrix associated with the maximum likelihood estimate of µ is proportional to M¡1 , variance-optimal designs minimize some convex function of M¡1 . The most popular regression design criterion is Doptimality (Silvey 1980, p. 40), where designs are sought to The American Statistician, November 2003, Vol. 57, No. 4
265
minimize the determinant of M¡1 (or equivalently, to maximize the determinant of M). Reasons for the popularity of this criterion were given by Seber and Wild (1989, p. 250) and include the fact that D-optimal designs are invariant to an (even nonlinear) reparameterization of the model function. The proof of this invariance involvesan argument identical to the one given in the proof of Theorem 1 in Dette and O’Brien (1999, p. 97). Further, as discussed by Atkinson and Donev (1992, p. 44), the standardized (predicted) variance function which corresponds to the assumed model function and design is given by d(x; ¹ ; µ) =
@² (x) @µ T
M¡1 (»; µ)
@² (x) ; @µ
and designs that minimize ¯ (¹ ,µ) = maxx2 ¢ d(x; ¹ ; µ) are called G-optimal. The celebrated general equivalence theorem [originally given in Kiefer and Wolfowitz (1960) for linear models and extended to nonlinearmodels in White (1973)] establishes the equivalence of ¹ D and ¹ G , the D- and G-optimal designs. Equally important is a corollary which states that ¯ (¹ D ,µ) = p, that is, that the maximum predicted variance for the D-optimal design is p. An important application of this corollary is to graphically check the D-optimality of ¹ D because ¯ (¹ ,µ) > p for all other (non D-optimal) designs, ¹ . A further result is that d(x; ¹ D ,µ) = p for x equal to each of the support points of ¹ D . These somewhat obscure conceptsare illustratedwith the following carefully chosen example, which is useful both to illustrate concepts of optimal design and to provide an alternate proof of the variance maximization exercise. 4.
A KEY APPLICATION
For the simple linear regression model ² (x; µ) = f T (x)µ = ¬ + x de ned over the interval ¢ = [0; 1], it is straightforward to show that the corresponding D-optimal design, ¹ D , associates the weight ! = 1=2 with ¯ each of ¯the points x1 = 0 and x2 = 1 and is such that ¯M¡1 (¹ D )¯ = 4; related results were given by Atkinson and Donev (1992, p. 38 ff). Indeed, the choice of this design to t this (linear) model function makes intuitive sense because the parameters can clearly be best (jointly) estimated with design points with the greatest spread. As mentioned in the previous section, D-optimality of this de-
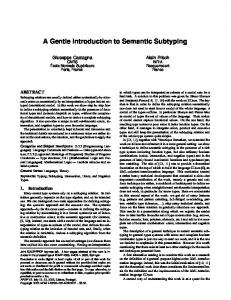
sign is easily veri ed by examining the corresponding variance function. To illustrate, a plot of this function, ¡ ¢ predicted variance 2 d(x; ¹ D ; µ) = 2 1 ¡ 2x + 2x2 = 4 (x ¡ 1=2) + 1, given in Figure 1, veri es D-optimality of ¹ D since the corresponding graph does not exceed the line y = p = 2 over the interval ¢. Further, the fact that d(x; ¹ D ; µ) = 2 at the support points (x = 0 and 1) of ¹ D also establishes uniqueness of this design. Finally, we can use these results to show that a rival design is not D-optimal. Demonstrating that the rival design (¹ R ) that associates the weight ! = 1=3 with each of the support points x1 = 0; x2 = 1=2 and x3 = 1 is indeed not D-optimal for this model ¯ function ¯and design space is established by noting both that ¯M¡1 (¹ R )¯ = 6 > 4 and by observing that a plot of the 2 correspondingvariance function d(x; ¹ R ; µ) = 6 (x ¡ 1=2) +1 crosses above the line y = 2 for several x 2 ¢; this too is shown in Figure 1. Next, consider the same linear model function reparameterized as ² 2 (x; µ2 ) = ® (x ¡ ¯ ) again de ned over the same design space ¢ = [0; 1]. For an arbitrary design ¹ , the corresponding information matrix is # " Pk ¡ ® ® 2 j= 1 !j (xj ¡ ¯ ) Pk Pk M (¹ ) = ; 2 ¡ ® j= 1 !j (xj ¡ ¯ ) j= 1 !j (xj ¡ ¯ ) and the D-optimal design therefore maximizes 2 8 k k 0 and x 2 ¢ = [0; 1]. Then by basic calculus, the corresponding variance, ¼
2
=
¬ (¬ + )2 (¬ + + 1)
is maximized for ¬ = as ¬ ; ! 0, and for which the maximal variance is 1=4. It comes as no surprise that as ¬ ; ! 0, the beta density function approaches one with equal mass at the support points x1 = 0 and x2 = 1. It therefore follows that by the equivalence established in the previous section that this two-point discrete design is also optimal over the space of Beta design measures. Interested students can nd additional results on optimal design measures in Pukelsheim (1993). 6.
DISCUSSION
This article uses the simple exercise of maximizing a variance over a class of probability mass functions to gently expose beginning students to some important concepts of optimal design theory, a topic perhaps encountered only in courses in advanced experimental design. In so doing, students easily appreciate the power and aesthetics associated with this rich theory, and are
thereby equiped to continue their study of optimal design theory and practice. [Received November 2002. Revised July 2003.]
REFERENCES Atkinson, A. C., and Donev, A. N. (1992), Optimum Experimental Designs, Oxford: Clarendon Press. Box, G. E. P., and Draper, N. R. (1987),Empirical Model-Buildingand Response Surfaces, New York: Wiley. Brady, J. E., and Allen, T. T. (2002), “Case Study Based Instruction of DOE and SPC,” The American Statistician, 56, 312–315. Chernoff, H. (1953), “Locally Optimal Designs for Estimating Parameters,” Annals of Mathematical Statistics, 24, 586–602. DeGroot, M. H., and Schervish, M. J. (2002), Probability and Statistics (3rd ed.), New York: Addison-Wesley. Dette, H., and O’Brien, T. E. (1999), “Optimality Criteria for Regression Models Based on Predicted Variance,” Biometrika, 86, 93–106. Kiefer, J. (1959), “Optimum Experimental Designs,” Journal of the Royal Statistical Society, Ser. B, 21, 272–319. (1961), “Optimum Designs in Regression Problems II,” Annals of Mathematical Statistics, 32, 298–325. (1974), “General Equivalence Theory for Optimum Designs (Approximate Theory),” The Annals of Statistics, 2, 849–879. (1975), “Optimal Design: Variation in Structure and Performance Under Change of Criterion,” Biometrika, 62, 277–288. Kiefer, J., and Wolfowitz, J. (1960), “The Equivalence of Two Extremum Problems,” Canadian Journal of Mathematics, 12, 363–366. Pukelsheim, F. (1993), Optimal Design of Experiments, New York: Wiley. Seber, G. A. F., and Wild, C. J. (1989), Nonlinear Regression, New York: Wiley. Silvey, S. D. (1980), Optimal Design, London: Chapman and Hall. Smith, K. (1918), “On the Standard Deviations of Adjusted and Interpolated Values of an Observed Polynomial Function and its Constants and the Guidance They Give Towards a Proper Choice of the Distribution of Observations,” Biometrika, 12, 1–85. White, L. V. (1973), “An Extension of the General Equivalence Theorem to Nonlinear Models,” Biometrika, 60, 345–348.
The American Statistician, November 2003, Vol. 57, No. 4
267