One of the main goals of our system is to make it easier for scientists and ... user interface builder tools we have seen simplify the task of mapping out an interface ..... for a different site to make use of their particular visualization sub-system and ...
Proceedings of the European Conference on Object-Oriented Programming (ECOOP-94), Lecture Notes in Computer Science, Springer Verlag, Volume #821, pp 474-492, July 1994.
A Geographic Environmental Modeling System: Towards an Object-Oriented Framework Bernd Bruegge and Erik Riedel School of Computer Science Carnegie Mellon University Pittsburgh PA 15213 (bruegge, riedel)@cs.cmu.edu
Abstract This paper describes our experience in developing a software system for use in the environmental modeling community. The primary user of this software is intended to be a scientist or regulator working in the area of air quality management and pollution control strategies. The main objective of GEMS is to support the end user in performing various types of analysis requiring the processing of large amounts of data and the interaction between several high-performance computing platforms. The work described here provides the basis for an application-specific framework to support this and similar applications, including other areas of environmental modeling, chemical process control, earthquake modeling, and weather prediction. We developed our system by drawing on our experience with the object-oriented development paradigm and by using the concept of rapid prototyping. We describe the initial results of our development activities, talk about our successes, and about some of the problems we have encountered.1
1. Introduction The physical and chemical processes occurring in the environment all around us are incredibly complex and scientists have only recently begun to understand and describe these phenomena to any significant degree. Considerable work has been done in the area of air quality modeling and computational science to develop systems for testing ideas about how the atmosphere functions and responds to changes. Several groups across the country and around the world are working with computational models of the atmosphere that allow scientists to experiment on the atmosphere in the context of a computer simulation rather than affecting the world directly. Although Los Angeles is often thought of as the smog capital of the world, the problem of air pollution is widespread. In the United States alone, more than sixty percent of the population is exposed to ozone air pollution levels above the Federal Ambient Air Quality Standards. There are close to one hundred urban areas across the United States that are considered in non-attainment of one or more of the standards mandated by the Clean Air Act of 1991. All this in spite of expenditures in excess of $40 billion every year on control measures. The use of supercomputers and computational experimentation is beginning to play a vital role both in unraveling the complex physics and chemistry occurring in the atmosphere, and in shaping effective public policies to control air pollution problems. Recent advances in the areas of computer and software systems has made it possible to tackle ever larger computational problems. Air quality modeling has been recognized as one of the Grand Challenge applications in High Performance Computing and Communications as identified in a series of grants from the National Science Foundation. 1. This research was sponsored by the National Science Foundation under grant number ASC-9217365.
Our task as software engineers supporting this effort is to make the power and flexibility offered by new computer technologies available to scientists and regulators to make them more effective and allow them to tackle problems of ever-increasing size and complexity. Several enabling technologies in parallel computing, high-speed networking, database management, parallel programming, and visualization are now available and we wish to provide a framework wherein users of environmental modeling system can make effective use of these new developments to solve real problems. In this paper, we will describe our initial efforts in this direction. In the section on System Architecture we will present a high-level view of our system and discuss our overall design goals. In the next five sections, we discuss the development of a prototype of such an environmental modeling system in terms of the five subsystems we have identified; we will talk about some of the successes we have had, and will mention some of the problems we encountered. In the section on Frameworks, we will try to place our effort within the context of similar efforts being pursued elsewhere. Finally, in the Future Work section we will describe our vision for the future and where the further development of this system will lead us. Please bear in mind that the system described below serves as the basis for our explorations and prototyping efforts. Considerable additional effort will have to be expended if this system is to be used outside of the research environment, but we hope to provide the insights to make such a project technically feasible.
2. System Architecture The GEMS system is decomposed into five software subsystems: User Interface, Execution, Data Management, Visualization, and Monitoring. The goal of the GEMS system is to connect these five subsystems together in a single coherent framework, and we believe an object-oriented approach is best suited for this purpose. One of the main problems for such an architecture is how to facilitate the interaction between the components of one subsystem and components from one of the other subsystems. This task is especially difficult if the individual components were not developed with this specific interaction in mind. Additional difficulties are encountered when the components are developed using different development methodologies and languages, when executing on heterogenous and physically distributed machine architectures with different operating systems, and when some of the subsystems are provided by software manufacturers and others are developed in house. The most important goals of GEMS from the end user’s perspective are ease of use and performance. The intent is to provide an “environmental spreadsheet” for the exploration of “What if...?” scenarios by a scientist or regulator. The system must provide a consistent interface to a set of physically distributed and heterogeneous computing resources cooperating to produce a given analysis and must facilitate the necessary communication among these resources. From a software development perspective, design goals of portability, reusability, and extensibility were also important. Our goal is to eventually provide a general application-specific framework for developing systems of this type while our short-term goal is to develop a prototype system to solve specifically the air quality modeling problem. Since we intend this system to evolve as technology in atmospheric science and computer science advances, we need to be able to take advantage of new ideas and systems as they become available. In the domain of atmospheric science, the system will have to be able to incorporate new insights into the workings of the atmosphere and the effects of pollutants on the environment. In the area of computer science, we will need to provide the user access to new machine architectures to perform their computations (e.g. massively parallel processing systems), new visualization tools (e.g. recent releases of the AVS system), new database systems (e.g. further maturation of Object-Oriented Database Management Systems), and new parallel programming tools (e.g. parallelizing compilers and message-passing systems). We feel that the philosophy of the GEMS framework is similar to efforts currently underway at many research labs and software firms to provide sets of reusable components that can be specialized to meet specific, and novel, user application goals, while allowing the reuse of existing designs and implementations.
3. User Interface One of the main goals of our system is to make it easier for scientists and regulator to take advantage of the power of computational experiment to aid them in their work. In the past, researchers had to spend a large amount of time and effort understanding computer systems and developing software to meet their needs. They could not simply purchase a system “off the shelf” that would allow them to perform the kinds of analysis and experiments they needed. What we would like to provide is a system where the users can spend their time on the science and engineering aspects of their work rather than the computer science and software engineering issues. As mentioned above, new, tougher air quality regulations as well as the large amounts of money being spent on control strategy development are causing more widespread interest in computational experiment. For years, air quality modeling has been the domain of a few small research groups across the nation, each with their own “home brewed” system that was accessible only to the chosen few. We see a need for a generalized system that can provide a consistent interface to the analysis and experimentation necessary. Our prototype system was developed in C++ using the X Window System and the Motif toolkit for user interface design and implementation. We explored several options [Linton 1991, DEC 1991] for using user interface builders to develop the interface to our system, but we were unsatisfied with the lack of flexibility these systems provided. The user interface builder tools we have seen simplify the task of mapping out an interface and help with the layout of the interface on screen; however, once the general layout has been defined it is much harder to make small changes to the interface than it would be if one has complete control of the implementation from the beginning. During the initial implementation of the prototype, we used the Macromind Director tool to produce the screen layout and a set of animations that demonstrated the capabilities of the interface. There was no direct translation from the Macromind Director animations to user interface code, so we used the Macromind animations as a set of “executable requirements” and implemented the system directly in Motif code. We feel that, although it requires a considerably higher up-front learning curve, implementing the system directly with the Motif toolkit allows us the maximum flexibility of implementation and extensibility. In order to fit the user interface within the rest of the system we made use of a set of “widget wrappers” developed by a research group at the Universite de Paris-Sud in France [Fekete 1991]. These widget wrappers served to encapsulate Motif widgets and callbacks in a set of objects that interacted well with the rest of the system. An example of the use of the WWL (widget wrapper library) system is given in Figure 1. The WWL format is significantly easier to under// // Zoom Slider in Overview Window // WXmScale mag_scale(form,”mag_scale”); mag_scale.ShowValue(True); mag_scale.Value(10); mag_scale.Minimum(SCALE_MINIMUM); mag_scale.Maximum(SCALE_MAXIMUM); mag_scale.DecimalPoints(1); mag_scale.ScaleMultiple(5); mag_scale.Orientation(XmHORIZONTAL); mag_scale.SetDragCallback(this, (WWL_FUN)&Overview_Shell::mag_value_cb); mag_scale.SetValueChangedCallback(this, (WWL_FUN)&Overview_Shell::mag_value_cb);
Figure 1- Code for Scale object using WWL wrapper library stand and maintain than the equivalent Motif calls shown in Figure 2. The ability to register methods on specific objects as callbacks was particularly useful, since it allowed the encapsulation of state data within individual objects. We were very satisfied with the flexibility and ease of development that the Motif toolkit in conjunction with the
// // Zoom Slider in Overview Window // Widget MapScale_w; MagScale_w = XtVaCreateManagedWidget("mag_scale", xmScaleWidgetClass, right_form, XmNshowValue, True, XmNvalue, 10, XmNminimum, 10, XmNmaximum, (int) (10 * MAX_MAG), XmNdecimalPoints, 1, XmNscaleMultiple, 5 , XmNorientation, XmHORIZONTAL, NULL); DECLARE_METHOD_ENTRY_F (xmag_cb,ui_map,mag_cb,XmScaleCallbackStruct *) XtAddCallback(MagScale_w, XmNvalueChangedCallback, (XtCallbackProc)xmag_cb, (XtPointer) this); XtAddCallback(MagScale_w, XmNdragCallback, (XtCallbackProc)xmag_cb, (XtPointer) this);
Figure 2- Code for Scale object using Motif library calls WWL library provided. We found that we were able to develop a user interface rapidly and that the system was flexible in the face of modifications and additions. The Motif toolkit along with the Widget Wrapper Library provided a set of primitives for use in managing the screen - primitives such as buttons, menus, scroll bars, and windows for managing display objects. In order to do the graphics to provide our Map display, we developed our own class hierarchy. A portion of this hierarchy is depicted in Figure 3a. The base class, Graphical_Entity represents any object that can be drawn on the screen and its various
Graphical_Entity char* name void Draw(Map_Shell* map) int Select(Point ul,Point lr) char* Info()
Segment
Polygon
Rectangle
Point p1 Point p2
Point points[] int num_points
Point ul Point lr
void Draw(Map_Shell* map) int Select(Point ul,Point lr) char* Info()
void Draw(Map_Shell* map) int Select(Point ul,Point lr) char* Info()
void Draw(Map_Shell* map) int Select(Point ul,Point lr) char* Info()
Figure 3a- Partial OMTool Object Model of the Graphical_Entity hierarchy
subclasses are specializations of this basic class which provide separate Drawing and Selection functions by overriding virtual methods common to Graphical_Entity. Since the behavior of a Graphical_Entity is well-defined, it is easy to add new types of screen objects to our system without affecting the existing code. For instance, the Rectangle object was added as a specialization of the Polygon class, in order to take advantage of a more efficient drawing routine when a rectangle was being drawn. This was particularly useful because the grid that represents the computation region of the air quality model was modelled as a collection of 2400 Grid objects, each of which was a Rectangle on the screen so the savings were considerable. In order to facilitate the display of different sets of information overlayed on the screen, the user interface makes use of a set of layers that are drawn and managed independently but form a consistent picture when drawn on the screen. The Layer hierarchy (see Figure 3b) again makes use of inheritance to provide support for different types of information. Each layer can be made up of different sets of screen objects (from the Graphical_Entity hierarchy) and each has its own scaling system. This allows us to have a Census_Layer which consists of Polygons representing TIGER [Bureau 1990] counties or districts or tract specified in latitude and longitude coordinates, a Grid_Layer which consists of a uniform set of rectangles specified by giving the lower right corner in Universal Transverse Mercator (UTM) coordinates and specifying how many grids across and down there should be, and a Source_Layer where emissions sources can be represented as rectangles (for point emission sources) or triangles (for area emission sources) and coordinates are given in UTM. The layer objects are tied together in a Map object which provides the functionality of the main map window and each layer is responsible for converting its coordinate system to the “world” coordinate system which is then translated to screen coordinates by the Map class. Map_Layer char* name void DrawAll(Map_Shell* map) EntitySet Selections(Point ul,Point lr)
Grid_Layer
Census_Layer EntitySet objects void DrawAll(Map_Shell* map) EntitySet Selections(Point ul, Point lr) Multiscale_Layer int num_elements Boolean valid[] void DrawlAll(Map_Shell* map) EntitySet Selections(Point ul, Point lr) void Initialize(Vector* field)
int num_x int num_y Boolean valid[][] void DrawAll(Map_Shell* map) EntitySet Selections(Point ul, Point lr) void Initialize(Field* field) Source_Layer EntitySet sources void DrawAll(Map_Shell* map) EntitySet Selections(Point ul, Point lr)
Figure 3b- Partial OMTool Object Model of the Map_Layer hierarchy The Layer hierarchy has served us well in making it easy to extend the system to handle different kinds of data. One extension that was recently made was the addition of a Multiscale Airshed Model to the system. The main difference between this model and the models that GEMS was already familiar with was that grids were allowed to be different sizes (see Figure 4) across the region, where initially the grids were all of uniform size. We were able to accommodate the new model simply by adding a Multiscale_Layer class which inherited all the functionality from the Grid_Layer class, but provided different methods for mapping the data to the screen. Whereas in the Grid_Layer a set of values was indexed by the X and Y location of the particular data value within the overall grid, the Multiscale_Layer specified a particular ordering of the grid squares and data values were indexed in this same order. The display of grid
Figure 4- Single scale Grid_Layer and multiple scale Multiscale_Layer squares of different sizes was trivial to implement since each was a rectangle on the screen and their sizes were completely independent.
4. Execution The Execution subsystem forms the central piece of the entire GEMS application. In order to experiment with different control strategies and to enhance their understanding of the atmosphere, atmospheric scientists have developed a set of computational models that mimic the behavior of the atmosphere but are much easier to experiment with than using the real atmosphere. These models contain descriptions of the physical and chemical processes that go on in the atmosphere and allow scientists to make predictions about how certain changes in the pollutants that enter the atmosphere will affect air quality. The models around which the GEMS system has been designed are three dimensional photochemical air quality models which embody the current understanding of the atmosphere and how things interact in the atmosphere. The models that are being used from within GEMS - the CIT (California/Carnegie Institute of
Technology) Airshed Model, the UAM (Urban Airshed Model) from the U.S. EPA and the URM developed at Carnegie Mellon University [McRae 1982] - are all implemented in Fortran and are available for a number of machine architectures. The purpose of the Execution subsystem of GEMS is to provide transparent access to these models and the underlying computational resources. The user should be able to choose which model calculations they wish to perform and which particular machine or implementation should do the calculation. In order to provide transparent access to processes running on remote hosts, we have implemented a system of message-passing and callbacks to facilitate communication. What we have developed is an event-based architecture whereby the different processes and machines interact via a set of well-known messages or events. The underlying system used to facilitate communication is the PVM (Parallel Virtual Machine) software developed at Oak Ridge National Laboratories [Beguelin 1991]. PVM provides primitives for spawning process on remote machines and for communication and synchronization between processes on different, physically distributed, and heterogeneous systems. What we have added on top on the PVM library is a mechanism for providing callbacks in response to particular messages (events). For instance, the CIT Airshed model communicates with GEMS through a set of five messages as shown in Figure 5. INIT(int ncolumns, int nhours, int nspecies) /* Parameters for this run */ COLUMN(int x, int y, int column) /* Calculation of column at (x,y) completed */ HOUR(int hour) /* Calculation of hour completed */ DATA(float concentration[]) /* Concentrations values at end of hour */ DONE(int nhours) /* Finished, total number of hours calculated */
Figure 5- PVM messages (events) between GEMS and the CIT Airshed Model In order to perform a model calculation, the user determines the appropriate parameters for a run, including the choice of which code is to be executed and the machine on which the code should run. When the user initiates a remote execution, a process is started on the remote machine (via the pvm_spawn library routine) and the parameters chosen are passed to the remote program. As the model calculation progresses, the remote program sends messages from the set described above back to the GEMS interface. Responses to these specific events (messages) are handled by registering callbacks to each of the different message types. When a given message arrives the appropriate callback is executed and the necessary action is taken. By using the same concept used by the Widget Wrapper Library described above methods on particular objects may be registered for callbacks. This means that when GEMS receives an INIT message, the Initialize method on the Grid_Layer object is called and an appropriate grid is calculated and displayed to the user. When a DATA message is received the Update method is called and the screen is updated to reflect the new data provided. The combination of events listed above allow the GEMS user to follow the progress of the remote execution and to view the data as it is calculated. The main reason we chose to implement the system as event-based with callbacks was to provide asynchronous communication between the GEMS interface and remote processes. Since the model calculations are often long-lived (they can run for hours at a time), it was important that the user be able to perform other functions while waiting for a particular calculation to complete. Our callback mechanism takes advantage of the functionality provided by the X11 event loop in processing user events. The routine that handles the dispatch of Execution sub-system callbacks is registered with the X11 event handler as an application time-out (via the XtAppAddTimeout routine) and is scheduled to be executed every 25 milliseconds. Individual callbacks must in themselves be short-lived in order to return control to the X11 event loop for processing of user interface and other Execution events. In order to allow the processing of user events and prevent the user interface from “freezing,” long computations are broken into smaller pieces which are performed as work procedures within the X11 event loop.
An event-based approach to addressing our problem is quite powerful, in that we can easily implement the concurrent execution of multiple remote processes simply by using a different set of message identifiers for each remote execution. The system of events and callbacks is also flexible in that we are able to add and remove components at will without major changes to the program. It is possible to register multiple callbacks to be executed for a single incoming event, which can allow a second object - aside from the Grid_Layer - to “listen in” on events received by the Grid_Layer - this will be important for use with the Monitoring subsystem to be described later. It is also possible for messages from the remote programs to be ignored if they are not deemed relevant. For instance, the COLUMN event described above provides feedback from the model as every grid square is calculated - this is useful with very slowrunning programs where the time between HOUR messages may be minutes or tens of minutes to provide some feedback on the progress of the calculation. On the other hand, if a model is sufficiently fast at calculating an hour of simulation then the messages after every column rapidly become unnecessary. In this case one can simply not register a callback for the COLUMN event and no action will be taken by GEMS when it receives such a message. The important thing to note is that the remote program has no idea what, if anything, is being done in response to the events it broadcasts - it does not have to know whether there are one, several, or no objects in the GEMS interface that are responding to its events. The model program simply broadcasts events and the interface can deal with them as it sees fit. In order for the event-based system to work properly the set of messages to be passed and the format of their contents must be determined at compile-time. Some thought was given to providing extensibility of the message format at runtime, but we felt that a static allocation of events and event formats was sufficient for our current needs and that the additional performance and development overhead of dynamic messages was not necessary at this time. Our current implementation makes use of the event-based scheme described above, but we are currently exploring other methods for providing remote access to resources and communication between distributed objects. Interesting work has been done in this area by the Object Management Group in their architecture for object services and the CORBA standard [OMG 1992] and by the Open Software Foundation in their work on the Distributed Computing Environment (DCE) [OSF 1991]. We will be closely examining both of these approaches to see how we might leverage this existing work in the GEMS system.
5. Data Management For many years, air quality modeling applications were bottlenecked by processor performance and the amount of data produced was small compared to the number of CPU cycles necessary. As computational performance increases and more powerful machines are applied to the problem, the amount of data produced increases as well. When we began this project in the spring of 1992, one day of simulation took 8 hours of CPU time to compute on a DECstation 5000 machine, today the same day of simulation runs in 1.5 hours on a DEC Alpha AXP and as little as 15 minutes on a set of loosely-coupled Alpha AXP machines working together in parallel [Riedel 1993]. With further advances in parallel machine architectures and parallel programming systems, we hope to see a 100-fold increase in performance in one or two years time. This means that a one day simulation will take less than 10 seconds of wall clock time. Currently, air quality modelers are limited to running scenarios of at most two or three days in duration, such a decrease in turn-around time will allow scenarios over months or even years to be computed - providing much greater insight into processes in the atmosphere. At the same time, such an increase in performance will lead to an explosion in the amount of data produced. A one-day simulation requires 20 megabytes of input data and produces 10 megabytes of output data. This means that a one-year scenario would require 7 gigabytes of input and produce 4 gigabytes of output data each time it is run. In the course of performing sensitivity analysis [Milford 1989] using the model, it will be necessary to perform up to 100 such runs, thereby reaching terabyte storage capacities. In order for all this data to be of any use, it must be possible to extract and analyze the subsets that one is interested in at any given time. There are several distinct types of data that the GEMS system must work with: Map data - extracted from the U.S. Census Department TIGER files. This data provides a vector map down to street level broken down by state, county, civil district, census tract. and census block.
Imagery data - provided by LANDSAT satellite system. This data provides a raster representation of a picture of the earth’s surface taken from space at 30 meter resolution. Elevation data - provided by the LANDSAT satellite system. This data provides elevation figures at the same 30 meter resolution as the imagery data. This allows the display of physical features such as mountain ranges and provides a representation of the topology of the area being viewed. Population data - provide by the U.S. Census Department PL94-171 and STF1A data sets. This data provides population figures and other statistics as collect by the Census Department. Data in these sets are registered to the divisions provided by the TIGER data, again down to the detail of census blocks. Gridded Model data - provided by the U.S. EPA, the National Weather Service, and local environmental protection agencies. This data provides information on the meteorology and initial pollutant concentrations which serve as the inputs for the air quality model. The output from the air quality model consists of pollutant concentrations and fluxes gridded in the same manner. Emission Source data - provided by the U.S. EPA and local environmental agencies. This data provides information on the sources of pollutants in a region under study. This information, in addition to the meteorological conditions, are the major input parameters to the air quality model. We think that our data management needs can best be met by use of an existing Object-Oriented Database Management System (OODBMS). We feel that such a system is particularly useful for the geographically encoded data including the Map, Population, and Emission Source information - which has a relatively complex structure but is also relatively small in size. The size of these data sets are small only when viewed in relation to the other three data types, the TIGER data for the entire United States is distributed on 45 CD-ROMs and comprises 25 gigabytes of data. The full detail Census population figures require several additional gigabytes. These sets are manageable because only a subset of the data (several tens of megabytes) is needed at any one time for a given simulation. The LANDSAT Imagery and Elevation data is somewhat harder to manage due to their size and the manner in which it is accessed. As delivered, the data is divided into Red, Green, Blue, and Elevation figures per cell. In order to form a picture at a given resolution, all four sets must be extracted (with averaging done to provide resolutions lower than the full 30 meter detail) and the colors combined to form a single value for display. In order to provide a three dimensional image (by taking into account the elevation figures) the data must be sent to a visualization system for rendering. The Gridded Model data has the additional requirement that it must be accessible to the Execution subsystem and will be provided to the air quality models. The models that make up the Execution subsystem are programs separate from the main GEMS system and must run across a variety of hardware platforms and software environments. The model currently exists for the Cray YMP-C90, the DEC Alpha, the Intel Touchstone Delta, a “supercluster” of ten DEC Alpha machines connected with a high-speed network, and a version for the Cray T3D massively parallel architecture is currently being developed. The use of heterogeneous machines requiring different data formats and involving different performance characteristics must be taken into account. Performance of the data management sub-system is also very important on machines such as the Cray YMP-C90 since we do not want this system to be bottlenecked in performing I/O operations. In our current prototype system, we are using Objectivity as our OODBMS [Objectivity 1992]. We are currently managing the Map, Population, and Emission data and pointers to the Imagery, Elevation, and Gridded data with Objectivity. In evaluating systems for use to provide Data Management, we also looked at the Exodus OODBMS software from the University of Wisconsin [Richardson 1989], and the POSTGRES system from the University of California Berkeley [Stonebraker 1987]. We were very impressed with the performance of the Exodus system but we eliminated it from further consideration due to the fact that the Exodus development group has moved on to other projects and is no longer supporting Exodus or extending that work. The POSTGRES system is not strictly object-oriented in the manner of Objectivity - it provides some object extensions to the relational system embodied by the INGRES system (also developed by a group at UC- Berkeley under Michael Stonebraker). We found the performance of POSTGRES
inadequate and there were major questions about the ability of the system to handle multiple, concurrent users which is one of our basic requirements. Our search for the perfect OODBMS system to meet our needs is by no means complete and we are still evaluating new systems that would meet all of the requirements of our final system.
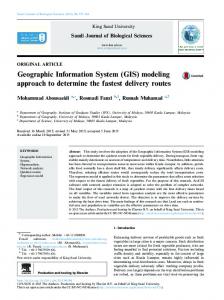
6. Visualization The air quality models of the Execution subsystem produce a considerable amount of data. In order for this data to provide useful insight into the workings of the atmosphere it must be visualized in a form that users can readily interpret. We have made use of an existing visualization system - PV-Wave from Precision Numerics, Inc. [PV-Wave 1992] - to produce a visual representation of the model outputs. The PV-Wave product provides a command language that can be used to control the functioning of PV-Wave from an external program. In our prototype implementation, data is provided to PV-Wave via a remote procedure call and data is returned to GEMS via the same system. PV-Wave combines the LANDSAT imagery data, the TIGER map data, and the gridded model data representing pollutant concentrations to form a three dimensional image of the pollution over a given region. An example of an ozone cloud over Los Angeles can be seen in Figure 6. The picture depicts an iso-surface enclosing all regions with ozone concentrations of 0.12 ppm or higher. A value of 0.12 ppm is used since this is the National Ambient Air Quality Standard (NAAQS) for ozone, any concentrations above this value are considered harmful to human health. The data shown represents predicted values at 9:00 AM on August 27, 1987; the data was calculated on a Cray YMP-C90 and the visualization produced on a Sun SPARCstation 10. One of our main goals in the design of the Visualization sub-system was to encapsulate the actual system being used as much as possible. PV-Wave is a licensed product and their are several other systems with similar functionality in use for modeling work in different labs throughout the air quality modeling community. We wanted to make it easy for a different site to make use of their particular visualization sub-system and not be explicitly tied to PV-Wave. Our main difficulty in this direction was that PV-Wave (and most of the commercial visualization systems we have so far come across) expect to be the main driver of what a user sees [IBM 1992, PV-Wave 1992]. Since we wanted users to remain within our own user interface we were essentially pushing PV-Wave in a direction it was not intended to go. Visualization systems such as PV-Wave or AVS have been used in the air quality modeling community for some time to make sense of the output from the computational models. However, these tools were designed as general visualization systems, to be used for everything from air quality modeling to the design of jet engines. Since they were designed as general purpose systems, only a small subset of the functionality was ever used for Air Quality Modeling, but a user had to learn how to make use of the more general primitives in order to do their work. We wanted to provide the user with only the specific set of functionality they needed for their air quality analysis. This means we had to provide a user interface on top of the existing PV-Wave functionality to shield the user from the underlying complexity, while at the same time allowing them to take full advantage of the power of the tool. Both Precision Numerics and AVS have recently provided a set of user interface primitives to build exactly such a layer of abstraction on top of their systems; however we feel that these systems limit our flexibility considerably over doing the interface ourselves. If we were to build our entire system as an interface inside of PV-Wave, then everyone using our system would be required to purchase a PV-Wave license - even if they were already using and familiar with another visualization system. It would also be difficult to integrate the use of an OODBMS system with an interface built on PV-Wave since we would be limited to the primitives PV-Wave provided.
7. Monitoring The Monitoring subsystem makes use of the BEE++ distributed event environment [Bruegge 1993] to support the software-based distributed dynamic performance analysis of the application. Similar to the Execution subsystem, the Monitoring subsystem takes an event-based approach by viewing the execution of a distributed program as a stream of events. BEE++ provides customizability of all aspects of events processing - customizability of events, customizability of event views, and customizability of event configurations. Event and view customizability is achieved through the inheritance mechanism available in C++.
Figure 6- Ozone Cloud over Los Angeles BEE++'s entire event processing system is encapsulated in a set of core base classes. From these, additional classes needed to support various aspects of dynamic analysis tool development can be derived. BEE++ provide the user with a prepackaged hierarchy of classes and the means to create customized classes through derivation from the appropriate base class(es). While this assumes knowledge of object-oriented design and how subclassing is implemented in C++, it is the most nonintrusive way to extend or modify the functionality of BEE++, since the components of the event processing model can be altered or replaced without modifying existing code. This avoids the recursive problem of debugging a user-customized analysis tool, in particular a debugger itself, because the user can assume that the class library is verified and validated. Configuration customizability allows the dynamic establishment of user-defined events with user-defined views that can be modified during execution. BEE++ supports three kinds of performance analysis: post-game analysis, runtime monitoring, and during-game analysis. Post-game analysis, also called post-mortem analysis, is the traditional way to analyze event traces and many sophisticated tools have been developed for this type of monitoring. Post-mortem analysis is unacceptable for performance debugging of non-terminating programs such as servers, such analysis requires runtime monitoring tools. Runtime monitoring is useful to monitor processes that take a long time to complete but deliver useful information early in their execution. In many cases the behavior of an algorithm can be judged from monitoring information obtained quite early during the execution. An example where this is useful is the design of computationally expensive algorithms. One problem in connection with runtime monitoring is that the human users are hard-pressed to digest visualizations unfolding in real-time. To address this problem BEE++ provides a special set of classes for during-game analysis, which allows a user interface to display past events while new events are still pouring in. This allows the user to browse a visual display of the system as it appeared at a previous point in time without losing new information. BEE++'s class abstractions hide the synchronization and caching schemes needed to implement this feature efficiently. A major issue in the design of GEMS system in the area of performance analysis was the communication between the performance analysis tools and the other GEMS subsystems. The design of many dynamic analysis tools is centered
around a client-server architecture. This is sufficient if the tool is either a debugger or a performance monitor, but not both. The goal of the BEE++ component was to provide a uniform platform for both activities and thus the GEMS architecture follows a symmetric, peer-to-peer approach. Events flow between the application program and the dynamic analysis tools over two distinct communication pathways which are called the Firehose and the Trickle. The Firehose consists of methods that send event instances to the dynamic analysis tool which processes them using usersupplied routines. The analyzer can also request information from the target program via the Trickle. The set of all the methods defined by the Firehose and the Trickle, that is, all methods of the base class EVENT, is called the event protocol. The chief reason the event protocol provides bidirectional traffic is to support performance debugging as well as correctness debugging. In monitoring and visualization situations, the target program performs the bulk of the event generation and sends the events to the tool for interpretation. In debugging situations, the dynamic analysis tool generates program control and data events and sends them for interpretation by the target application. The connection between the target application and the analyzer is provided by the event configuration manager and can be set up dynamically at any time during the execution of the target application.
8. Frameworks In order to increase the productivity of software development efforts and to properly leverage work that has already been explored elsewhere, the concept of reuse is becoming increasingly important. Object-oriented development permits the reuse of design as well as specific pieces of code. A distinction has been made between abstract classes that provide reusable designs for individual components, and frameworks which provide reusable designs for entire applications or subsystems. [Johnson 1991] Frameworks provide a higher level of reuse than abstract classes and allow considerable leverage in the rapid development of software systems. In recent years, many software development groups have been working to make the job of developing novel applications easier by providing frameworks within which new applications can be developed. We classify existing frameworks into three categories - code-level, user interface, and application-specific. Codelevel frameworks provide class libraries covering general data structures such as collections, search tables or trees. The first such framework was the Smalltalk class library. Another example is the NIH library[Gorlen 1990] which is a reimplementation of the Smalltalk class library in C++. User Interface frameworks are designed to support the development of general applications that can provide a consistent look and feel across different applications. MacApp, for example, is a user interface-level framework that makes the task of building applications programs for the Macintosh faster and easier [MacApp 1990]. Other examples of user interface specific frameworks for the construction of user interfaces include the Andrew Toolkit (ATK) [Palay 1988], the X Toolkit (Xt) [Nye 1990], Interviews [Linton 1989] and ET++ [Weinand 1989]. Application-specific frameworks support the design of applications in a specific application domain. BEE++ is an domain-specific framework for the development of software-based distributed dynamic analysis tools [Bruegge 1993]. The domain-specific software architecture (DSSA) work at IBM provides a process for reuse of domain-specific software frameworks and design rationales [Tracz 1993]. The eventual goal of GEMS is to provide an application-specific framework to support software development in the environmental modeling community. The main problem faced by the designer of environmental modeling system is the heterogeneity of the computational platforms and the difficulty of connecting the various subsystems needed to perform a computation. The goal of the GEMS framework is to provide a plug-and-play architecture that allows a developer to rapidly build software systems to support environmental modeling. The two key aspects of GEMS that support this type are an underlying object-oriented system model and the set of protocols for the interaction between the GEMS components which allow new components to be easily incorporated into the framework.
9. Conclusion We have described the architecture of GEMS, a framework for distributed modeling of air pollution designed around a set of five subsystems - User Interface, Execution, Data Management, Visualization and Monitoring - communicat-
ing with each other via a set of protocols. Each of these protocols defines the behavior of a GEMS subsystem, and collectively they define the overall behavior of the GEMS framework. The subsystems are modeled as a set of classes and user customizable extension is achieved via the use of inheritance. The paper describes a project in progress. A prototype of GEMS has been successfully implemented and is running on a variety of distributed architectures including DEC Alpha and DECstation machines, Sun SPARC workstations, loosely-coupled of Alpha workstations and Cray supercomputers. The User Interface subsystem of the framework is written in X and Motif encapsulated within a set of widget wrappers and communicates with the rest of the framework via callbacks. Communication with the Execution subsystem is achieved with a remote execution protocol defined on top of the PVM. message-passing system. Communication with the Monitoring subsystem is via a peer-to-peer event protocol implemented on top of TCP/IP. Visualization is achieved via a client-server protocol with a commercial visualization subsystem. Data within GEMS is managed by an object-oriented database management system used in conjunction with a distributed file system. The primary advantage that this system provides to a user is to hide the many idiosyncracies of working with different architectures, distributed data, and heterogeneous machines and provide a powerful analysis tool to aid in their experimentation.
10. Future Work The final goal of our research is to develop a generalized framework for systems in the domain of environmental modeling. We have chosen to take a bottom up approach to this development. We have identified five subsystems User Interface, Execution, Data Management, Visualization, and Monitoring - as the basic building blocks common to environmental modeling applications. The work described above represents our initial exploration of the issues and difficulties involved in developing these components. Our next step will involve generalizing the lessons we have learned and building the interconnections of our framework. The initial prototype is specific to the domain of air quality management, but there are several similar classes of problems that can be tackled within the general framework we propose. We expect that our work will extend beyond air quality modeling to other types of environmental modeling, chemical process simulation, earthquake modeling and weather prediction. The core modeling program for such systems shares many common characteristics with the air quality models we are already using and the design characteristics are very similar - in terms of the amount of data to be managed, the necessity for remote execution, and the need for generalized and very specific user interface systems. Our second goal will be to use our generalized applicationspecific framework and the lessons learned in the development of the air quality management system to implement a similar application in the area of chemical process control. In addition to providing the initial proving-ground for our framework development, we hope that the GEMS application described above will be used by members of the air quality management community to help solve some of their most pressing problems.
11. Acknowledgments The authors would like to recognize the contributions of the following people, without whom the GEMS system in its present form would not have been possible: Armistead Russell, Gregory McRae, David Rothenberger, Todd Kulick, Karen Fabrizius, Jon Bennett, Michael Cham, Jon Caron, John Butare, Jason Barshay, William Sabram, Jennifer Kerstein, Christie Johnson, Peter Steenkiste, Edward Segall.
12. References [Beguelin 1991] Beguelin, A.; Dongarra, J. J.; Geist, G. A.; Manchek, R.; & Sunderam, V. S. A User’s Guide to OVM Parallel Virtual Machine. Oak Ridge National Laboratory, 1991. ORNL/TM-11826.
[Beguelin 1993] Beguelin, A.; Dongarra, J.; Geist, A.; & Sunderam, V. “Visualization and Debugging in a Heterogenous Environment.” Computer 26,6 (June 1993): 88-95. [Bruegge 1993] Bruegge, B.; Gottschalk, T.; & Luo, B. “A Framework For Dynamic Program Analyzers,” 65-82. Proceedings of OOPSLA 1993. Washington, DC: ACM Press, September 1993. [Bureau 1990] Bureau of the Census. TIGER: The Coast-to-Coast Digital Map Data Base. Washington, DC: U.S. Department of Commerce, 1990. [DEC 1991] DEC Visual User Interface Tool (SPD 42.51.00). Maynard, MA: Digital Equipment Corporation 1991. [Fekete 1991] Fekete, Jean-Daniel. WWL: Widget Wrapper Library for C++. Orsay Cedex, France: Laboratoire de Recherche en Informatique, February 1991. [Gorlen 1990] Gorlen, K.; Orlow, S.; & Plexico, P. Data Abstraction and Object-Oriented Programming in C++. Chichester, England: John Wiley & Sons Ltd., 1990. [IBM 1992] IBM Visualization Data Explorer User’s Guide. Yorktown Heights, NY: IBM Corporation, Thomas J. Watson Research Center, November 1992. [Johnson 1991] Johnson, Ralph E.; & Russo, Vincent F. Reusing Object-Oriented Designs (UIUCDCS-R-91-1696). Urbana, IL: University of Illinois at Urbana-Champaign, Department of Computer Science, 1991. [Linton 1989] Linton, M.A.; Vlissides, J. M.; & Calder, P. R. “Composing User interfaces with Interviews.” Computer 22, 2 (February 1989): 8-22. [MacApp 1990] Macapp 2.0 General Reference Manual. Cupertina, CA: Apple Computer 1990. [McRae 1990] McRae, Gregory J.; & Russell, Armistead G. “Smog, Supercomputers, and Society.” Computers in Physics (May/June 1990): 227-232. [McRae 1982] McRae, G. J.; Goodin, W. R.; & Seinfeld, J. H. “Development of a Second Generation Mathematical Model for Urban Air Pollution: I. Model Formulation.” Atmospheric Environment 16 (1982): 679-696. [Milford 1989] Milford, J. B.; Russell, A. G.; & McRae, G. J. “A New Approach to Photochemical Pollution Control: Implications of Spatial Patterns in Pollutant Responses to Reductions in Nitrogen Oxides and Reactive Organics.” Environmental Science and Technology 23 (1989): 1290-1301. [Nye 1990] Nye, A.; & O'Reilly, T. X Toolkit Intrinsics Programming Manual. O'Reilly & Associates, Inc., 1990. [OMG 1992] Object Management Group. Object Services Architecture (OMG Document 92.8.4). Framingham, MA: Object Management Group, Inc., 1992. [Objectivity 1992] Objectivity/DB Documentation. Menlo Park, CA: Objectivity, Inc. 1992. [OSF 1991] Open Software Foundation. Remote Procedure Call in a Distributed Computing Environment. Cambridge, MA: Open Software Foundation. August 1991. [Palay 1988] Palay, A.; Hansen, W.; Kazar, N.; Sherman, M.; Wadlow, M.; Neuendorffer, N.; Stern, Z.; Bader, M.; & Peters, T. “The Andrew Toolkit: An Overview.” Proceedings of the USENIX Technical Conference, 1988. [PV-Wave 1992] PV-Wave Command Language User’s Guide. Boulder, CO: Precision Visuals, Inc. 1992.
[Riedel 1993] Riedel, Erik; & Segall, Edward. Demonstration of Geographic Environmental Modeling System. Portland, OR: Supercomputing ‘93, November 1993. [Richardson 1989] Richardson, J.; & Carey, M. “Persistence in the E Language: Issues and Implementation.” Software Practice and Experience 19 (December 1989). [Rumbaugh 1991] Rumbaugh, J.; Blaha, M.; Premerlani, W.; Eddy, F.; & Lorenson, W. Object-Oriented Modeling and Design. Englewood Cliffs, NJ: Prentice-Hall, 1991. [Rumbaugh 1992] Rumbaugh, James. Object Modeling Tool (OMTool) User’s Manual. Version 3.14. Scenectady, NY: GE Corporate Research and Development, February 1992. [Stonebraker 1987] Stonebraker, M. R.; & Rowe, L. A. The POSTGRES Papers (Research Memo UCB/ERL M86/ 85) Berkeley, CA: University of California - Berkeley, 1987. [Tracz 1993] Tracz, W.; Coglianese, L.; & Young, P. “A Domain-Specific Software Architecture Engineering Process Outline.” SIGSOFT Software Engineering Notes 18,2 (April 1993): 40-49. [Weinand 1989] Weinand, A.; Gamma, E.; & Marty, R. “Design and Implementation of ET++, a Seamless ObjectOriented Application Framework.” Structured Programming 10, 2 (1989): 63-87.