Vol .2,No.4,December2016
Int. J. of Geol. & Earth Sci., 2016
Pandian M et al., 2016 ISSN 2395-647X www.ijges.com Vol. 2, No. 4, December 2016 © 2016 IJGES. All Rights Reserved
Research Paper
A GEOMATICS APPROACH - STRUCTURAL MAPPING AND AUTOMATED LINEAMENT EXTRACTION IN PARTS OF CENTRAL TAMIL NADU Pandian M1*, Shruthi N1 and Pavithra K1
*Corresponding Author: Pandian M
[email protected]
The area of this study is one of the important places in central part of Tamil Nadu, which contains many ore deposits, plantation fields, and villages. Because of this, study of geological structures (lineaments) is one of the most important factors, which gives indications about the locations of ore deposits, and groundwater movements. Shaded relief images and Landsat 8 are helpful in identifying lineaments in different distinct relief and topography. The method can enhance lineaments at different orientations by simulating topographic illumination under varied light directions. Combining four shaded relief images into a final image leads to enhancing lineaments within the four sun azimuth directions. Two shaded relief images with multi-directional light were created, the first image with the four azimuth angles of the light sources that are 0°, 45°, 90° and 135°, and the second image with the four azimuth angles of the light sources that are 180°, 225°, 270°, and 315°. Both images have been used for automatic lineament extraction using PCI Geomatica software. The extracted lineaments of the first image show that the most automatic lineaments represent positive lineaments; and the automatic lineaments of second image represent negative lineaments of the study area. The directional analysis of the automatically extracted lineament maps have been done with the reference of the fault map of the area. The results verify the similarity in the directional behaviour of the lineaments, the fault lines and the structures measured in the field. The main trends of the extracted lineaments ofboth images are NW-SE, N-S, E-W and NE-SW. Keywords: Digital elevation model, Shaded relief, GIS, Geomaticaand automatic lineament
INTRODUCTION
shaded relief algorithms. The most widely used is the shaded relief algorithm, because perception of elevation can be attained and when combined with other type of images, new products can be produced. DEM, unlike Landsat images, represent true reap projections with no distortion;
DEM data are digital elevation data set demo the topographic surface form of any area. Topographic features can be mined from digital elevation data by applying special computer processes. These contain slope, aspect and 1
Centre for Remote Sensing, Bharathidasan University, Khajamalai Campus, Tiruchirappalli 620023, Tamil Nadu, India.
This article can be downloaded from http://www.ijges.com/current-issue.php 11
Int. J. of Geol. & Earth Sci., 2016
Pandian M et al., 2016
lineament extraction (positive and negative lineament extraction).
tonal variations are entirely identified with relief, the sun position can be placed anywhere above the terrain surface, and in most cases, DEM has better resolution than satellite images (Batson et al., 1975; Schowengerdt and Glass, 1983). Techniques of shaded relief have been used in cartography to produce the illusion of a 3dimensional relief map (Yoeli, 1965). In the case of DEM’s, shaded relief images and terrain derivative maps (slope, aspect and curvatures) have largely demonstrated their usefulness for lineaments and fault extraction (Ganas et al., 2005). Linear features that can be extracted from DEMs often provide useful information for scientists.
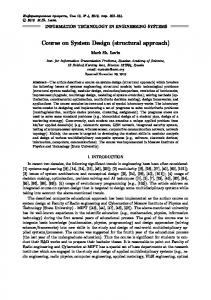
PHYSIOGRAPHY OF THE STUDY AREA The study area is situated in the Central part of Tamil Nadu, India, about 1316.77 sq. km, between 78°09’00" E and 10°30'00" N and 78°09’00" E and 10°11’00" N. The hills form a compact block consisting of several hill ranges, and tangled ridges and Valleys running in the northeast and southwest directions in Parts of Tirchirappalli, Madurai, Dindigul, Pudukkottai and Sivaganga districts of Central Tamil Nadu. It falls in the survey of India Toposheet 57J/2, 3, 4, 6, 7and 8 on 1:50,000 scale. The mean maximum and minimum temperatures are 34.2 °C and 19 °C. The annual average rainfall ranges from 512 to 1150 mm, both from the northeast and southwest monsoons. Topographically, the area is undulating with an altitude varying from 100 to 950 m. The rocks of study area are chiefly Charnockite, Quartzite and gneisses/granitic in composition.
The term “lineament” is one of the greatestgenerally used standings in geology. A lineament is any wide-ranging linear surface on a planet, as a fault line or fracture line. Hobbs (1904) first used the term lineament to define a significant line of landscape of Basement rocks. O’Leary et al. (1976) described the term lineament as a map able, simple or composite linear feature of a surface whose parts are aligned in a rectilinear or slightly curvilinear relationship and which differs from the pattern of adjacent features and presumably reflects some subsurface phenomenon. Lineaments can be defined as linear topographical or tonal features on the terrain representing zones of structural weakness (Williams, 1983). Encouraging straight lineaments, interpreted as linear ridges, scarps, ridges, troughs and crater (light toned lineaments) and negative straight lineaments, representing joints, faults, and shear zones (dark toned lineaments). The determination of this research is to explain the capability of shaded relief images with multidirectional of the light foundations derived from digital elevation module for
AIM AND OBJECTIVES The present study is mainly focused, • To extract automated lineaments using Landsat 8 satellite image with the help of PCI Geomatica software. • SRTM DEM (90 m spatial resolution) has been used to prepare shaded relief map with 8 different azimuth angle respectively (00, 450, 900, 1350, 1800, 2250, 2700, 3150) Solar Elevation 300. • To identify the structural trend lines, fold and fault maps extracted from the shaded relief. • Rose diagram has been prepared to identify the orientation of lineaments using Rockworks software.
This article can be downloaded from http://www.ijges.com/current-issue.php 12
Int. J. of Geol. & Earth Sci., 2016
Pandian M et al., 2016
• Field visit has also been done to identify the geological structure, trend lines, lineament orientation and different rock types.
The DEM was geo-rectified using topographic maps with points collected at road intersections and other landscape features throughout the area. Shaded relief images were derived from a Digital Elevation Model (DEM) with a resolution of 30 meters are used for linear extractions. In order to identify linear topographic features from the DEM, eight shaded relief images were generated. The first step is the production of eight separate shaded relief images with light sources coming from eight different directions. The first shaded relief image created had a solar azimuth (sun angle) of 0°, and a solar elevation of 30°.
MATERIALS AND METHODS The geological map of the study area (Figure b) has been digitized from geological resource maps prepared by Geological survey of India (GSI)
Data Dispensation The environment of elevation data is constant, not separate. However, due to the limitation of recent technology, DEM data can be displayed in forms, i.e., grid, contour, profile, and TIN (Triangulated Irregular Network) which are not completely continuous. In this study, these data are displayed in the form of grid. The DEM was acquired from contour map and was originally generated by digitize the contour lines and give the contour lines the height value they represent, then converted it into grid form.
An ambient light setting of 0.20 was used, which produces a good contrast. The ambient light setting is simply a scaling factor in the imagine topographic program (Erdas, 1998). The other seven shaded relief images were created with seven contrasting illumination directions 45°, 90°, 135°, 180°, 225°, 270°, and 315°. The second
Figure 1: Study Area
This article can be downloaded from http://www.ijges.com/current-issue.php 13
Int. J. of Geol. & Earth Sci., 2016
Pandian M et al., 2016
Figure 2: Field Survey
Breakage Qu artz vein
Figure 3: Lithology Map
Figure 4: Contour Map
step is to combine four shaded relief image to produce one shaded relief image, for this purpose, the combinations of the four shaded relief maps are computed by using GIS overlay technique, where the first four shaded relief images are overlaid to produce one image with multi-illumination directions (0°, 45°, 90°, and 135°) and the second overlay is to produce one
image with multi-illumination directions (180°, 225°, 270°, and 315°). Finally, those two images have been used for automatic lineaments extraction over the study area.
Lineament Extraction The lineament extraction process of PCI Geomatica software comprises of edge detection,
This article can be downloaded from http://www.ijges.com/current-issue.php 14
Int. J. of Geol. & Earth Sci., 2016
Pandian M et al., 2016
Figure 5: Lineament Map
Figure 6: Structural Trend Line
Figure 7: Shaded Relief and Rose Diagram
over two shaded relief images under the default parameters of the software as follows:
thresholding and curve extraction steps (PCI Geomatica, 2001). These steps were carried out
This article can be downloaded from http://www.ijges.com/current-issue.php 15
Int. J. of Geol. & Earth Sci., 2016
Pandian M et al., 2016
Figure 8: Field Survey
Joins & fracture
Quartz mining
Rock outcrop
Valley
CONCLUSION
major force acting in NE-SW direction. Since the fold axis are oriented in NW-SE direction the major force acting perpendicular to the fold axis. Similarly the lineaments are analyzed parallel to the major force direction which evident to the tectonic setup of the terrain. Regionally, in the entire south India the major force act in EW direction which results in NS lineament are Released fractures and EW lineament are Extensional fractures. Drainage and lineament density maps reveal that Maxima was in NE-SW directions
In this present research paper the lineaments in the area of Central Tamil Nadu were automatically extracted using the module LINE of PCI Geomatica from two different sensors, SRTM and LANDSAT 8. A comparison was made between the different bands to select the best bands for lineament extraction. A methodology for lineament extraction and analysis is developed. This methodology has been proven as a suitable method for lineament extraction and analysis by comparison with the geological data for the Central Tamil Nadu. The density map of lineament indices and rose diagrams of the extracted lineaments indicate the same geological structure as reported before. The density map of average length of lineament can be used to define the fracture zone in the study area.
Trend line map reveals that, Fold axes are fall on NW-SE directions, Fold style map with lineaments and Structural trend line reveals that, Force may act in NE-SW directions.From that Regional force acted in NE-SW directions N-S and E-W lineaments are shear fractures, NE-SW lineaments are extensional fractures, and NWSE lineaments are released fracture
By comparing with drainage anomaly and lineament anomaly map also confined that the
This article can be downloaded from http://www.ijges.com/current-issue.php 16
Int. J. of Geol. & Earth Sci., 2016
Pandian M et al., 2016
REFERENCES
Geomorphological Mapping Using Remote Sensing and GIS—A Field Based Mapping Part of Salem, Tamilnadu, India”, African Journal of Geo-Sciences Research, Vol. 2, No. 1, pp. 16-22.
1. Abdullah A, Akhir J M and Abdullah I (2010), “Automatic Mapping of Lineaments Using Shaded Relief Images Derived from Digital Elevation Model (DEMs) in the Maran-Sungai Lembing Area, Malaysia”, Electronic Journal of Geotechnical Engineering, Vol. 15, No. (J), pp. 949-957.
8. Prabaharan S, Subramani T, Manonmani R and Ramalingam M (2013), “Satellite Lineaments and Subtle Structures in Cauvery Basin-Tamilnadu”, International Journal of Remote Sensing & Geoscience, Vol. 2, No. 3.
2. Abdullah A, Akhir J M and Abdullah I (2010), “The Extraction of Lineaments Using Slope Image Derived from Digital Elevation Model: Case Study, Sungai Lembing-Maran Area, Malaysia”, Journal of Applied Sciences Research, Vol. 6, No. 11, pp. 1745-1751.
9. Ramasamy S M (1995), “Lineament Analysis and Stress Modeling of Vindhvan Basin, Rajasthan, India”, Memoir Geological Society of India, Vol. 31, pp. 279-310.
3. Anbazhagan S and Saranathan E (2001), “Structure and its Impact in Uthangarai and Thirthamalai Region, Tamil Nadu, India Using Remote Sensing Technique”, Journal of the Indian Society of Remote Sensing, Vol. 29, pp. 187-195.
10. Ramasamy S M (2006), “Holocene Tectonics Revealed by Tamil Nadu Deltas, India”, Journal of Geological Society of India, Vol. 67, No. 5, pp. 637-648. 11. Ramasamy S M (2006), “Remote Sensing and Active Tectonics of South India”, International Journal of Remote Sensing, Vol. 27, No. 20, pp. 4397-4431, Taylor and Francis, London.
4. Blanford H F (1865), “On the Cretaceous and Other Rocks of South Arcot and Trichinopoly Memoir”, Geological Survey of India, Vol. 4, p. 1.
12. Ramasamy S M and Anbazhagan S (1994), “Remote Sensing for Artificial Recharge of Groundwater”, NNRMS Bulletin, pp. 35-37, Department of Space, Bangalore.
5. Casas A M, Cortes Angel L, Maestro A, Soriano M A, Riaguas A and Bernal J (2000), “A Program for Lineament Length and Density Analysis”, Computers and G eo scienc es , Vol. 26 , N os. 9/ 1 0, pp. 1011-1022.
13. Ramasamy S M and Balaji S (1995), “Remote Sensing and Pleistocene Tectonics of Southern Indian Peinsula”, Internationsl Journal of Remote Sensing, Vol. 13, pp. 2375-2391.
6. O’Leary D W, Friedman J D and Pohn H A (1976), “Lineament, Linear, Lineation: Some Proposed New Standards for Old Terms”, Geological Society America Bulletin, Vol. 87, pp. 1463-1469.
14. Ramasamy S M and Karthikeyan N (1998), “Pleistocene/Holocene Graben along Pondicherry-Cumbum Valley, Tamil Nadu, India”, Geocarto International, Vol. 13, No. 3, pp. 83-90.
7. Pandian M, Amrutha D E and Sakthivel G (2014), “Lithological, Structural and
This article can be downloaded from http://www.ijges.com/current-issue.php 17
Int. J. of Geol. & Earth Sci., 2016
Pandian M et al., 2016
15. Ramasamy S M and Kumanan C J (2000), “Eyed Drainages Observed in IRS Imagery in Tamil Nadu and their Geological Significance”, International Journal of Remote Sensing, Vol. 21, No. 3, pp. 475-481.
Lineaments and their Tectonic Significance in Some Areas of Northern Iraq Using Remote Sensing Techniques and GIS”, International Journal of Enhanced Research in Science Technology & Engineering, Vol. 2, No. 2.
16. Ramasamy S M, Kumanan C J, Selvakumar R and Saravanavel J (2007), “Drainage Anomalies Observed in IRS Satellite Imagery and their Tectonic Significance in South India”, International Journal of Applied Earth Observation and Geoinformation (in Press).
18. Valdiya (2001), “Tectonic Resurgence of the Mysore Plateau and Surrounding Regions in Cratonic Southern India”, Current Science, Vol. 81, pp. 1070-1089.
17. Rayan Ghazi Thannoun (2013), “Automatic Extraction and Geospatial Analysis of
This article can be downloaded from http://www.ijges.com/current-issue.php 18