Q IWA Publishing 2006 Journal of Hydroinformatics | 08.1 | 2006
13
A GIS-based tool for distribution system data integration and analysis Martin Tre´panier, Vincent Gauthier, Marie-Claude Besner and Miche`le Pre´vost
ABSTRACT The causes of water quality problems in distribution systems are difficult to identify because they can be related to numerous sources. A tool has been developed to integrate and analyse water distribution system data with the help of geographical information system (GIS) technologies. This approach uses a flexible software architecture to gather data on distribution system structural elements, water quality sampling and especially distribution system events, all of which can be key to explaining water quality problems. The tool has been applied to five water utilities in North America and Europe, all with different data formats and data gathering practices. The approach was successful in explaining about 40% of positive coliform samples at the Laval (Quebec) utility. It also led to better data quality and responsiveness at the utilities. Key words
| Distribution system, geographic information systems, integrated approach, water quality
Martin Tre´panier (corresponding author) Mathematics and Industrial Engineering Department, E´cole Polytechnique de Montre´al, PO Box 6079, Station Centre-Ville, Montre´al Que´bec, H3C 3A7 Canada Tel: +1 514 340 4711 X4911 Fax: +1 514 340 4173 E-mail:
[email protected] Vincent Gauthier Veolia Water – Ge´ne´rale des Eaux, Direction technique, 103 rue aux Are`nes, BP 60045 57003 Metz, France Marie-Claude Besner Miche`le Pre´vost Civil, Geological and Mining Engineering Department, E´cole Polytechnique de Montre´al, PO Box 6079, Station Centre-Ville, Montre´al Que´bec, H3C 3A7 Canada
INTRODUCTION Water distribution systems (DS) involve a diversity of
This paper presents the development of a knowledge-
structural components, water flow characteristics and
representation GIS-based tool for distribution system data
environmental aspects. Therefore, computer tools for effec-
integration and analysis. The tool is part of an “integrated
tive management of a distribution system should be capable
approach”, proposed for the explanation and prevention of
of integrating data related to hydraulics, water quality and
coliform events in water distribution systems (Besner et al.
operational events (breakages, complaints) in order to gain a
2001). The application of this integrated approach was
better picture of situations occurring in the system. Unfortu-
subsequently further tested in five municipalities in Europe
nately, although there are many tools available for hydraulic
and North America (Montreal, Laval and Moncton,
modelling, only a few of them are designed to integrate the
Canada; Egham, UK; Caen, France) to evaluate its
operational and quality data that are needed to successfully
applicability to different utilities and its performances in
analyse specific spatio-temporal events such as water quality
explaining several types of water quality problems.
problems. Some centralised systems and solutions do exist,
This spectrum of applications leads to a variety of forms
but they demand a large amount of resources, both human
and quantities of data, resulting in a GIS-based approach
and material, which are not always available to utilities. There
which has to be more flexible than traditional application-
are also some difficulties to cope with uncertain, missing and
centric software. In this paper, data integration will be
erroneous data.
addressed as the most important topic because of the
doi: 10.2166/jh.2006.004
14
M. Tre´panier et al. | A GIS-based tool for distributed system data integration and analysis
Journal of Hydroinformatics | 08.1 | 2006
utility.
(2002a): plant breakthrough, local contamination (intrusion)
The concepts of ontology and knowledge representation
following pipe breaks, survival or regrowth of micro-organ-
must be looked at in order to understand the usability of the
isms, network deterioration, pipe flushing, etc. Data on each
methodology. Then, the architecture and methodological
of these elements should therefore be gathered in order to
aspects of the integrated approach will be presented. One of
conduct the best possible analysis. For example, a bacterial
challenges
that
it
presents
in
operating
a
the characteristics of the approach is that it uses a
regrowth model has been examined by Zhang et al. (2004) to
lightweight computer architecture, which is not costly and
understand the interactions between these parameters but no
at the same time is flexible enough to be compatible with the
real world experiments were conducted. Gauthier et al. (2001)
computer environments of the various utilities. The paper
identified five categories of topics on which data should be
will then demonstrate the ability of the tool to integrate
collected to improve the understanding of water quality
multiple sources of data from different actors within the
variations: water quality measures, characteristics of DS,
utilities and provides some results obtained from the
hydraulics, DS events and external events (weather). Let us
exercise.
remind ourselves that, as reported by Beck & Lin (2003), the main difficulty is to cope with the complexity of the
DATA INTEGRATION: A BROAD CHALLENGE Bringing together data on water network structural
interactions between the measures in water quality, in addition to the difficulty in coping with missing and erroneous data.
elements, events taking place in the systems and water
Interesting efforts have been expended to develop
quality into a single integrated application is not a simple
integrated DS network management systems. Boulos et al.
task, since different parameters are involved in each case.
(1997) proposed a database-centric approach using Auto-
As reported by Ray (1996), water utilities are usually asset-
CAD where data are gathered on several layers of
driven, and distribution system management functions are
information about network structure (pipes, valves), com-
divided among several departments. Typically, the water
plaints, fire hydrants and other relevant components of the
network is managed through the usage of hydraulic model
DS. Here, data are directly input by the system and so the
simulation software in the engineering department. The
information structure has to be known from the start.
assets inventory is usually the responsibility of the public
Some authors have proposed GIS-centred applications
works department, where there is a concern about the age
(McCorley 2000) in which information has to be spatialised.
of the network elements and their maintenance. Finally,
Barcellos (2000) superimposed data on census, water
water quality data are gathered by more “quality sensitive”
quality, DS and health in a GIS environment and tried to
teams generally located at the treatment plant. There, the
find relationships between them. GIS was also coupled to
concerns are related primarily to microbiological quality
spatial system dynamics for simulation of water resource
and measures such as pH, disinfectant concentration,
systems by Ahmad & Simonovic (2004). Chan & Valmores
turbidity and other quality features. Into this sparse
(2003) proposed an intranet-based filing system for water
distribution of tasks we can add customer complaints
distribution planning documents and Kamojjala et al. (2003)
compilation, hydrant operation by fire fighting crews, street
presented interesting works on the integration of models,
cleaning and a series of other actions which can take place
enterprise, SCADA and spatial data for planning and
in the distribution system and which are performed by other
operational support, but with few references to water
city or regional organisations.
quality data. Finally, the vision of Hinthorn et al. (2003)
There is a need to integrate data from these various
about real-time monitoring of water quality in distribution
sources, especially to examine water quality problems that
systems should be encouraged, but for now water utilities do
can bring systems out of compliance with respect to
not all have the resources needed for this kind of system.
regulations and public health, such as the occurrence of
Technical problems arise when attempting to group
coliforms in distributed water. As a matter of fact, there can be
data from different sources and in different formats, when
several causes for coliform events, as listed by Besner et al.
no assumptions are made about their quality or structure.
15
M. Tre´panier et al. | A GIS-based tool for distributed system data integration and analysis
Journal of Hydroinformatics | 08.1 | 2006
For example, structural data can be obtained from hydraulic
In order to apply an adequate knowledge represen-
modelling software, in a given set of X – Y coordinates and
tation, it is important to integrate data in such a way that the
with given attributes which may be incompatible with the
application is not influenced by data structure. Data
GIS. Quality data can be stored in non-geocoded, spread-
structure should be indulged, not overcome (Davis et al.
sheet files. Complaints data can be paper-based. Definitions
1993). Therefore, more data does not necessarily mean
and categories of complaints, events and pipe breaks can
better analysis if the data have not been properly integrated.
vary from one utility to another, or even between depart-
A phenomenon, which could be called “data indigestion”,
ments in the same utility. There can be other problems as
can occur when there is more data available than the system
well, among them: different measurement units, coordinates
can absorb. For example, one automated data collection
which may not match (geographic imprecision), different
system would provide several thousand records in a single
languages, etc.
day, while other available data are manually gathered once
Once data have been correctly brought together, they
a day. To avoid data indigestion, there is a need to focus on
must then be adequately analysed. Savic & Walters (1999)
central data pieces with specialised querying features, at an
identified several technologies related to hydroinformatics
adequate level of resolution.
which could be used for data analysis: data mining and knowledge discovery, geographic information systems, artificial neural networks and genetic algorithms.
Object-oriented approach Object-oriented approaches have succeeded in organising and analysing large quantities of data (Tre´panier &
ONTOLOGY
Chapleau, 2001). The identification of objects in a system helps to define their roles and the events that can be
Ontological approaches have proven to be effective in
triggered by them, thus facilitating computer programming
domains such as speech recognition, grammar editing and
of applications. Object-oriented techniques were success-
semantic webs (Bouquet et al. 2004). Similar methods can
fully implemented by Spanou & Chen (2001) in the case of
be applied to water quality data analysis. We emphasise
the Upper Mersey River water quality modelling.
here the importance of knowledge representation, the use of
A broader image of a system can be obtained, then, by
an object-oriented approach and the accountancy of the
establishing relations between objects. In the present case,
level of resolution in the analysis process.
this object-oriented approach is separated from the programming language and database storage in order to avoid
Knowledge representation
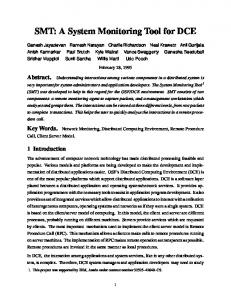
any influence from one to the other. The object model in Figure 1 presents a non-exhaustive list of objects which are
“Knowledge representation (KR) is the study of how
involved in the “life” of a distribution system. Any object
knowledge about the world can be represented and what
could trigger a water quality event and therefore must be
kinds of reasoning can be done with that knowledge.” This
considered in the object model. For example, contractors
short definition by Ginsberg (1993) summarises the main
could cause a microbial intrusion event during a pipe repair,
design challenges for any software intended for DS analysis.
land use change could cause a variation in water demand,
To achieve an adequate knowledge representation of water
etc.
quality events in a distribution system, the proposed
Objects are usually easier to identify than events. Before
approach recognises the following expert-system basics: 1)
gathering data, some work must be carried out to classify and
there is a trigger event to analyse, 2) inference rules are to be
characterise objects and events in order to arrive at a uniform
derived in order to search for the cause of the event, 3) the
basis for the comparison of utilities. Complaints are a good
rules are applied to data sets and the results are observed
example of ambiguous event objects. At one utility, phone
with the most appropriate tools (GIS, spreadsheet) and 4)
complaints from customers were distinguished from infor-
feedback from inference rules is used to refine the criteria.
mation calls related to invoices and accounts, for example,
16
M. Tre´panier et al. | A GIS-based tool for distributed system data integration and analysis
Figure 1
|
Journal of Hydroinformatics | 08.1 | 2006
Example of object model for the Distribution System.
while this was not the case elsewhere. Work has been done to
but are associated with DS events which can have occurred
find uniform definitions, if needed.
many hours or days before. These timescale differences must be taken into account when performing database queries to
Level of resolution
investigate the causes of water quality events. The problems related to the level of resolution of data
The level of resolution is another factor to be considered
must be addressed with great care. It is important not to lose
when collecting data from different sources. In a traditional
pieces of information while trying to fit data to the spatial
GIS-based application, the spatial levels of resolution of data
and temporal units chosen.
have to be similar in order to superimpose information in layers. In this project, many differences were encountered, such as: complaints registered at address level, pipe breaks
METHODOLOGY
coded at street level, valve operations for pipe flushing
This section describes the methodology that has been found
entered at zone level and events without geographic
to be the most suitable for data integration and analysis,
information. Units and projections of all kinds were also
regarding the data obtained from the five utilities. At first,
found: longitude/latitude, in-house coordinates and hydrau-
the need for a GIS-based tool was clearly defined, since
lic software coordinates.
spatial and temporal proximity must be considered when
The temporal level of the resolution of data must also be
querying water quality events.
examined. Figure 2 shows a timeline where a water quality problem (coliform event) is illustrated with a vertical line at time “t”. Sampling data are punctual events not necessarily
Architecture
synchronised with the “real” water quality (coliform) event,
The architecture of the GIS-based tool is lightweight and
at the specific time it occurs. Other events, like complaints,
open. It integrates four software components, as shown in
may have an assigned file date (i.e. the date of the phone call),
the data flow diagram in Figure 3. Data from water utilities
17
M. Tre´panier et al. | A GIS-based tool for distributed system data integration and analysis
Journal of Hydroinformatics | 08.1 | 2006
Water utilities use other tools as well. Therefore, data must be exchanged between these tools and this approach. The City of Laval uses the 4D database management system for some data gathering (4D Inc., San Jose, CA). Therefore, an interface has been put in place to directly transfer output into Excel files (Microsoft Corp., Redmond, WA). Other software, such as Microstation (Bentley Systems, Exton, PA) and AutoCAD (Autodesk, San Rafael, CA), were also involved in our work, showing that the open architecture is quite flexible.
Data gathering To facilitate exchanges and manipulation, a spreadsheet Figure 2
|
Temporal level of resolution of DS data.
application (Excel) is used to gather and structure data. Excel is a widely used spreadsheet application with a
are collected and geocoded, and then put into Excel
compatible file format in its three most recent versions (XP,
workbooks, accompanied by metadata. DS hydraulic
2000, 97). This medium has proved to be suitable for this
modelling is performed with EPANET software version
project and its multiple data formats, since many distri-
2.00.10 (Rossman 2000). Information is consolidated by
bution system operators are “spreadsheet-literate”. Work-
means of the in-house software, IMADSIG (in French:
books are created to store the data. Typically, they include
Interface de mode´lisation et d’acquisiton de donne´es pour
data on a major topic, with several worksheets as subtopics.
un syste`me d’information ge´ographique (data modelling
For example, the “Network Structure” workbook contains
and acquisition interface for a geographic information
“Nodes” and “Links” worksheets.
system)). With this software, users have the ability to
To document data structure and usage, a metadata
identify various types of quality events to be analysed and
workbook is used to describe the contents and the use of
to create circumstantial queries. Data are then extracted
all data workbooks and their sheets (Figure 4). In
and converted into GIS format for visualisation in the GIS
addition to the file list, metadata includes file properties
data viewer ArcExplorer (ESRI, Redlands, CA).
such as: descriptions, dates, user, geographic information
Figure 3
|
Data flow diagram for the GIS-based tool.
18
M. Tre´panier et al. | A GIS-based tool for distributed system data integration and analysis
Figure 4
|
Journal of Hydroinformatics | 08.1 | 2006
Metadata workbook contents.
fields, GIS topology types and GIS topology fieldnames. It
data were normalised and tips were provided to utilities to
also contains a list of all fields from all tables (sheets)
help them enter normalised data. Typographical and other
along with their description, type and size. Information
errors were also found and corrected at this point.
on GIS visualisation attributes such as style, colour and
† Validation. Univariate and multivariate validation were
size can also be stored. An advantage of this set-up is that
necessary in order to make the data comparable and
field names can be changed to adapt to each system,
rankable. Univariate validation consists of classifying
especially in this study where both French and English
complaint types, breakage causes and other attributes.
names are used. Field formats and sizes can also be easily
For example, in the city of Laval, complaint types were
changed by users as well, with minimal constraints as to
reduced from 24 to 7 in order to better categorise them.
their contents and to their use of attributes.
Multivariate validation was used in particular for data geocoding, where more than one field can be used for
Data processing
treatment. Intersection information, for example, which is composed of two street name fields, was validated in
Some work is needed to prepare data before the IMADSIG
accordance with intersection files, thus simplifying the
interface software and its post-processing units are used for
geocoding process. Address information, which is com-
investigating databases. Depending on the data source and
posed of a civic number and a street name, was corrected
format, the relevant steps are:
in a similar way.
† Capture. For some utilities, data were only available on
† Geocoding. Data geocoding is an important issue to
maps or in paper-based documents. Data was manually
consider when gathering distribution system data with
entered in Excel and formats were transmitted back to
this approach. Even though some of the data may already
utilities to provide them with a base on which they could
have been geocoded by utilities, coordinate conversion
continue entering data. In more advanced utilities,
and projection stretching may be needed to fit projection
systematic procedures have been developed to permit
systems. The level of resolution of the geocoding step
direct geocoding of data with the help of an address-
depends on the quality of the data and the quantity of
point file containing all the civic addresses connected to
information available. Some choices were made to match
the DS with their X – Y coordinate attributes.
each type of data to the best topological object (Table 1).
† Formatting. Often, even thought data are available in
A hierarchy of geocoding levels of resolution is used to
numerical format, they have to be formatted for introduc-
geocode incomplete information: Global Positioning
tion into database-like software. For that reason, some
Systems (GPS) X – Y coordinates, if available, then civic
M. Tre´panier et al. | A GIS-based tool for distributed system data integration and analysis
19
Table 1
|
GIS topological features used for data visualisation
Journal of Hydroinformatics | 08.1 | 2006
also query other pieces of information such as, for example, all the pipes of a certain age, etc. Since each object datafile has
Feature
Usage
Point
Sampling stations, complaints (customer’s residence), hydrants, valves, treatment plants, tanks, pipe breaks
interface was added to the tool. The first part consists of a
Link (two points polyline)
Pipes, pumps
temporal proximity (on or about a date) to be performed on
Polyline
Streets
Area (polygon)
Flushing zones, districts, municipalities
Attached feature
Quality measures (attached to sampling stations), treatment plant events, flushing operations (attached to flushing zones)
its own structure and attributes, a two-part flexible querying multi-table querying wizard, where users can quickly specify queries based on spatial proximity (radius search) and several tables at a time. The wizard directly generates the Structured Query Language (SQL) phrases associated with the queries, which is a big advantage for people who are not knowledgeable about SQL. Multiple queries are grouped into searches which can be identified, stored and annotated by users, providing a simultaneous overview of a given situation. Search results are available through Excel and DBF files, and shapefiles are created to be visualised with a GIS viewer. A
number (address), intersection (two street names), street
search log is provided to list the number of elements found or
arc (street name, only for short streets) and zone.
to report errors in the process.
Data conversion The IMADSIG prototype interface software was specifically developed for the project (Figure 5). The software,
Hydraulics
programmed in Visual FoxPro (Microsoft Corp., Redmond,
A special IMADSIG module analyses the EPANET simu-
WA), has several features: data conversion, GIS shapefile
lation reports in order to reproduce the state of the
creation, hydraulic software report processing and query
distribution system during an extended simulation period
functions.
to obtain stabilised results, taking into account the demand
IMADSIG’s first task is to convert XLS data to DBF
variations and various conditions of operation. From these
(database file) format, using the information provided in the
records of several thousands of results, the Visual FoxPro
metadata workbook. The DBF format is a widely used PC-
database engine is used to calculate statistics such as
database format and is compatible with a great deal of
minimal, maximum and average pressure, flow, velocity
software. Data structure consistency (good field type, field
and water age for each pipe of the network. The information
sizes, rounding) is checked during this operation. IMAD-
is then reintroduced as a data component which can be
SIG then converts DBFs to shapefiles. IMADSIG uses the
queried and displayed geographically.
metadata workbook to make topologic objects out of DBF
This result is also used by a network proximity
flatfiles. This whole operation is called “rough” conversion
algorithm which has been developed to retrieve the trace
and is aimed at spot-checking for errors in the files such as bad formatting, mismatched field names or types or spatial attributes that are wrong. Users can easily go back to datafiles and correct the errors as needed. Querying databases
of the water in the distribution system, from treatment plant(s) to a given location in the network where a water quality variation has been identified. This algorithm identifies all the pipes in which the water may have circulated to supply the specific point, in order to maximise the area where the possible source of the problem may be
IMADSIG software is also used to query data in order to find
looked for. This quite intuitive method is presented in
causalities between DS events, DS structure, hydraulic
Figure 6 where node N1 is a specific location to be
features, quality data and water quality problems, but can
investigated.
20
M. Tre´panier et al. | A GIS-based tool for distributed system data integration and analysis
Figure 5
|
IMADSIG interface for data conversion.
Figure 6
|
Algorithm to retrieve all water paths towards a given node (T = water age, L = pipe length, D = pipe diameter, Q = flow).
GIS visualisation
Journal of Hydroinformatics | 08.1 | 2006
IMPLEMENTATION
This task requires the use of a GIS viewing tool. ArcExplorer, free software provided by ESRI, is powerful
Refinement of the methodology used for this research
enough to view large geographical files and is used in this
project is the result of a partnership between five utilities:
project to examine the shapefiles created by IMADSIG
Montreal, Laval and Moncton (Canada), Egham (United
(Figure 7). To facilitate search result visualisation, ArcEx-
Kingdom) and Caen (France) (for Caen, please refer to
plorer project files are produced by IMADSIG. These
Jaeger et al. (2002)). The City of Laval implementation of the
project files reference and format the layers created by
methodology is presented here as an example of the
IMADSIG during the querying process.
applicability of the approach.
21
M. Tre´panier et al. | A GIS-based tool for distributed system data integration and analysis
Figure 7
|
Journal of Hydroinformatics | 08.1 | 2006
Result visualisation in ArcExplorer.
Laval is a city of about 350,000 inhabitants located north of Montreal. Its 1465-km-long water distribution
DISCUSSION
system is supplied by three water treatment plants. In Table
The approach presented in this paper differs from other
2, the Laval database gathered through this project is
valuable work published on the subject in that five different
described. A major challenge was the geocoding step,
utilities were involved in the study, all with specific needs,
mainly because of the large amount of data. As shown in
data availability and data formats. This explains the relative
the table, most of the data was geocoded manually. Today,
lightweight nature of the tools in comparison with some other
geocoding is semi-automatic, thanks to the availability of an
(more costly) advanced commercial systems. Another reason
address database.
for the choices that were made is the presence, in these
The use of the GIS-based tool in Laval was aimed at
utilities, of established procedures and software for data
identifying the causes of water quality events, especially the
collection and hydraulic modelling. On the one hand, our
occurrence of positive coliform samples. The interactive
approach had to be flexible enough to interface with these
tool has been used to query the database on 88 positive
tools, while on the other, it had to accept manually entered
total coliform samples during the time period 1997– 2000.
data without much manipulation. The approach is not
Data on treatment plant activities, water quality parameters
intended to impose a specific data standard that would
and distribution system events were analysed. This study
have to be respected. In our view, data standards have a
was the scope of a paper by Besner et al. (2002b). Results of
negative effect, since the restrictions that they impose tend to
the application showed that, in some cases, distribution
reduce the amount of usable information, with the risk of
system events such as unidirectional flushing performed as
overriding some regional aspects of data formats and
part of established programs, valve and hydrant manipula-
contents. The choice of software elements (Excel spread-
tions and lower pressures may have led to microbiological
sheet, ArcView GIS, EPANET and an in-house interface)
water quality problems. A highly probable cause has been
reflects the openness of the approach.
identified for about 43% of the positive coliform samples investigated.
This work has been marked by a paradigm shift: while trying to gather data to find the causes of the presence of
22
Table 2
M. Tre´panier et al. | A GIS-based tool for distributed system data integration and analysis
|
Journal of Hydroinformatics | 08.1 | 2006
Available data from City of Laval. (Geocoding method: A = automatic, M = manual.)
No. of records
Native format
Temporal coverage
Geocoding
Geocoding method
M
Water quality (DS and treatment plant) Sampling stations þ plants
15
Excel
1997 – 2000
100%
Total coliform
9946
4D
1997 – 2000
Ass. to sampling stations and treatment plants
Atypical bacteria
9613
4D
1997 – 2000
k
Free chlorine
3345
4D
1997 – 2000
k
Water temperature
9321
4D
1997 – 2000
k
Turbidity
9235
4D
1997 – 2000
k
Conductivity
9110
4D
1997 – 2000
k
pH (treatment plant only)
3284
4D
1997 – 2000
Ass. to treatment plants
HPC (treatment plant only)
3284
4D
1997 – 2000
Pipes
24303
Piccolo (Safege, France)
Data conversion
M
Nodes
21538
Piccolo (Safege, France)
Data conversion
M
Hydraulic results
70MB
EPANET/text file
Data conversion
A
Valve operations
32798
Excel
1997 – 2000
99.9%
AþM
Hydrant operations
25021
Excel
1997 – 2000
99.9%
AþM
Pipe breaks
3302
Excel
1996 – 2000
94.2%
AþM
New pipes
183
Excel
1997 – 2000
100%
M
Pipe rehabilitations
197
Excel
1997 – 2000
100%
M
Flushing zones
51
Paper maps
Manually
M
1951
4D
99.7%
AþM
M
Hydraulics
Operation and maintenance
Customer complaints Complaint log
1991 – 2000
Others Plant events
Hand-written
At plant
Street coverage
GIS
Already done
Basemap
GIS
Already done
23
M. Tre´panier et al. | A GIS-based tool for distributed system data integration and analysis
Journal of Hydroinformatics | 08.1 | 2006
coliforms in water distribution networks, it was found that
(Greater Cincinnati Water Works and Denver Water
data integration problems had to be solved first. These
Department) to illustrate how data integration can help in
problems led us to consider that a special kind of tool was
identifying causes of customer complaints (Besner et al.
needed to address them. This is why knowledge represen-
2003; Martel et al. 2005). It is also currently being applied in
tation should be used in the tool to clearly identify the
one French distribution system operated by Veolia Water
objects present and the relationships between them. The use
(City of Metz).
of GIS has been an obvious choice from the beginning, since problems in distribution systems are geographically distributed. The approach also has some limitations:
CONCLUSION
† The variety of data sources and formats resulted in extra
Integrating data on distribution systems is a task that
work on data validation and conversion. For example,
requires the strong commitment of several actors in a water
with computer applications in five cities, two languages
utility. The GIS-based tool developed in this project, with its
and on two continents, problems arose with regional
lightweight architecture, represents a flexible approach
Microsoft Windows settings, the decimal separator, etc.
which has been implemented in five utilities in North
† The absence of precise adapted event definitions in some
America and Europe, each with its own problems and
utilities forced the use of knowledge representation in
specificities regarding the water system and its database-
the process, thereby extending data collection delays.
related management. What was initially a tool to specifically
In some utilities, these changes had to be implemented
reveal the causes of water quality problems has become a
before extra data were collected.
tool for integrating many kinds of other information on DS
† The majority of data were not geocoded, and so extensive efforts were made to add geocoding procedures at the
and is quickly demonstrating its usefulness for general DS management purposes.
collection source. † There are limitations due to the use of Excel spreadsheets for data gathering (65,535 records), but this can be overcome with the direct conversion of database management systems to DBF formats.
ACKNOWLEDGEMENTS This work was performed in the framework of a larger research project and was supported by Veolia Water and
It is clear that, with this approach, utilities will have to be more “responsible” for their data collection procedures, to ensure better use of data. For example, IMADSIG led the City of Laval to add a geographic component to their own 4D system and to enter data more quickly when events occur on the network. Technicians are now more aware of data quality because they can visualise and better analyse them in an operational context. The tool is now also used in
the Industrial Partners of the NSERC (Natural Sciences and Engineering Research Council of Canada) Industrial Chair on Drinking Water of the Ecole Polytechnique de Montre´al. The Cities of Laval and Montreal (Quebec, Canada), the City of Moncton (New Brunswick, Canada), the City of Egham (United Kingdom) and the City of Caen (France), provided expertise and databases for case studies. Thanks also to Robert Chapleau for his input in the project.
ways unintended initially, such as infrastructure maintenance and network mapping. Some developments are still to come regarding the IMADSIG system and its components. Data exchange between corporate systems and the tool could benefit from technologies like XML (extended mark-up language). In its actual state of development, the approach has also been tested in two water utilities in the United States
REFERENCES Ahmad, S. & Simonovic, S. P. 2004 Spatial system dynamics: new approach for simulation of water resources systems. J. Comput. Civil Engng. 18 (4), 331 –340. Barcellos, C. 2000 Health risk analysis of the Rio de Janeiro water supply using Geographic Information Systems. Interdisciplinary
24
M. Tre´panier et al. | A GIS-based tool for distributed system data integration and analysis
Perspectives on Drinking Water Risk Assessment and Management. IAHS Publication No. 260, pp 95–99. Beck, M. B. & Lin, Z. 2003 Transforming data into information. Wat. Sci. Technol. 47 (2), 43 –51. Besner, M. C., Carrie`re, A., Pre´vost, M. & Martel, K. D. 2003 Use of data integration to identify the causes of customer complaints in distribution systems. Proc. American Water Works Association, Water Quality and Technology Conference, Philadelphia, PA, CD-ROM. Besner, M. C., Gauthier, V., Servais, P. & Camper, A. 2002a Explaining the occurrence of coliforms in distribution systems. J. AWWA 94 (8), 95 – 109. Besner, M. C., Gauthier, V., Morissette, C. & Pre´vost, M. 2002b Identification of the main causes of total coliforms in a distribution system. Proc. American Water Works Association, Water Quality and Technology Conference, Seattle, WA, CD-ROM. Besner, M.-C., Gauthier, V., Barbeau, B., Millette, R., Chapleau, R. & Pre´vost, M. 2001 Understanding distribution system water quality. J. AWWA 93 (7), 101 –114. Boulos, P. F., Heath, E. J., Feinberg, D. H. & Ro, J.-J. 1997 Water distribution network management: a fully integrated approach. J. NEWWA 111 (6), 180 –188. Bouquet, P., Giunchiglia, F., van Harmelen, F., Serafini, L. & Stuckenschmidt, H. 2004 Contextualizing ontologies. Web Semantics: Science, Services and Agents on the World Wide Web 1 (4), 325– 343. Chan, C. D. & Valmores, M. A. 2003 Web-based GIS with a planning database. Proc. American Water Works Association, Information Management and Technology Conference, Santa Clara, CA, CD-ROM. Davis, R., Shrobe, H. & Szolovits, P. 1993 What is a knowledge representation? AI Mag. 14 (1), 17 –33. Gauthier, V., Besner, M.-C., Tre´panier, M., Millette, R. & Pre´vost, M. 2001 Tracking the source for microbial contamination in distribution systems using an integrated approach. Proc. American Water Works Association, Water Quality and Technology Conference, Nashville, TN, CD-ROM. Ginsberg, M. 1993 Essentials of Artificial Intelligence. Morgan Kaufmann. San Mateo, CA.
Journal of Hydroinformatics | 08.1 | 2006
Hinthorn, R., Wilson, L., Moshavegh, F. & Yadav, S. 2003 A vision for real-time monitoring and modelling of water in water distribution systems. Proc. American Water Works Association, Information Management and Technology Conference, Santa Clara, CA, CD-ROM. Jaeger, Y., Gauthier, V., Besner, M. C., Viret, B., Toulorge, R., Lemaire, E., De Roubin, M. R. & Gagnon, J. L. 2002 An integrated approach to assess the causes of drinking water quality failures in the distribution system of Caen. Wat. Supply Wat. Sci. Technol. 2 (3), 243– 250. Kamojjala, S., Fang, M. & Jacobsen, L. J. 2003 Integration of models, enterprise, SCADA and spatial data for planning and operational support. Proc. American Water Works Association, Information Management and Technology Conference, Santa Clara, CA, CD-ROM. Martel, K., Hanson, A., Kirmeyer, G. J., Besner, M. C., Carrie`re, A., Pre´vost, M., Lynggaard-Jensen, A. & Bazzurro, N. 2005 Data Integration for Water Quality Management. AwwaRF Rep. AWWA. Denver, CO. McCorley, S. 2000 GIS application at Bergen Water. Wat. Supply 18 (4), 24 – 30. RAY, C. F. 1996 The use of GIS in a major water utility company. Proceedings, ICE: Civil Engineering, 1996. 114/special issue 2, pp 23 –29. Rossman, L. A. 2000 EPANET User’s Manual. US Environmental Protection Agency, Washington, DC. http://www.epa.gov/ ORD/NRMRL/wswrd/epanet.html Savic, D. A. & Walters, G. A. 1999 Hydroinformatics, data mining and maintenance of UK water networks. Anti-Corrosion Meth. Mater. 46 (6), 415 –425. Spanou, M. & Chen, D. 2001 Modelling of the Upper Mersey River system using object-oriented tools. J. Hydroinf. 3 (3), 173 –194. Tre´panier, M. & Chapleau, R. 2001 Analyse oriente´e-objet et totalement de´sagre´ge´e des donne´es d’enqueˆtes me´nages origine-destination. Revue canadienne de ge´nie civil 28 (1), 48 – 58. Zhang, W., Miller, C. T. & DiGiano, F. A. 2004 Bacterial regrowth model for water distribution systems incorporating alternating split-operator solution technique. J. Environ. Engng. 130 (9), 932 –941.