RESEARCH ARTICLE
Effect of Tobacco Control Policies on Information Seeking for Smoking Cessation in the Netherlands: A Google Trends Study Sigrid A. Troelstra1*, Jizzo R. Bosdriesz1, Michiel R. de Boer2, Anton E. Kunst1 1 Department of Public Health, Academic Medical Center, University of Amsterdam, Amsterdam, the Netherlands, 2 Department of Health Sciences, Faculty of Earth and Life Sciences, VU University, Amsterdam, the Netherlands *
[email protected]
Abstract OPEN ACCESS Citation: Troelstra SA, Bosdriesz JR, de Boer MR, Kunst AE (2016) Effect of Tobacco Control Policies on Information Seeking for Smoking Cessation in the Netherlands: A Google Trends Study. PLoS ONE 11 (2): e0148489. doi:10.1371/journal.pone.0148489
Background The impact of tobacco control policies on measures of smoking cessation behaviour has often been studied, yet there is little information on their precise magnitude and duration. This study aims to measure the magnitude and timing of the impact of Dutch tobacco control policies on the rate of searching for information on smoking cessation, using Google Trends search query data.
Editor: Lion Shahab, University College London, UNITED KINGDOM Received: February 25, 2015
Methods
Copyright: © 2016 Troelstra et al. This is an open access article distributed under the terms of the Creative Commons Attribution License, which permits unrestricted use, distribution, and reproduction in any medium, provided the original author and source are credited.
An interrupted time series analysis was used to examine the effect of two types of policies (smoke-free legislation and reimbursement of smoking cessation support (SCS)) on Google searches for ‘quit smoking’. Google Trends data were seasonally adjusted and analysed using autoregressive integrated moving average (ARIMA) modelling. Multiple effect periods were modelled as dummy variables and analysed simultaneously to examine the magnitude and duration of the effect of each intervention. The same analysis was repeated with Belgian search query data as a control group, since Belgium is the country most comparable to the Netherlands in terms of geography, language, history and culture.
Data Availability Statement: Data are publicly available and can be downloaded directly from Google Trends (www.google.com/trends).
Results
Accepted: January 19, 2016 Published: February 5, 2016
Funding: This work was supported by the European Commission, Directorate-General for Research and Innovation, under the FP7-Health-2011 program, with grant agreement number 278273; http://ec.europa.eu/ research/fp7/index_en.cfm. The funder had no role in study design, data collection and analysis, decision to publish, or preparation of the manuscript. Competing Interests: The authors have declared that no competing interests exist.
A significant increase in relative search volume (RSV) was found from one to four weeks (21–41%) after the introduction of the smoking ban in restaurants and bars in the Netherlands in 2008. The introduction of SCS reimbursement in 2011 was associated with a significant increase of RSV (16–22%) in the Netherlands after 3 to 52 weeks. The reintroduction of SCS in 2013 was associated with a significant increase of RSV (9–21%) in the Netherlands from 3 to 32 weeks after the intervention. No effects were found in the Belgian control group for the smoking ban and the reintroduction of SCS in 2013, but there was a significant increase in RSV shortly before and after the introduction of SCS in 2011.
PLOS ONE | DOI:10.1371/journal.pone.0148489 February 5, 2016
1 / 16
Information Seeking for Smoking Cessation: A Google Trends Study
Conclusions These findings suggest that these tobacco control policies have short-term or medium-term effects on the rate of searching for information on smoking cessation, and therefore potentially on smoking cessation rates.
Introduction Smoking is the leading cause of preventable deaths in high income countries and is associated with an increased risk of lung cancer, ischemic heart disease, stroke, high blood pressure, oesophagus cancer and chronic obstructive pulmonary disease [1]. In 2012, the prevalence of cigarette smoking in the Netherlands was estimated at 26% [2]. Around 80% of the smokers wanted to quit smoking, 28% attempted to quit smoking in the past year but only 4 to 10% of the smokers trying to stop succeeded in this for at least a year [2]. Effective tobacco control legislation and services are considered the key factor to reduce smoking prevalence and tobacco related diseases [3]. The Netherlands has implemented several tobacco control policies since 2000. In 2003, the Dutch Tobacco Act was amended to include a ban on sales to youth under sixteen and a ban on sponsoring and advertising. Furthermore, major anti-tobacco campaigns were launched on a national level [4]. In 2004, national smokefree legislation in the workplace was implemented, followed by smoke-free legislation in hospitals and nursing homes in 2005 and a smoke-free legislation in the hospitality industry in 2008 [5]. In 2011, reimbursement of smoking cessation support (SCS) by health insurance was implemented, which was cancelled in 2012 but reintroduced in 2013. Research on the long-term effects of Dutch tobacco control legislation suggests that introducing smoke-free legislation has increased quit attempts. However, no effect was found on successful quit attempts [5]. A study on causality of smoke-free legislation and smoking cessation suggested that smoke-free legislation could influence smoking cessation through changing attitudes towards smoking cessation and intention to quit smoking [6]. Furthermore, it was stated that the Dutch smoke-free hospitality legislation might have lost its effectiveness due to non-comprehensiveness and unsupportive media attention. However, the magnitude and duration of these effects on short to mid-term outcomes remain unknown. Quit attempts are challenging to measure, since this requires a large study population and often relies on selfreported behaviour. Furthermore, estimating effects of policy on quitting can be challenging due to potential confounding by other concurring events. Therefore, precursors of quit attempts for smoking may be needed to measure with greater precision the relation between the implementation of tobacco control policies and smoking cessation. Data on smoking cessation-related behaviour could be used to examine the magnitude and duration of the effects of tobacco control policies. Smoke-free legislation can increase smokers’ thinking of smoking cessation by creating growing awareness of the harms of smoking and by reinforcing negative social norms towards smoking. This may produce a growing intention to quit smoking, which may have long-term effects on smoking cessation [7]. It is suggested that in countries with a high level of tobacco control policies, a larger proportion of smokers intends to quit within the next six to twelve months [8]. However, very few large scale studies have been performed on the effect of tobacco control policies on precursors of smoking cessation and cessation-related behaviour [9]. As a result, there is little information on the precise magnitude and duration of the effect of various tobacco control policies [5]. Based on studies on the effect of smoking cessation policies on quit attempts, we hypothesize that the introduction of smoke-free legislation will cause a temporary increase in search
PLOS ONE | DOI:10.1371/journal.pone.0148489 February 5, 2016
2 / 16
Information Seeking for Smoking Cessation: A Google Trends Study
queries with a maximum duration of six months [10–14]. Based on findings from two RCTs and a real life study on the effects of reimbursement of SCS, it is expected that the reimbursement of SCS will cause a longer increase in search queries of maximally two years [15–17]. In this article, internet search query data are applied in quasi-experimental design to measure the effect of tobacco control policies on a national level. The aim of this study is to measure the magnitude and duration of the impact of the Dutch smoke-free legislation and reimbursement of smoking cessation support in terms of search query data. In order to assess the validity of our results, we have included Belgium as a control group, since Belgium and the Netherlands share the same language, culture and history and they have a similar smoking prevalence [18].
Methods Ethics statement In the Netherlands, medical research is governed by the Medical Research Involving Human Subjects Act (‘Wet Medisch-wetenschappelijk Onderzoek met mensen'), which is based on the principles of the declaration of Helsinki. This law only applies if study participants are subjected to any action, treatment or behaviour. Written confirmation from the Medical Ethics Review Committee of the Academic Medical Center that the Medical Research Involving Human Subjects Act was obtained stating that this law does not apply to this study and therefore no official approval was required.
Data Internet search query data collected from Google Trends have previously been used to predict influenza epidemics [19], unemployment rates [20] and seasonal depression [21]. Google Trends search query data has recently been used to analyse behavioural patterns like consumer interest in non-cigarette tobacco products [22], the use of electronic cigarettes [23,24] and the relation between tax avoidance and a cigarette tax increase [25,26]. This previously conducted research [19–26] shows Google Trends to be a useful tool to analyse behavioural patterns which are difficult to measure otherwise. Google Trends data is publicly available and can be downloaded directly from http://www. google.com/trends. Google Trends data are scaled to the average search traffic (the number of searches conducted at a certain point of time) for a selected point in time. The outcome variable, relative search volume (RSV) measures the total number of searches conducted for the selected query compared with the total number of Google searches executed at that point in time. The time period with the highest relative amount of search queries of the chosen term is assigned a value of 100. Other time periods obtain a score relative to 100 [27]. Because of the indexing used, Google Trends has the possibility to compare search queries with other search queries, between geographic regions and within broader periods of time [27,28]. We used Google Adwords (google.com/adwords), to collect the average monthly search volume for various smoking cessation related search queries [26]. Because the Dutch equivalent to ‘quit smoking’ (‘stoppen met roken’) was by far the most used search query (93% for the Netherlands and 90% for Belgium), compared to alternatives like ‘how do I quit smoking’, ‘help quit smoking’ and ‘smoking withdrawal symptoms’, this term was used as outcome in the analysis.
Analytical design This study was conducted using a quasi-experimental design to examine trends in search queries around interventions. Interrupted time series analysis allows the comparison of outcome
PLOS ONE | DOI:10.1371/journal.pone.0148489 February 5, 2016
3 / 16
Information Seeking for Smoking Cessation: A Google Trends Study
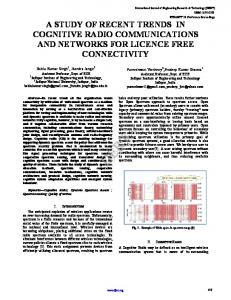
measures before and after the implementation of an intervention [29,30]. Therefore, this method can be used to analyse the effects of the introduction of new tobacco control policies by using RSV data. Time series analyses have been previously used to measure the impact of tobacco control policies on smoking prevalence in Australia [31]. RSV data were made available by Google Trends from 2004 onwards. Dutch RSV data for the query ‘quit smoking’ (‘stoppen met roken’) were retrieved for the 2004 to 2013 period on a weekly scale. Based on the availability of Google Trends data, three Dutch smoking cessation interventions could be included: the smoking ban of 2008, the reimbursement of SCS in 2011 and the reintroduction of the reimbursement of 2013 (Table 1). In January 2004, a national smoke-free legislation at the workplace was implemented. Since no pre-intervention data were available, the effect of this legislation could not be analysed. Therefore, January 2004 was excluded from the analysis. In total, data from 517 weekly time points were retrieved, with the highest RSV observed in the middle of 2008 (Fig 1). Sensitivity analysis showed that our results were robust with exclusion of the first 6 months of 2004 (instead of January only). We added the Dutch speaking part of Belgium as the control group, since Belgium is the country that is most comparable to the Netherlands in terms of geography, language, history and culture. Moreover, Belgium and the Netherlands have a similar smoking prevalence [18]. We used the same Dutch term on ‘quit smoking’ to obtain Belgian RSV data. The Belgian RSV ‘quit smoking’ data comprised a large number of missing data points until mid-2006. Therefore the period of January 2004 to August 2006 was excluded from the Belgian analysis. In total, data from 387 weekly time points were retrieved, with the highest RSV observed in the beginning of 2007 (Fig 2).
Statistical analysis To correct for seasonality, a seasonal decomposition in SPSS (version 21) was performed and the seasonally adjusted series were used for the analyses [32]. This enabled us to adjust for the peak in search queries around, among others, the first day of January when people make New Year’s resolutions to quit smoking. The seasonal adjusted series were log transformed in order to stabilize variance over time [33]. An interrupted time series analysis was performed on the adjusted data [29,30]. Autoregressive integrated moving average (ARIMA) modelling was used to account for dependency between data points in time series. ARIMA modelling is able to account for non-independence between the data points in the time series, which would otherwise cause standard errors to be estimated incorrectly. When using ARIMA modelling, the length between measured time periods should be constant. Furthermore, a substantial amount of data points is necessary. Time Table 1. Tobacco control policies implemented in the Netherlands and Belgium in the period 2004– 2013. Starting date
Country
Tobacco control policy
01-01-2005
Netherlands
Smoking ban hospitals and nursing homes
01-01-2007
Belgium
Smoking ban restaurants (small establishments excluded)
07-01-2007
Belgium
Smoking ban diners at public places (shopping malls, sports centers)
07-01-2008
Netherlands
Smoking ban bars and restaurants
01-01-2010
Belgium
Smoking ban food services places (small establishments excluded)
01-01-2011
Netherlands
Reimbursement SCS costs (duration 1 year)
30-06-2011
Belgium
Smoking ban all restaurants and snack points
01-01-2013
Netherlands
Restart Reimbursement SCS costs
doi:10.1371/journal.pone.0148489.t001
PLOS ONE | DOI:10.1371/journal.pone.0148489 February 5, 2016
4 / 16
Information Seeking for Smoking Cessation: A Google Trends Study
Fig 1. Google Trends RSV data of ‘quit smoking’ for the Netherlands. Dutch RSV (A), Dutch seasonally adjusted RSV (B) and as ARIMA (1,0,1) model (C). doi:10.1371/journal.pone.0148489.g001
PLOS ONE | DOI:10.1371/journal.pone.0148489 February 5, 2016
5 / 16
Information Seeking for Smoking Cessation: A Google Trends Study
Fig 2. Google Trends RSV data of ‘quit smoking’ for Belgium. Belgian RSV (A), Belgian RSV seasonally adjusted (B) and as ARIMA (1,0,2) Model (C). doi:10.1371/journal.pone.0148489.g002
PLOS ONE | DOI:10.1371/journal.pone.0148489 February 5, 2016
6 / 16
Information Seeking for Smoking Cessation: A Google Trends Study
series analysis using ARIMA modelling is accomplished in three phases: identification, estimation and diagnosis. In the identification phase ACF (autocorrelation function) and PACF (partial autocorrelation function) plots were examined to see which patterns are present in the data. The ACF plot is a bar chart of the coefficients of correlation between a time series and lags of itself. The PACF plot is a bar chart of the correlation coefficients between the series and lags of itself that are not explained by correlation at all lower order lags. Based on the visual inspection of the ACF and PACF, initial autoregressive (AR) and moving average (MA) terms were determined as a tentative model. In the estimation phase the tentative model was fitted to the seasonally adjusted RSV series to determine the fit of the model. Extra AR and MA terms were added to make sure no terms were left out of the model. In the diagnosis phase the best fitting model was determined based on residual ACF and PACF and the final model was used for further analyses [33,34]. The models were used to estimate the association with various tobacco control policies implemented in the Netherlands and Belgium (Table 1). Based on findings in literature, effects were estimated to be relatively short lived, with an increase in search queries before and shortly after the implementation of the legislation and a decrease in search queries a few weeks or months [15–17] afterwards. To assess the timing and duration of the effect of the tobacco control policies, twelve intervention effect periods were distinguished, ranging in duration from sixteen weeks up to one week before the intervention and one week up to 52 weeks afterwards. This method was chosen to minimize the amount of effect periods, in order to avoid the risks of multiple testing. Moreover, a similar approach is used in an article by Szatkowski et al. [15]. For each of the tobacco control policies, the respective periods were modeled as binary intervention dummies coded ‘1’ for the duration of the intervention period and coded ‘0’ for the period before and after that period of intervention. To clarify, for the effect period of one week after the intervention, this specific intervention variable was only coded as ‘1’ for the first week after the intervention. All other weeks were coded as ‘0’. Similarly, for the effect period of 5 to 8 weeks after the intervention, a variable was added in which week 5, 6, 7 and 8 were coded as ‘1’ and all other weeks were coded as ‘0’. The dummies for the different periods were added simultaneously to the final model to estimate the intervention effects according to each period [35]. Output was measured in percentage points relative to the expected level without the influence of the tobacco control policies. This process was repeated for each of the Dutch tobacco control policies. The Belgian ARIMA analysis was used as a control. The same regression model was applied to the Belgian model to study whether the changes observed around the Dutch interventions would be restricted to the Netherlands or not. Dummy variables related to Belgian policies (Table 1) were also added to the Belgian model to control for the effect of these Belgian interventions. Effect sizes and confidence intervals were estimated and a p-value smaller than 0.05 was considered to imply statistical significance. All analyses were performed using SPSS 21.
Results The appropriate ARIMA model of Dutch data was determined as a mixed autoregressive moving average model with one autoregressive lag and one moving average lag (ARIMA (1,0,1)) (Fig 1) and the Belgian model was determined as a mixed autoregressive moving average model with one autoregressive lag and two moving average lags (ARIMA (1,0,2)) model (Fig 2). Four Belgian tobacco control policies were added to the Belgian ARIMA model to measure the effects of Belgian tobacco control policies on smoking cessation-related behaviour (Table 2). The effects of the Belgian tobacco control policies were relatively weak. The smoking ban for diners in public places of July 2007 and the smoking ban in most food services places of
PLOS ONE | DOI:10.1371/journal.pone.0148489 February 5, 2016
7 / 16
Information Seeking for Smoking Cessation: A Google Trends Study
Table 2. ARIMA modelling outcomes for Belgian smoking cessation policies of Belgian RSV data. Period
Estimated ratio of change in RSV
95% CI
9–16
1.07
(0.95–1.20)
5–8
0.99
(0.85–1.16)
Smoking ban restaurants 2007 (small establishments excluded) Weeks before intervention
Weeks after intervention
3–4
1.00
(0.84–1.21)
2
1.14
(0.92–1.40)
1
0.93
(0.75–1.15)
1
1.11
(0.89–1.37)
2
1.42*
(1.14–1.75)
3–4
1.11
(0.92–1.35)
5–8
1.05
(0.88–1.25)
9–16
1.05
(0.89–1.24)
17–32
1.01
(0.87–1.17)
33–52
0.98
(0.88–1.10)
9–16
1.02
(0.89–1.15)
5–8
1.05
(0.90–1.22)
3–4
1.00
(0.83–1.20)
2
1.00
(0.81–1.24)
1
1.07
(0.86–1.33)
Smoking ban diners at public places 2007 Weeks before intervention
Weeks after intervention
1
1.03
(0.83–1.27)
2
1.09
(0.88–1.35)
3–4
0.97
(0.80–1.18)
5–8
1.04
(0.87–1.24)
9–16
0.97
(0.83–1.14)
17–32
0.93
(0.81–1.08)
33–52
0.99
(0.88–1.11)
9–16
0.95
(0.85–1.07)
5–8
1.00
(0.86–1.17)
3–4
1.02
(0.85–1.23)
2
1.07
(0.86–1.31)
1
1.04
(0.84–1.29)
1
0.99
(0.80–1.23)
2
1.04
(0.84–1.29)
3–4
0.96
(0.79–1.17)
5–8
1.02
(0.85–1.21)
9–16
1.00
(0.85–1.17)
17–32
1.01
(0.87–1.17)
33–52
0.96
(0.86–1.08)
9–16
0.90
(0.80–1.01)
5–8
0.95
(0.81–1.10)
3–4
1.01
(0.84–1.22)
2
0.94
(0.73–1.15)
1
0.97
(0.76–1.16)
1
0.89
(0.72–1.10)
2
0.90
(0.73–1.12)
Smoking ban food services places (small establishments excluded) Weeks before intervention
Weeks after intervention
Smoking ban all restaurants and snack points Weeks before intervention
Weeks after intervention
(Continued)
PLOS ONE | DOI:10.1371/journal.pone.0148489 February 5, 2016
8 / 16
Information Seeking for Smoking Cessation: A Google Trends Study
Table 2. (Continued) Period
Estimated ratio of change in RSV
95% CI
3–4
1.14
(0.94–1.38)
5–8
1.00
(0.84–1.19)
9–16
0.95
(0.81–1.11)
17–32
0.96
(0.84–1.11)
33–52
0.99
(0.88–1.11)
CI: confidence interval * Significant at P