Interactive Interface for Exploratory Functional Connectivity Analysis of fMRI Data, 2011,. Proceedings from IEEE International Conference on Image Processing ...
A GPU Accelerated Interactive Interface for Exploratory Functional Connectivity Analysis of fMRI Data
Anders Eklund, Ola Friman, Mats Andersson and Hans Knutsson
Linköping University Post Print
N.B.: When citing this work, cite the original article.
©2011 IEEE. Personal use of this material is permitted. However, permission to reprint/republish this material for advertising or promotional purposes or for creating new collective works for resale or redistribution to servers or lists, or to reuse any copyrighted component of this work in other works must be obtained from the IEEE. Anders Eklund, Ola Friman, Mats Andersson and Hans Knutsson, A GPU Accelerated Interactive Interface for Exploratory Functional Connectivity Analysis of fMRI Data, 2011, Proceedings from IEEE International Conference on Image Processing (ICIP), Brussels. Belgium, 1621-1624. Postprint available at: Linköping University Electronic Press http://urn.kb.se/resolve?urn=urn:nbn:se:liu:diva-71137
A GPU ACCELERATED INTERACTIVE INTERFACE FOR EXPLORATORY FUNCTIONAL CONNECTIVITY ANALYSIS OF FMRI DATA Anders Eklund12 , Ola Friman3 , Mats Andersson12 , Hans Knutsson12 1
Division of Medical Informatics, Department of Biomedical Engineering, Link¨oping University, Sweden 2 Center for Medical Image Science and Visualization (CMIV), Link¨oping University, Sweden 3 Fraunhofer Mevis, Bremen, Germany ABSTRACT
Functional connectivity analysis is a way to investigate how different parts of the brain are connected and interact. A common measure of connectivity is the temporal correlation between a reference voxel time series and all the other time series in a functional MRI data set. An fMRI data set generally contains more than 20,000 within-brain voxels, making a complete correlation analysis between all possible combinations of voxels heavy to compute, store, visualize and explore. In this paper, a GPU-accelerated interactive tool for investigating functional connectivity in fMRI data is presented. A reference voxel can be moved by the user and the correlations to all other voxels are calculated in real-time using the graphics processing unit (GPU). The resulting correlation map is updated in real-time and visualized as a 3D volume rendering together with a high resolution anatomical volume. This tool greatly facilitates the search for interesting connectivity patterns in the brain. Index Terms— fMRI, functional connectivity, GPU, OpenCL, MeVisLab 1. INTRODUCTION There are several ways to define and measure brain connectivity, the most common being anatomical (or structural) connectivity, functional connectivity and effective connectivity. Anatomical connectivity can for example be studied with diffusion tensor imaging (DTI) and fiber tracking techniques [1]. Functional connectivity relies on statistical measures such as correlation between temporal activities in different parts of the brain [2]. Effective connectivity tries to model the information flow in the brain, for example by dynamic casual modeling (DCM) [3]. The goal of a connectivity analysis is mainly to achieve a better understanding of how the brain works. This work focuses on functional connectivity analysis of fMRI data, measured as the temporal correlation coefficient between a reference voxel time series and all the other voxel time series [2]. As an fMRI data set generally contains at least 20,000 brain voxels, the correlations between all voxels need to be expressed as a correlation matrix with
a size larger than 20,000×20,000. Moreover, considering that a functional connectivity may exist but with a temporal delay, it is also interesting to calculate the correlation matrix for a number of time lags. If 50 sub-sample time lags are used, the resulting correlation matrix would be of size 20,000×20,000×50, requiring about 80 GB of storage in single precision. Clearly, there are computational, storage, exploration and visualization problems associated with such amounts of data. Instead of focusing on data mining, data reduction and complex visualization methods, we here suggest an interactive exploration approach which analyzes and visualizes a small part of the data at the time. An interface is built, in which the reference voxel can be moved around by the user and the correlations to all other time series are calculated in real-time using the graphics processing unit (GPU). The resulting correlation map is presented in a 3D volume rendering visualization that is updated in real-time. Gembris et al. [4] have previously described how to speedup a correlation analysis of fMRI data by using the GPU. In this paper we focus on a complete interactive interface with both real-time calculations and a 3D visualization. Two main technical problems arise when creating such an interface. First, the correlation map has to be updated in real-time when the user moves the reference voxel. This means that 20,000 correlations coefficients must be calculated for every time lag in a fraction of a second. We here define real-time such that all the calculations can be done at 5-10 Hz, such that the user can move the reference voxel without any delay. Second, the resulting correlation map must be connected to a 3D visualization and not only to a slice by slice visualization to get a better overview of the correlation and connectivity pattern.
2. METHODS The connectivity analysis was implemented in the MeVisLab software environment (http://www.mevislab.de/) [5], in which a pipeline with the necessary analysis, interaction and visualization components can be created. The 3D visualization part of the exploration interface consists of four volume renderers, one for the skin, two for the brain and one for the
functional connectivity map. Different transfer functions and clip planes can be set for each volume renderer. Code and implementations are available on request. 2.1. Pre-processing
3. RESULTS
The fMRI image volumes were pre-processed as follows: First, a motion correction [6] was applied to minimize effects from head movement during the experiment that may otherwise be interpreted as functional connections. Next, linear trends were removed from each voxel time series. Finally, a slight Gaussian 3D smoothing with a σ of 0.8 voxels was applied. A skull stripping algorithm, related to the method presented in [7], based on a fuzzy connectedness approach was used to segment skull and brain in the high resolution anatomical images. 2.2. Functional connectivity analysis The functional connectivity between two voxels is here defined as the temporal correlation ρ between their activity signals x(t) and y(t). The correlation is computed for a number of time lags, negative and positive, as x(t) and y(t) may be functionally connected with a temporal shift τ : 1 ρ(τ ) = N −1
implemented in hardware, as this operation is frequently used in graphics applications. This provides an additional speed-up for the current functional connectivity application.
PN
t=1 (x(t
− τ) − x ¯)(y(t) − y¯) σx σy
(1)
where N is length of the time series, x ¯, y¯ are the means and σx , σy are the standard deviations of the time series respectively. The correlation is computed for 1,000 different subsample time lags and the highest correlation is chosen to represent the connectivity. The voxels are declared as connected if the correlation is above a threshold which here is set to 0.6. Statistically motivated thresholds can be found with further analysis of the data [8], but this was not the goal of the current work. By repeating the correlation computation for a fixed reference voxel x(t) and all other voxels in the brain, the functional connectivity map is obtained. 2.3. OpenCL implementation To achieve the real-time computational speed required for the interactive functional connectivity exploration, the connectivity analysis was implemented in the Open Computing Language (OpenCL). Code written in OpenCL can be executed on any hardware, such as CPUs and GPUs, and it is vendor independent. The mean and variance of each time series in a data set is needed when the correlations are calculated, and these are therefore precalculated when a new fMRI data set is loaded and is stored in the GPU memory. Each new reference time series is copied to the texture memory to enable fast subsample linear interpolation in time, which is required to shift one time series and calculate the correlation for different time lags. An advantage of the GPU is that linear interpolation is
The developed interface was evaluated using fMRI data from a 50-year old healthy male. To explore the network governing motor activity, the subject was asked to perform different motor activities such as tapping with the fingers of the left and right hand. A 1.5 T Philips Achieva MRI scanner was used for the image acquisition. The sequence parameters were: TR=2 s, TE=40 ms, FOV=240 mm, spatial resolution of 3.75 × 3.75 × 3.75 mm3 , matrix size 64×64×22 voxels. A total of N=79 volumes were collected. For visualization, a high resolution 3D T1 -weighted volume with an isotropic voxel size of 1 mm was also acquired. An Nvidia GTX 275 GPU with 1.8 GB of memory were used with the OpenCL implementation to calculate functional connectivity and to create visualizations. Furthermore, the performance was compared to a standard C implementation on a Intel Core 2 Duo 3.0 GHz CPU with 8 GB of memory. The resulting processing times, as function of the number of time lags, is given in Table 1. The calculations were only performed for the brain voxels, a simple thresholding technique was used to classify the voxels as inside our outside the brain. The reason why the processing time does not scale linearly for the GPU implementation is that it takes some time to upload the selected reference time series to the texture memory on the GPU. Table 1. Processing times, as function of the number of time lags, for the CPU and the GPU implementation. The size of the dataset is 79 volumes with the resolution 64 x 64 x 22 voxels, 20 000 voxels were classified as brain voxels. Number of time lags 1 10 50 100 500 1000
CPU 68 ms 644 ms 2.9 s 5.8 s 28.8 s 58 s
GPU 1.07 ms 3.3 ms 12.1 ms 22.8 ms 110.1 ms 221.3 ms
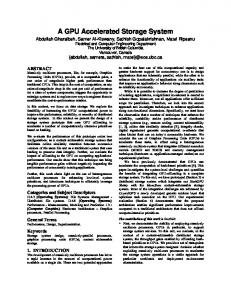
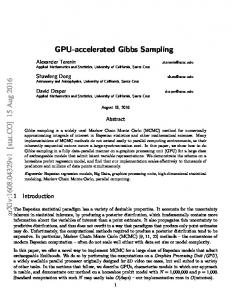
The MeVisLab network that was created for the interface is showed in Figure 1. The resulting GUI is shown in Figure 2. The user selects the reference voxel by moving the yellow square. When the reference voxel is changed, the time series for that voxel is uploaded to the texture memory on the GPU and the correlations for all the voxels and time lags are calculated. The voxels that have a higher correlation than 0.6 are shown in the 3D visualiza-
Fig. 1. The nodes in MeVisLab that are used to run the interface. The right nodes take care of loading the preprocessed fMRI data, applies Gaussian smoothing, lets the user move the yellow square in the fMRI data and sends the current voxel position to the OpenCL node that calculates all the correlations. The left nodes use the resulting correlation map and shows it in a 3D visualization. The visualization pipeline consists of four volume renderers (marked VR), one for the skin, two for the brain and one for the activity. For each volume renderer we can set separate transfer functions and clip planes. tion. A video of the interface in action can be found at http://www.youtube.com/watch?v=dLB2I5OgkXg 4. DISCUSSION We have presented an interactive interface for functional connectivity analysis of fMRI data. By using the GPU we can calculate a large number of correlations in real-time and thereby let the user move the reference voxel and directly see the resulting connectivity map in a 3D visualization. As can be seen in Table 1, the GPU makes it possible to calculate the correlation map for about 1000 time lags in real-time (5 Hz), while about 3 time lags can be handled in real-time if the CPU is used. The mean speedup by using the GPU is about 250, but it should be stressed here that the CPU code was only executed on one of the two processor cores. It shows, however, that it is straightforward to obtain a significant speedup by using the GPU. While the statistical approach used in our interface is rather simple, the interface is an example of the new possibilities to interactively perform image processing and statistical analysis for exploration purposes. In future work we plan to use more advanced statistical connectivity measures, such as canonical correlation analysis (CCA) [9], as an alternative to ordinary correlation analysis. With CCA we get a spatial adaptivity by considering neighborhoods instead of single voxels. The use of CCA to achieve spatial adaptivity has
previously been used for conventional fMRI analysis [10]. Future work also includes extending the interface from single subject analysis to multi subject analysis. A problem with connectivity analysis is to determine if a certain correlation is significant or not. Worsley et al. [8] used a random field theory approach while Cordes et al. [11] used a non-parametric method to get a statistically motivated threshold. While non-parametric methods have several advantages over parametric approaches, for example that they work for any test statistics and with very few assumptions about the data, their common problem is that they are computationally very intensive. The main idea with a random permutation test is to generate and analyze data that is similar to the data we have, in order to estimate the null distribution of the test statistic. We are currently working on doing random permutation tests of single subject fMRI data on the GPU and initial results show speedups that make non-parametric testing possible for routine use.
Acknowledgement This work was supported by the Linnaeus center CADICS, funded by the Swedish research council. The authors would like to thank the Novamedtech project at Link¨oping university for financial support of our GPU hardware and Johan Wiklund for support with the CUDA installations.
Fig. 2. The interface in MeVisLab for interactive connectivity analysis of fMRI data. 1. The user selects the reference voxel time series by moving the yellow square. 2. When the user changes the reference voxel, the GPU calculates the correlation between the reference voxel time series and all other time series for all time lags, the correlation for the best timelag is saved. The voxels that have a higher correlation than 0.6 are showed in red. 3. The connectivity map is visualized in 3D to give the user a better overview of how the brain is connected. In this case we put the reference voxel in the supplementary motor area (SMA) and see that the left and the right motor cortex are correlated to it. 5. REFERENCES [1] P. Hagmann, J.P. Thiran, L. Jonasson, P. Vandergheynst, S. Clarke, P. Maeder, and R. Meuli, “DTI mapping of human brain connectivity: statistical fibre tracking and virtual dissection,” NeuroImage, vol. 19, pp. 545–554, 2003. [2] B. Biswal, F.Z. Yetkin, V.M. Haughton, and J.S. Hyde, “Functional connectivity in the motor cortex of resting state human brain using echo-planar MRI,” Magnetic Resonance in Medicine, vol. 34, pp. 537–541, 1995.
ternational Conference on Acoustics, Speech and Signal Processing (ICASSP), 2010, 2010, pp. 658–661. [7] H. K. Hahn and H.-O. Peitgen, “The skull stripping problem in MRI solved by a single 3D watershed transform,” in In Proceedings of the Third International Conference on Medical Image Computing and ComputerAssisted Intervention (MICCAI), 2000, pp. 134–143. [8] K.J. Worsley, J. Cao, T. Paus, M. Petrides, and A. Evans, “Applications of random field theory to functional connectivity,” Human Brain Mapping, vol. 6, pp. 364–367, 1998.
[3] K.J. Friston, L. Harrison, and W. Penny, “Dynamic causal modelling,” NeuroImage, vol. 19, pp. 1273– 1302, 2003.
[9] H. Hotelling, “Relation between two sets of variates,” Biometrika, vol. 28, pp. 322–377, 1936.
[4] D. Gembris, M. Neeb, M. Gipp, A. Kugel, and R. M¨anner, “Correlation analysis on GPU systems using NVIDIA’s CUDA,” Journal of real-time image processing, pp. 1–6, 2010.
[10] O. Friman, J. Carlsson, P. Lundberg, M. Borga, and H. Knutsson, “Detection of neural activity in functional MRI using canonical correlation analysis,” Magnetic Resonance in Medicine, vol. 45, no. 2, pp. 323–330, 2001.
[5] F. Heckel, M. Schwier, and H-O Peitgen, “Object oriented application development with MeVisLab and Python,” Lecture Notes in Informatics (Informatik 2009: Im Focus das Leben), vol. 154, pp. 1338–1351, 2009. [6] A. Eklund, M. Andersson, and H. Knutsson, “Phase based volume registration using CUDA,” in IEEE In-
[11] D. Cordes, V.M. Haughton, K. Arfanakis, G.J. Wendt, P.A. Turski, C.H. Moritz, M.A. Quigley, and M.E. Meyerand, “Mapping functionally related regions of brain with functional connectivity MR imaging,” American Journal of Neuroradiology, vol. 21, pp. 1636–1644, 2000.