FEBRUARY 2002
133
PATOUX AND BROWN
A Gradient Wind Correction for Surface Pressure Fields Retrieved from Scatterometer Winds JE´ROˆME PATOUX
AND
ROBERT A. BROWN
Department of Atmospheric Sciences, University of Washington, Seattle, Washington (Manuscript received 31 May 2001, in final form 31 August 2001) ABSTRACT Given a field of geostrophic winds and at least one pressure observation, a pressure field can be computed. If the winds are in reality gradient winds, then a correction must be applied to calculate the actual geostrophic winds. Here a method is proposed for including a gradient wind correction in the retrieval of geostrophic winds from Quick Scatterometer (QuikSCAT) surface measurements with a planetary boundary layer model. This correction translates into a better estimate of the corresponding surface pressure fields. The scheme is assessed by comparing these pressure fields to buoy measurements in the Gulf of Alaska and to radiosonde measurements in Hurricane Floyd. The gradient wind correction has a curvature component and a time-dependent component. Their relative magnitude is evaluated.
1. Introduction To solve for the atmospheric flow in the regions above the planetary boundary layer (PBL), the equations of motion are very often simplified to a balance between the pressure gradient force and the Coriolis acceleration in the extratropical regions. This geostrophic approximation is used extensively, in particular to compute wind vectors from pressure fields. However, the geostrophic approximation does not necessarily hold in regions of the flow where the trajectories are strongly curved. The centrifugal acceleration can become of the same order of magnitude as the pressure gradient force and the Coriolis acceleration, and a three-force balance must be solved to calculate the actual wind vector, referred to as the gradient wind. This is a subject in many textbooks (e.g., Holton 1992) and is used daily by synopticians when analyzing weather maps. The gradient wind is subgeostrophic in regions of strong cyclonic curvature and supergeostrophic in regions of strong anticyclonic curvature. Here we are interested in the reverse problem. The University of Washington Planetary Boundary Layer (UWPBL) model is used to compute geostrophic wind vectors from a field of surface wind measurements. A pressure field is then fit to those geostrophic winds by least squares minimization, assuming geostrophic balance at each point of the wind field (Brown and Levy 1986; Levy and Brown 1991; Patoux and Brown 2001; Corresponding author address: Dr. Je´roˆme Patoux, Department of Atmospheric Sciences, University of Washington, 408 ATG Building, Box 351640, 2909 25th Avenue NE, Seattle, WA 98195-1640. E-mail:
[email protected]
q 2002 American Meteorological Society
Patoux 2000). It can be assumed that the retrieved winds are the gradient wind vectors. Therefore, before fitting the pressure surface, we need to obtain the actual geostrophic wind vectors. If we do not, we underestimate the pressure gradient in regions of strong cyclonic curvature and overestimate the pressure gradient in regions of strong anticyclonic curvature. The methodology will be presented in section 2. The Quick Scatterometer (QuikSCAT) data, buoy measurements, and radiosonde measurements used to assess the proposed scheme will be described in section 3. Some comparisons between corrected surface pressure fields obtained from QuikSCAT measurements using the UWPBL model and buoy or radiosonde measurements will be presented in section 4. The time-dependent part of the gradient wind correction will be evaluated in section 5. 2. Methodology Following Holton (1992), we can write the equations of motion in natural coordinates and simplify the balance of forces normal to the direction of the flow as V2 1 f V 2 f Vg 5 0, R
(1)
where V is the actual wind (in this case, the gradient wind), V g is the geostrophic wind, f is the Coriolis parameter and R is the radius of curvature. By convention, R is positive for cyclonic curvature and negative for anticyclonic curvature. The first term in Eq. (1) corresponds to the centrifugal acceleration, the second term to the Coriolis acceleration and the last term to the pres-
134
JOURNAL OF APPLIED METEOROLOGY
VOLUME 41
If we assume that the flow is parallel to the pressure contours, then we can write,
u 5 tan21
yg
1u 2 5 tan 12 p 2, 21
g
px
(4)
y
and using the following relations: ]u ]u ]u 5 cosu 1 sinu , ]s ]x ]y cosu 5 (1 1 u 2 )21/2 ,
and
(5)
sinu 5 u/(1 1 u 2 )21/2 ,
u 5 2px /py ,
(6)
Eq. (3) can be written, 1 1 px pyt 2 pxt py pxx py2 2 2px pxy py 1 px2 pyy 5 1 . R V px2 1 py2 ( px2 1 py2 ) 3/2
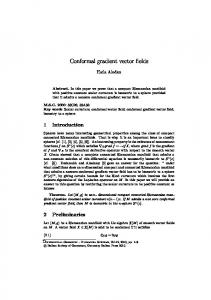
FIG. 1. The three-force balance in regions of curved flow (PGF is the pressure gradient force, COR is the Coriolis acceleration, CENTR is the centrifugal acceleration).
sure gradient force =p/r, where p is the air pressure and r is the air density (see Fig. 1). In the degenerated case where R → ` (i.e., straight flow), Eq. (1) reduces to the geostrophic approximation. From (1), we can write:
1
2
=p V 5 f Vg 5 f V 1 1 . r fR
(2)
We will refer to the term in parentheses as the gradient wind correction. If we know the gradient wind V and if we can determine the radius of curvature R, then we can better estimate the actual pressure gradient. Following Endlich (1961), we write, 1 du 1 ]u ]u 5 ø 1 , R ds V ]t ]s
(3)
where u is the wind direction counted positively in the cyclonic direction (Northern Hemisphere) and s is the distance along the flow (see Fig. 1). The first term on the right corresponds to the local rate of change in wind direction and will be evaluated in section 5. The second term corresponds to the curvature of the trajectories. Since it is very complicated if not impossible to determine the actual trajectories of the air parcels from measurements, the streamlines are usually substituted for the trajectories. This is known to induce a significant bias (Holton 1992), especially in low pressure centers and in the vicinity of fronts, where strong vertical motions are present. However, using the curvature of the streamlines seems to be a realistic alternative to the trajectories in many cases, as will be illustrated in section 4.
(7)
The first term (time dependent) can be evaluated by finite differencing from three successive gridded pressure fields. The computation is intensive and examples will be provided in section 5. The second term can be evaluated from a single-gridded pressure field. Its implementation in the UWPBL model is relatively simple and will now be described. At each point of a grid where the surface wind vector, air temperature, sea surface temperature, and relative humidity are known, the corresponding wind vector at the top of the boundary layer can be computed (Brown and Levy 1986; Levy and Brown 1991). At each point of the resulting two-dimensional wind field, geostrophic balance is assumed. The corresponding pressure field is calculated by least squares minimization (Brown and Levy 1986). At least one pressure measurement is used to set the absolute values of pressure. However, it is assumed that in regions of strong curvature of the flow, the centrifugal force affects the flow down to the bottom of the boundary layer. Therefore, the measured surface wind is really the surface signature of the gradient wind through the boundary layer. The wind vector calculated by the UWPBL model at the top of the boundary layer is a better estimation of the gradient wind than it is of the geostrophic wind. Consequently, we must solve the three-force balance described in Fig. 1 and Eq. (2) to obtain the correct pressure gradient. If we compute the pressure gradient at the top of the boundary layer based solely on a geostrophic balance (i.e., straight flow), we underestimate the pressure gradient in cyclonic flows and overestimate the pressure gradient in anticyclonic flows. The radius of curvature of the pressure contours is evaluated using the second term in the right-hand side of Eq. (7). The pressure gradients are computed by applying the correction from Eq. (2). A new pressure field is fit to the resulting field of vectors. By iteration, a final surface pressure field is obtained after convergence. This scheme works only if the radius of curvature of the pressure contours can be estimated properly by finite differences. It can be easily verified that this is the case
FEBRUARY 2002
PATOUX AND BROWN
for smooth pressure fields. We assessed the accuracy of the computation by creating an idealized low made of concentric isobars and by verifying that the computed radius of curvature was everywhere close to the radius of the circles (not shown here). The pressure fields obtained with the UWPBL model are generally not sufficiently smooth for directly calculating the curvature. Therefore, a 300-km low-pass filter (Patoux and Brown 2000) is applied prior to the calculation. 3. Data The ‘‘SeaWinds on QuikSCAT’’ L2B surface wind vectors were used, after discarding the vectors flagged for rain contamination (Jet Propulsion Laboratory rain flags). Values of surface temperature and humidity are obtained from the European Centre for Medium-Range Weather Forecasts (ECMWF). Surface wind vectors, temperature, and humidity are interpolated onto the same 50-km grid on which the UWPBL model is run. In section 4b, buoy measurements obtained from the National Data Buoy Center (NDBC) archives are compared with the UWPBL surface pressures. In section 4c, radiosonde measurements obtained from the Hurricane Research Division (HRD) archives are used for comparisons of Hurricane Floyd in September 1999. In the rest of the study, UWPBL surface pressure fields (50km resolution) are also compared with global pressure fields at synoptic times obtained from the ECMWF (1.1218 lat 3 1.1258 long grid). 4. Results a. The structure of highs and lows Since synopticians usually have pressure charts and seek to better estimate the winds, they are concerned mainly with the local effect of the gradient wind correction on each wind vector. However, since our goal is to better estimate the pressure gradients, a local change in the calculated geostrophic winds will affect the pressure field at large. This is typically the case in well-formed anticyclones and lows. Figure 2 illustrates the effect of the gradient wind correction on the retrieval of an anticyclonic structure (southern Pacific, 20 September, 1600 UTC). In Fig. 2a, the uncorrected UWPBL pressure field is compared with the synoptic ECMWF surface pressure field (dashed lines) closest in time (separated by 2 h). In Fig. 2b, the gradient wind correction has been included. The obtained pressure field is very similar to the uncorrected one, except for the center of the anticyclone, where the radius of curvature is smaller, and the effect of the correction bigger. The pressure gradients are weaker and the central area of the high is flatter, which seems in better agreement with ECMWF. Figures 2c and 2d show uncorrected and corrected surface pressure fields, respectively, in the case of a low (also in the Southern Hemisphere). Although the pres-
135
sure field seems mildly affected on the outskirts of the cyclone, the corrected pressure field conveys a different picture in the center. The low is deeper, and the pressure gradients are stronger, especially where the winds are strong and where the streamlines are curved the most. This can be appreciated on the western flank of the low. The whole structure of the pressure field is affected by the gradient wind correction: it is more asymmetric, as well as deeper. Note that the uncorrected low is shallower than indicated by ECMWF, but that the corrected low is deeper than indicated by ECMWF. A quantitative estimation of the impact of the correction will be given in the next section. Including the gradient wind correction produces flatter highs and deeper lows, which is in agreement with our knowledge of such systems: the pressure gradients approach zero in the center of anticyclones, with gentle winds, whereas pressure gradients and winds often reach their highest value in the center of cyclones (Holton 1992). b. Comparisons in the Gulf of Alaska In order to quantify the impact of the gradient wind correction, the obtained surface pressure fields were compared with NDBC buoy measurements. Since the impact is maximum for cutoff lows and circulations of small radius of curvature, we searched for QuikSCAT swaths covering mature cyclones reaching the Gulf of Alaska with a configuration such that the low center would be close to NDBC buoy No. 46001, and another of NDBC buoys, No. 46005, 46006, 46059, or 51001 would be under higher pressure. This ensured that we had a measurement of the pressure difference between two buoys that we could compare with the pressure difference obtained with the UWPBL model. An example of such a configuration is shown in Fig. 3 for an extratropical storm reaching the Gulf of Alaska on 20 September 1999. Figure 3a shows the uncorrected UWPBL pressure field (1430 UTC). Figure 3b shows the corrected pressure field. The NDBC buoy pressure measurements are indicated next to the location of the buoy (black triangle). The 1200 UTC ECMWF surface pressure field is plotted with dashed lines for comparison. Note how including the gradient wind correction enhances the low pressure center and the cold front extending south of it. The isobars are tightened around the low, whereas they are broadened around the high, in agreement with our previous discussion. The pressure difference between the two buoys was 23.3 mb. The pressure difference from the uncorrected UWPBL pressure field was 21.8 mb, or an error of 27%. It was 23.9 mb from the corrected pressure field, or an error of 13%. Figure 4 shows another such example on 14 November 1999, where the measured pressure difference was 17 mb, the uncorrected UWPBL pressure difference was 15.9 mb (27% error), and the corrected UWPBL pres-
136
JOURNAL OF APPLIED METEOROLOGY
VOLUME 41
FIG. 2. UWPBL surface pressure fields retrieved from QuikSCAT winds (solid lines) and ECMWF surface pressure field (dashed lines). The outline of the QuikSCAT swath is shown for reference (gray shade): (a) a high in the southern Pacific Ocean (1600 UTC 20 Sep 1999); (b) same, with the geometric gradient wind correction; (c) a low in the southern Atlantic Ocean (1900 UTC 20 Sep 1999); (d) same, with the geometric gradient wind correction.
sure difference was 17.7 mb (14% error). In this case, the pressure difference is milder and the effect of the gradient wind correction is distributed more evenly throughout the swath, with a barely deeper low. Note that the corrected UWPBL pressure field is in relatively good agreement with ECMWF. Figure 5 shows a third example on 22 September 1999, where the pressure is 955.2 mb at the center. The cyclone in its mature stage extends for thousands of miles in concentric circles that make it a good candidate for the calculation of the radius of curvature. The buoy-
measured pressure difference was then 72.3 mb. The uncorrected UWPBL pressure difference was 50.0 mb (220% error), whereas the corrected UWPBL pressure difference was 73.4 mb (12% error). We isolated 14 cases of cyclones in the described configuration with respect to the buoys throughout the September–December 1999 period. Table 1 summarizes the results. The measured, uncorrected UWPBL and corrected UWPBL pressure differences are indicated for each case, with corresponding errors as percentages. The ability to reproduce a measured pressure gradient
FEBRUARY 2002
PATOUX AND BROWN
137
FIG. 3. UWPBL surface pressure fields in the Gulf of Alaska on 1430 UTC 20 Sep 1999, (a) without the gradient wind correction, and (b) with the correction (dashed lines are the ECMWF surface pressure; black triangles are the NDBC buoy pressure measurements).
is only one way of testing the gradient wind correction scheme. As emphasized before, not only the pressure gradients, but also the structure of the pressure field is affected. Therefore, as an indicator, we also provide the mean square difference between the UWPBL pressure
fields and the ECMWF pressure fields at the closest synoptic time. We used italic characters for the cases where using the gradient wind correction did not improve the pressure difference estimation or the fit to ECMWF. In only 2 cases out of 14 did the correction
FIG. 4. Same as Fig. 3, but for 1500 UTC 14 Nov 1999.
138
JOURNAL OF APPLIED METEOROLOGY
VOLUME 41
FIG. 5. Same as Fig. 3, but for 1430 UTC 22 Sep 1999.
fail to improve both quantities (14 November, 5 December). In one case, the pressure difference estimate was worse (1 December). In another case, the fit to ECMWF was worse (5 November). In all other cases, both quantities were improved, sometimes significantly. Note that only the geometric component of the gradient wind correction is taken into account here. It is an improvement over the uncorrected model. c. Hurricane Floyd Retrieving surface pressure fields from scatterometer wind measurements in a hurricane is a very challenging
problem (Hsu and Liu 1996; Hsu et al. 1997). Yet it is one of the cases that a gradient wind calculation should address: a closed, quasi-circular circulation, with very small radii of curvature and extremely strong winds. Figure 6 shows five intersections of QuikSCAT swaths with Hurricane Floyd on 9–14 September 1999. Figures 6a–e show the pressure fields retrieved with the uncorrected UWPBL model. Figures 6a9–e9 show the corresponding corrected pressure fields. Even at first glance, the corrected pressure fields appear much deeper. HRD radiosonde measurements were used to assess the ability of the correction to reproduce more realistic pressure
TABLE 1. Comparison between NDBC-measured pressure differences (column 2) and the uncorrected (column 3) and corrected (column 5) UWPBL differences. The errors (columns 4 and 6) are expressed as percentages of the measured values. Cases in which using the gradient wind correction did not improve the results are written in italics.
Date 20 22 12 17 21 5 7 13 14 14 27 1 3 5
Sep 1999 Sep 1999 Oct 1999 Oct 1999 Oct 1999 Nov 1999 Nov 1999 Nov 1999 Nov 1999 Nov 1999 Nov 1999 Dec 1999 Dec 1999 Dec 1999
Dp (without error correction)
Dp (with error correction)
Dp (NDBC buoys) (mb)
(mb)
(%)
(mb)
(%)
23.3 72.3 35.8 47.8 50.9 30.3 37.1 37.3 38.8 17.0 37.1 59.0 41.3 37.9
21.8 50.0 28.2 38.5 40.2 24.8 34.7 24.9 0.3 15.9 31.8 59.5 32.8 38.4
27 220 221 219 221 218 27 231 21 27 212 11 221 14
23.9 73.4 31.4 43.4 50.7 27.9 37.8 28.4 42.3 17.7 37.7 71.4 35.7 39.5
13 22 212 29 20.4 28 21 222 19 14 14 14 214 17
Std dev Std dev from ECMWF from ECMWF (without cor- (with correcrection) (mb) tion) (mb) 2.9 7.0 2.7 3.1 5.8 3.4 3.3 3.3 2.9 2.7 3.8 5.7 3.7 4.7
2.4 5.1 1.7 2.3 2.7 3.5 3.2 2.4 3.4 2.0 3.7 5.1 3.0 4.8
FEBRUARY 2002
PATOUX AND BROWN
139
FIG. 6. UWPBL surface pressure fields (4-mb contours) describing hurricane Floyd (a)–(e) without the gradient wind correction and (a9)– (e9) with the correction.
140
JOURNAL OF APPLIED METEOROLOGY
VOLUME 41
TABLE 2. Lowest pressures (mb) in Hurricane Floyd (values in italics were interpolated in time). Date and time 11 11 13 13 14
Sep Sep Sep Sep Sep
1999 1999 1999 1999 1999
A.M . P . M. A.M . P . M. A.M .
ECMWF
Radiosonde
UWPBL (without correction)
UWPBL (with correction)
1000.4 994.1 987.3 982.2 978.5
N/A 982.0 930.0 924.0 928.0
1003.7 1007.1 1000.4 998.0 993.7
997.7 999.0 980.0 973.9 957.4
fields in these extreme cases. However, rather than matching the UWPBL pressure fields to radiosonde observations, a different approach was chosen. The retrieved pressure fields were matched to the ECMWF fields (arbitrarily) outside of the hurricane. This provided an anchor, independent of the hurricane, and common to both the uncorrected and the corrected fields. Then it was possible to observe how deep a hurricane each model would reproduce, and to compare the lowest pressures to the radiosonde measurements. Although less accurate, this method provides a better insight into the magnitude of the effects induced by the correction. Note that here we are not proposing a method for modeling the actual dynamics inside the core of a hurricane, but rather a better approximation for the medium-scale pressure fields in which a hurricane is embedded. Table 2 summarizes the results. In each case, the lowest pressures are indicated for the ECMWF pressure fields at closest synoptic time, for the radiosonde measurements, for the uncorrected and corrected pressure fields. Note that those measurements are not necessarily collocated, but are just indicative of the depth of the system. The two pressure values in italics were interpolated linearly in time, since the radiosonde measurements were not performed continuously. Overall, ECMWF pressures are not representative of the lowest pressures encountered in the hurricane, being 50 mb or more over the measurements during the last days. The UWPBL model behaves even more poorly than ECMWF without the gradient wind correction, but reproduces deeper pressures with the correction that are more in agreement with the observations. Of course, the difference between the modeled and the measured pressures is still large, even with the correction. Additional dynamical considerations should be taken into account to obtain a realistic estimate of the low pressure in the core of the hurricane. Note that the UWPBL retrieval is hampered by the rain flagging of surface wind vectors, discarded from the calculation. There can be numerous such rain-flagged vectors in a hurricane. It is also affected by the absence of scatterometer winds in the vicinity of the islands. 5. The time-dependent correction In Eq. 7, we discarded the time-dependent term, retaining only the geometric part of the gradient wind correction (i.e., the curvature of the streamlines). It is,
in fact, common practice to discard the time-dependent term (Endlich 1961). It is possible to evaluate it with an advection vector representing the motion of the pattern of streamlines (Brown and Zeng 1994; Holton 1992). Since the return period and swath width of SeaWinds on QuikSCAT are such that an extratropical cyclone or hurricane will often be captured by several successive looks separated by 9–14 h, we looked for such cases where three successive pressure fields could be calculated with the UWPBL model. We then estimated the time-dependent part of the gradient wind correction with finite-differencing on Eq. 7. The modified radius of curvature is then used in Eq. 2 to calculate a modified pressure gradient at each point of the grid. A final pressure field is obtained by running the UWPBL model in the same way as in section 2. Figure 7 illustrates the results for the 20 September case described in section 4b (Fig. 3). The storm is moving due north and will decay after reaching the coast of Alaska. Figure 7a shows the ratio of the total gradient correction term (geometric 1 time-dependent) to the geometric part of the correction alone. In other words, if this ratio has a value of 1, then adding the timedependent correction did not change the estimation of the pressure gradient. If the ratio is greater (less) than 1, then the time-dependent correction acted to strengthen (weaken) the pressure gradient [like a more (less) curved flow would do]. In Fig. 7a, and remembering that the system is moving north, the gradient correction is increased to the left of the motion (by up to 7%) and decreased to the right of the motion (by up to 6%). This is in agreement with Holton (1992, p. 73), who idealized a moving circulation and computed the resulting trajectories of the air parcels. Figure 7b shows how the resulting pressure field is affected by the total gradient wind correction, as compared with the pressure field (Fig. 7c) obtained with the geometric part of the correction alone (same as Fig. 3b). The low is slightly deeper: the pressure difference between the two NDBC buoys is now 24.5 mb, instead of the 23.9 mb reported earlier. Note how the pressure field is mainly affected in the center in this case, with the surroundings of the low left unchanged. Figure 8 shows a similar calculation for the 14 November case described in section 4b (Fig. 4). Whereas the previous cyclone was still heading north, this storm is already decaying and the low is filling in at the same time as it is changing shape, extending southeastward
FEBRUARY 2002
PATOUX AND BROWN
141
FIG. 7. (a) Ratio of total gradient wind correction to geometric correction alone, (b) UWPBL surface pressure field with total correction, and (c) with geometric correction alone (same as Fig. 3) on 1430 UTC 20 Sep 1999.
in the next 12 h. This is a more complicated case that cannot be modeled easily with an advected pattern of streamlines. As can be seen on Fig. 8, including the time-dependent term affects the correction by up to 67% (the unshaded corner corresponds to an area where the intersection of the swaths would not allow the finite time-difference calculation). However, the resulting pressure field is virtually unchanged (Fig. 8b, shown for reference; same as Fig. 4b): 985.8-mb minimum pressure for the uncorrected field, 985.9 mb for the corrected field. Note that in a decaying low, the winds are usually weaker and the pressure gradients, corrected or not, are weaker to start with. The geometric gradient wind correction alone added only 1.8 mb to the modeled pressure difference between the NDBC buoy locations. Adding the time-dependent correction adds little more. However, it is instructive to see how differently the timedependent gradient wind correction will affect the pres-
sure field at two different stages of the development of a cyclone. Figure 9 shows another calculation for the 13 September (P.M.) section of Hurricane Floyd, described in section 4c (Fig. 6d). The hurricane is moving westward. The main difference in the calculation of the gradient wind correction from the first storm (Fig. 7) is the speed at which the hurricane is moving: since the pressure gradients are huge between the center and the outskirts of the hurricane, the local time derivative p xt and p yt in Eq. 7 take on large values. In other words, a point that is swept by the hurricane experiences large differences in pressure over a short period of time. Moreover, the wind speeds in the hurricane are quite large. The timedependent gradient wind correction thus acquires greater values in this case than it did in the case of extratropical storms. This can be appreciated in Fig. 9a, where it can be seen that including the time-dependent
FIG. 8. Same as Fig. 7, but for 1500 UTC 14 Nov 1999.
142
JOURNAL OF APPLIED METEOROLOGY
VOLUME 41
FIG. 9. Same as Fig. 7, but for Hurricane Floyd, 13 Sep 1999.
term can affect the gradient wind correction by 20% or more. The surface pressure field (Fig. 9b) resulting from this new calculation is not only shallower (989.3-mb minimum pressure), it is also shaped differently. Note, again, that the pressure retrieval is impaired by the presence of the Caribbean islands, where no scatterometer wind measurements are available. The goal of this nonexhaustive collection of cases is not to determine precisely the effect of the time-dependent gradient wind correction but rather to provide an intuition for the typical cases in which its omission will induce the largest errors, as well as an order of magnitude for these errors. A finite-difference calculation based on successive swaths separated by 9–14 h leads to an error of up to 7% in the case of mature extratropical storms, and 20% or more in the case of hurricanes. It can be expected that a calculation based on successive pressure fields separated by only 1 or 2 h would produce even larger numbers. These errors will not only induce deeper or shallower pressure fields; they will also affect the shape of these fields, especially for fast-moving, intense systems. As a rule of thumb, if we omit the time-dependent correction, we underestimate the correction to the left of the direction of motion of the system, and overestimate the correction to the right of the direction of motion. When the system starts to decay, to fill in and to change shape, the effects of the time-dependent correction are more difficult to predict. Although it is an interesting academic exercise, the calculation of the time-dependent gradient wind correction remains a complicated operational task. However, with the possible advent of multiple scatterometers, a good recurrent coverage of the ocean will make this task easier to accomplish. 6. Concluding remarks A method was described for evaluating the gradient wind correction to the pressure gradients calculated
from scatterometer surface winds with the UWPBL model in order to better reproduce the corresponding pressure fields. Two terms were considered: a geometric gradient wind correction that takes into account the radius of curvature of the isobars; and a time-dependent gradient wind correction that takes into account the local change in direction of the isobars. The geometric correction alone produces flatter anticyclones and deeper cyclones in agreement with the knowledge gained from synoptic observations. It is tested against NDBC buoy measurements in the Gulf of Alaska, in the case of 14 mature cyclones; in most cases, the agreement between the UWPBL surface pressure fields and the buoy measurements is improved when including the geometric gradient wind correction. The standard deviation from the ECMWF synoptic pressure field closest in time is also improved. The correction is also assessed by comparing the lowest pressure it can produce in the center of Hurricane Floyd with the lowest pressure measured by the HRD radiosondes. Although still higher than the measurements, the lowest pressures in the corrected fields are an improvement. The impact of the more challenging time-dependent correction is evaluated in three cases: a fast-moving storm, a decaying storm, and Hurricane Floyd off the Caribbean islands. Although underestimated because of insufficient time resolution, this poorly known part of the gradient wind correction appears to be significant in hurricanes, and might be so in fast-paced intense extratropical storms. It impacts not only the values of the retrieved pressures, but also the shape and structure of the whole pressure field. Typically, QuikSCAT currently captures a North Pacific Ocean midlatitude cyclone between 7 and 12 times throughout its life cycle. In the near future, two scatterometers with similar return periods could double the time resolution of surface wind measurements and make the calculation described here possible on a routine basis. In the meantime, it is felt that including the geo-
FEBRUARY 2002
PATOUX AND BROWN
metric gradient wind correction significantly improves the UWPBL pressure-retrieval scheme. Acknowledgments. We thank Ralph C. Foster and Gad Levy for their helpful comments and suggestions. This work was sponsored by NASA Grant NS033A-01, administered through Oregon State University, and NASA Grant NAG8-1424. REFERENCES Brown, R., and G. Levy, 1986: Ocean surface pressure fields from satellite-sensed winds. Mon. Wea. Rev., 114, 2197–2206. ——, and L. Zeng, 1994: Estimating central pressures of oceanic midlatitude cyclones. J. Appl. Meteor., 33, 1088–1095.
143
Endlich, R., 1961: Computation and uses of gradient winds. Mon. Wea. Rev., 89, 187–191. Holton, J., 1992: An Introduction to Dynamic Meteorology. 3d ed. Academic Press, 511 pp. Hsu, C., and W. Liu, 1996: Wind and pressure fields near Tropical Cyclone Oliver derived from scatterometer observations. J. Geophys. Res., 101 (D12), 17 021–17 027. ——, M. Wurtele, G. Cunningham, and P. Woiceshyn, 1997: Construction of marine surface pressure fields from scatterometer winds alone. J. Appl. Meteor., 36, 1249–1261. Levy, G., and R. Brown, 1991: Southern Hemisphere synoptic weather from a satellite scatterometer. Mon. Wea. Rev., 119, 2803– 2813. Patoux, J., 2000: UWPBL 3.0, The University of Washington Planetary Boundary Layer (UWPBL) Model. University of Washington [Available online at http://pbl.atmos.washington.edu.] ——, and R. Brown, 2001: A scheme for improving scatterometer surface wind fields. J. Geophys. Res., in press.