SPECIAL SECTION ON SECURITY AND TRUSTED COMPUTING FOR INDUSTRIAL INTERNET OF THINGS Received June 10, 2018, accepted July 19, 2018, date of current version August 28, 2018. Digital Object Identifier 10.1109/ACCESS.2018.2863244
A Graph-Based Security Framework for Securing Industrial IoT Networks from Vulnerability Exploitations GEMINI GEORGE1,2 AND SABU M. THAMPI 1 Indian
1,
(Senior Member, IEEE)
Institute of Information Technology and Management-Kerala, Thiruvananthapuram 695581, India 2 Cochin University of Science and Technology, Kochi 682022, India
Corresponding author: Gemini George (
[email protected]) This work was supported by the Department of Science and Technology, Government of India through the Women Scientist Scheme-A under Grant SR/WOS-A/ET-97/2016(G).
ABSTRACT Industrial IoT (IIoT) refers to the application of IoT in industrial management to improve the overall operational efficiency. With IIoT that accelerates the industrial automation process by enrolling thousands of IoT devices, strong security foundations are to be deployed befitting the distributed connectivity and constrained functionalities of the IoT devices. Recent years witnessed severe attacks exploiting the vulnerabilities in the devices of IIoT networks. Moreover, attackers can use the relations among the vulnerabilities to penetrate deep into the network. This paper addresses the security issues in IIoT network because of the vulnerabilities existing in its devices. As graphs are efficient in representing relations among entities, we propose a graphical model representing the vulnerability relations in the IIoT network. This helps to formulate the security issues in the network as graph-theoretic problems. The proposed model acts as a security framework for the risk assessment of the network. Furthermore, we propose a set of risk mitigation strategies to improve the overall security of the network. The strategies include detection and removal of the attack paths with high risk and low hop-length. We also discuss a method to identify the strongly connected vulnerabilities referred as hot-spots. A use-case is discussed and various security parameters are evaluated. The simulation results with graphs of different sizes and structures are presented for the performance evaluation of the proposed techniques against the changing dynamics of the IIoT networks. INDEX TERMS Industrial IoT, Internet of Things, network security, risk assessment, attack graph.
I. INTRODUCTION
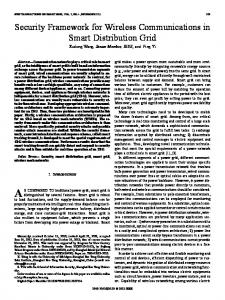
Industrial IoT is a revolutionary attempt to build smart manufacturing eco-system by applying the benefits of IoT to industrial process management. The smart connected devices such as sensors, actuators, and controllers together make up a smart manufacturing enterprise to improve efficiency and profitability. IIoT is rapidly evolving and spans several industries and services [1] as shown in Fig 1. Health-care systems are equipped with IoT devices for sensing, tracking and monitoring of patients, machines, and medicines [2]. In agriculture industry, IoT devices are used for efficient watering of plants, security surveillance of farms, and storage management of products [3]. Transportation and logistics play a significant role in the supply chain industries. IoT devices are used to find the location of vehicles, to track their movements, and to
43586
predict the time of supply [4]. IP-connected cameras, sound sensors, and movement sensors are widely used in security and surveillance [5]. IIoT in energy sector manages the supply to and from the grid, leakage monitoring, and billing [6]. IoT devices play an important role in the mining industry for sensing disaster signals, managing warning systems, tracking movement of underground miners, and monitoring shipments [7]. The backbone of an automated industry is the Industrial Control System(ICS) which may include Supervisory Control and Data Acquisition(SCADA) networks and Programmable Logic Controllers(PLC). The replacement of conventional electromechanical control systems with embedded devices has given attractive entry points for cyber fraudsters. Cyber attacks such as the Stuxnet attack against the nuclear systems of Iran [8], German steel mill blast furnace attack [9],
2169-3536 2018 IEEE. Translations and content mining are permitted for academic research only. Personal use is also permitted, but republication/redistribution requires IEEE permission. See http://www.ieee.org/publications_standards/publications/rights/index.html for more information.
VOLUME 6, 2018
G. George, S. M. Thampi: Graph-Based Security Framework for Securing IIoT Networks
TABLE 1. Vulnerabilities detected in common IoT devices.
FIGURE 1. Major industries and services employing IIoT.
Saudi Aramco oil company attack [10], and Mirai [11] are typical examples of the attacks against industrial automated systems. The inclusion of IP-connected devices in industrial automation systems toward the realization of the IIoT systems has thrown more opportunities for attackers. Numerous cyber attacks are reported targeting the industrial enterprises across the globe in 2017 and an exponential rise in such attacks is forecasted for the upcoming years [12]. As traditional networks are well-protected with stable defensive mechanisms, attackers are now trying to intrude through weak IoT devices. A huge number of vulnerabilities present in IoT devices open up opportunities for cybercriminals to attack the industrial processes. Vulnerabilities in IP cameras, printers, and routers [13] are used to launch Mirai botnet attacks. Some severe vulnerabilities detected in common IoT devices are listed in Table 1. As the vulnerabilities in the IoT devices [14] are identified as potential entry points for attackers, they pose huge threat to the IIoT network [15], [16]. An attacker can use the relation among vulnerabilities to penetrate into the network of an industrial organization through multi-hop attacks. Examples of such relations are described in section IV-A. Gaining control over the critical industrial control systems can cause far reaching implications including hijacking of the entire industrial process. As these attacks are launched via permissible traffic, they mostly remain invisible to the traditional security measures such as intrusion detectors and anti-viruses. Hence, strong security mechanisms are to be built to defend such attacks and to protect the industrial automation systems. Graphs, being efficient to represent relations among entities, can encode the vulnerability relations in the network effectively. Furthermore, the analysis of the graph can reveal VOLUME 6, 2018
security-relevant properties of the network. For fixed infrastructure networks, graphical representations such as attack graphs [17], [18] are developed to represent the possible attack paths exploiting the vulnerability relations. Inspired from these models, we propose to formulate a graphical model to represent the vulnerability relations, attackers, and targets in the IIoT network. The difference between our model and models for fixed infrastructure networks is described in III-A1. The proposed modeling of graph helps a security administrator to foresee the risks and to truncate the attack paths by identifying the changes to be made in the network security configurations. Moreover, modeling of such graphs enables us to formulate the network security problems into graph-theoretic problems and analyze their solutions. To develop structures that represent vulnerability relations, unique characterization of vulnerabilities is important. Common Vulnerability Scoring System (CVSS) [19] is an open security standard for describing the specific characteristics and impacts of vulnerabilities. National Vulnerability Database(NVD) [20] is another attempt for the standardization of vulnerabilities. Unlike in fixed infrastructure networks, patches and upgrades cannot be expected for many of the vulnerabilities in IoT devices [14] as the underlying light weight operating systems are difficult to update. Hence, in practical IIoT scenarios, it is nearly impossible to patch up all the vulnerabilities existing in the devices within the network, so as to make the network free from attack. Therefore, alternative risk mitigation strategies are to be investigated to improve the defense capability of the network. A quite intelligent approach among such alternatives is to patch up a sufficient number of highrisk vulnerabilities existing within the devices of the network such that the overall security of the network is significantly improved. We propose a set of risk mitigation strategies to identify such high-risk vulnerabilities. The proposed strategies provide multiple options for the security administrator, so that he can make efficient decisions from the available solutions in the IIoT scenario. The major contributions of our work follow. • We propose a graphical model that represents multi-stage and multi-host attacks to targets through the chaining of vulnerabilities in the IIoT networks. We also propose techniques to extract security-relevant parameters from the graph. 43587
G. George, S. M. Thampi: Graph-Based Security Framework for Securing IIoT Networks
•
•
Depending on the ease of exploitation of a vulnerability, we apply a probabilistic metric to the corresponding edge in the graph. This enables us to compute the cumulative threat corresponding to each attack path. We propose risk mitigation strategies based on the following approaches: – Selective removal of the high-risk attack paths. – Removal of attack paths with low hop-lengths. – Removal of hot-spots.
•
We present a realistic example scenario of an IIoT network and evaluate its security-relevant parameters.
The proposed risk mitigation strategies are of high relevance in an IIoT network. We compute the cumulative threat of each possible path and identify the dominant attack paths with high cumulative threats. The selective removal of these paths results in an improved network security. Hop-based strategies rely on the fact that the attackers always try to complete the execution of attack in minimum possible hops so as to remain unnoticed in the network. Hence, we propose a method to find the paths to be removed such that the attacker has to traverse at least a minimum predetermined number of hops to successfully compromise a target device. Hot-spots refer to those vulnerability elements in the network which are strongly connected with the other vulnerability elements. Therefore, removal of such vulnerabilities can drastically reduce the number of attack paths. We discuss an algorithm to detect the hot-spots in an IIoT network. In the proposed graph, the vertices represent the vulnerabilities present in any of the devices in the network and the edges represent their relations. It is important to note that the formulated model is different from the common graphical representation of the network, where the vertices represent the devices of the network and the edges represent the physical connections between the network devices. Moreover, the removal of an attack path from the graph corresponds to the patching of the underlying vulnerabilities in the network and does not correspond to the removal of the physical connections between the network devices. Consider an example case in which two machines M1 and M2 are physically connected. Let the exploitation of a vulnerability v1 in the machine M1 give the attacker the capability of exploitation of another vulnerability v2 in machine M2 . Our proposed graph corresponding to this example scenario includes two nodes to represent the vulnerabilities v1 in M1 and v2 in M2 and the edge between the nodes represents the relation among the vulnerabilities. This edge corresponds to an attack path. The patching of the vulnerabilities in the machines leads to the removal of the nodes and attack path from the graph. However, the physical connections between M1 and M2 is unaffected. Hence, the physical connectivity among the devices and the legitimate traffic in the network are unaffected by the implementation of the proposed risk mitigation strategies. The rest of the paper is organized as follows. In section II, we discuss the vulnerability-based security solutions in the 43588
industrial automation systems and in the IoT networks. In section III, we present our proposed scheme and formulate the graphical model to represent the vulnerability relations in the IIoT network. Furthermore, we discuss the extraction of security-relevant parameters from the graph and propose risk mitigation strategies for security improvement. The simulation results are presented in section IV. We present the conclusion and future works in section V. II. RELATED WORKS
Several works have investigated the security issues in Industrial Control Systems(ICS) and IoT networks. However, to the best of our knowledge, no major security frameworks are developed for the IIoT systems. As the IIoT eco-system is the blend of ICS and IoT, smart security designs for IIoT systems should leverage the existing security approaches in the ICS and IoT networks. In this section, we present a brief description of the important security frameworks for industrial automation systems and IoT networks, with an emphasis on the attacks using vulnerabilities in the network devices. Risk assessment and security management of industrial automation systems are well investigated. Ten et al. [21] used attack trees to evaluate security in power system control networks. They propose an analytical method for measuring the severity of vulnerabilities. Different scenarios of security breaches are mapped into a tree structure and an upper bound of threat value is imposed to find the pivotal leaves which require counter measures. Patel and Zaveri [22] developed a vulnerability tree of an industrial control system based on the past history of attacks. For each system in the network, they used two indices, referred as threat impact index and cyber vulnerability index, both ranging from 0 to 100 and denoting the financial impact and vulnerability impact, respectively. However these values were assigned using the questionnaire methods. A Network Security Risk Model (NSRM) was developed by Henry and Haimes [23] for process control networks(PCN) to represent the attack paths in a graph. They formulated a risk analysis based on a model that captures the dynamics of cyber attacks on PCNs. The nodes in their graph denote the system components and the edges denote the influence among them. They presented the effectiveness of their method on a use-case of SCADA-controlled oil pump station. A digraph model for the formal and explicit representation of the structure of a SCADA system was presented by Guan et al. [24] for risk assessment and management. The devices in the network are mapped into the nodes and the security relations among the devices are mapped into the edges of the graph. They found the devices to be affected with high probability in case if any device in the network was already infected. They applied their method in a chemical distillation system. Kriaa et al. [25] used a Markov model driven by Boolean logic which models an attack by mapping Markov process on Fault trees. An evaluation of the STUXNET attack is also presented using their method. Game theoretic approaches were introduced [26] for security analysis of the grid-based SCADA systems. Cherdantseva et al. [27] VOLUME 6, 2018
G. George, S. M. Thampi: Graph-Based Security Framework for Securing IIoT Networks
presented a thorough review of major works in the security of the industrial control systems. A systematic review of cybersecurity issues in different industries is presented in [28]. Most of the works discussed above use graph based structures to model the attack paths as in our proposed work. However, the formulation of attack paths and computation of security impact in these works rely on heuristics such as history of attacks, opinion of experts, model checking and domain knowledge. In our work, the formulation of path is governed by vulnerability relations which are available from the Internet resources, and computations are based on standards such as CVSS and hence our proposed work can be uniformly applied to all industries. Security in the IoT network has been widely investigated [29]–[32]. However, most of the works are focused on the development of the light weight security protocol equivalents to the existing non-IoT security protocols, as the IoT devices are constrained in functionalities. As our focus is on the vulnerability-related security issues of IoT networks, we limit our review only to such works. However, investigation on vulnerability-based risk assessment framework for IoT networks is still in a nascent stage. A few works investigated in this domain are presented and compared with our approach. An attacker’s first aim is to scan the vulnerabilities existing in the IoT network so as to get the entry points. Shodan [33] is an IoT search engine used for scanning of the vulnerabilities in the IoT devices [34]. The work also analyzes the scan results and discusses the ease of hacking of the IoT devices. However, it does not discuss any method to improve the security of the system. The IoT devices are designed with a capability of communication among them. These crossdependencies among the IoT devices can be used by an attacker to advance through the network by exploiting the vulnerabilities residing in them. Yu et al. [14] used a few example scenarios to show how the cross-device dependencies are exploited by the attackers. They also discussed the challenges posed by the cross-device interactions in the IoT networks and emphasized the need of a network-level solution rather than a host-based solution. However, they do not discuss any general methods to defend these challenges. Our graphical model corresponds to a network-level solution, and the proposed risk mitigation strategies address vulnerabilitybased security challenges. Simpson et al. [16] discussed the security impact of the unavailability of the software patches and updates for the vulnerabilities residing in the IoT devices. They proposed a hub-based security management system to monitor the traffic and to limit the attacks for securing home IoT devices. However, they do not discuss how the approach detects the attacks which exploit the vulnerabilities through permitted traffic. Another drawback of the approach is that the method works only for smart home environments and can not be applied in general. However, our formulated model is of generic nature, and hence it can be applied to any industrial scenario. Romero-Mariona et al. [35] proposed a VOLUME 6, 2018
security evaluator referred as C-SEC. Even though the tool is proposed for IIoT networks, their work is focused only on ICSs, and the contribution to the IIoT network is limited. Furthermore, their work is theoretically formulated and no experimental evaluation is conducted. In our work, we present an example use-case to evaluate our proposed method apart from the discussion of the comprehensive simulation results. Ge et al. [36] proposed a security model generator and evaluator using a formal graph-based approach to analyze the vulnerability-related issues in the IoT networks. Even though the work is based on strong theoretical formulations, they do not present graphical structures representing the attack paths, for example scenarios. Moreover, the nodes in the graph represent the components of the network, and the edges represent the relations among the components. This graphical representation is unable to provide a visualization of the sequence of vulnerabilities exploited by the attacker. As the nodes in our graph represent vulnerabilities and edges represent their relations, our model is capable of providing a proper visualization of the sequence of vulnerability exploitations in the attack path. Moreover, for a better understanding of the theoretical formulation, we present an example graph corresponding to a realistic scenario. Wang et al. [15] proposed a graphical methodology to find the optimal attack path based on the maximum flow network. They calculated the cost of the attacks through their own methodology. However, they do not evaluate their methodology for a proper IIoT scenario even though their proposal is for IIoT network. Moreover, they do not propose any techniques to mitigate the risk. The major advantage of our method is the efficient risk mitigation strategies proposed. The summary of the discussion is presented in Table 2. Most of the vulnerability-based approaches discussed in this section are focused on the formulation of graph-based systems for security evaluation and have not fully leveraged the benefits of analysis of the modeled graphs. Moreover, many of these models use their own methodologies for the computation of the impact of the attacks and do not discuss the strategies to mitigate the risk in the network. However, in the IIoT environment, such risk mitigation strategies are very important and effective. Hence, we propose a vulnerability-based security framework for the IIoT environment, compute the impact of the attack paths by mapping the scores from widely accepted standards, and focus on the analysis of the modeled graph to design the risk mitigation strategies. III. PROPOSED FRAMEWORK
Our proposed framework can be divided into three phases as shown in Fig. 2. In the pre-processing phase, the details of the IIoT network and the vulnerabilities existing in the network devices are collected. The details of the network include topology and configuration of the network, configuration of network devices such as SCADA components, IoT devices, and other components, connectivity among the devices, and access control policies. The vulnerability details include 43589
G. George, S. M. Thampi: Graph-Based Security Framework for Securing IIoT Networks
TABLE 2. Summary of major works in vulnerability based security of IoT networks.
points in the network. Vulnerabilities in the IoT devices of the IIoT network are potential candidates to which the source nodes can be connected. The sink nodes can be vulnerabilities in the control systems, compromising of which can lead to control over industrial processes or vulnerabilities in other information systems of the industrial enterprise where crucial information reside. The vulnerabilities which if compromised provide root access to critical control devices are generally considered as for sink nodes in the IIoT network. The modeled graph is analyzed in the third phase. The attack paths from the source nodes to sink nodes are visualized and relevant security parameters of the industrial network are evaluated. We apply risk mitigation strategies in the graph and identify the attack paths and nodes that pose serious threat to the network. This enables a security administrator to take efficient risk mitigation decisions in the constrained IIoT environment. A. MODELING OF EXPLOITABLE IIoT NETWORK GRAPH
FIGURE 2. Proposed framework.
reports from the vulnerability scanners [33], vulnerability dependency details, and scores assigned to the vulnerabilities by standards such as CVSS. The details gathered during the first phase are cognitively represented in the form of a graph in the graph modeling phase. In this phase, we formulate the nodes of the graph as device-vulnerabilities and the edges as vulnerability dependencies. The potential attack initiation points in the network are identified and are used to model the source nodes and the potential target points toward which the attacks may possibly be directed in the network are identified and modeled as sink nodes. It is to be noted that the source nodes representing attackers are connected to the possible entry 43590
In this section, we discuss modeling of the proposed graph. We first identify the exploitable elements in the IIoT network and the devices in which they reside. Then we define the terms Exploitable IIoT Network and Exploitable IIoT Network Graph with their formal notations. Definition 1 (Vulnerability Pattern): Exploitable elements are associated with an IIoT network due to the presence of inherent vulnerabilities in different network devices. Attackers may concatenate these exploitable elements to form channels to automation devices to take control over the industrial processes or to reach critical resources in the network. The possible vulnerability elements are segregated into different Vulnerability Patterns as follows: • Software security weaknesses such as the operating system flaws in control systems, anomalies in the application software in sensor devices and communication equipments, improper input validation, packet construction anomalies, insecure authenticity verification, and weak access control management. • Insecure device configurations such as the vulnerabilities present in ICS products, improper sensor configuration, installation flaws, service vulnerabilities, lapses in ports, and poor credential management. VOLUME 6, 2018
G. George, S. M. Thampi: Graph-Based Security Framework for Securing IIoT Networks
Improper network configurations such as weakness in the firewall rules, LAN settings, security lapses in the services & ports, and wrong implementation of the access control policies. Definition 2 (Vulnerability and Vulnerability Space): Informally Vulnerability can be defined as a deficiency or trouble that exists in any device within the network and this deficiency may be exploited by an attacker for attacking the device. It can be formally considered as the instance of any of the Vulnerability Patterns discussed above. The set of all vulnerabilities existing in the devices of an industrial network is referred to as Vulnerability Space and is denoted by R. Uncontrolled search path element vulnerability (CVE-2017-9661) in the SIMPlight SCADA software is an example vulnerability which falls under the Vulnerabiliy Pattern of software security weaknesses. This vulnerability allows an attacker to inject a malicious DLL file which enables arbitrary code execution. Another examples under the same pattern include the command injection vulnerability (CVE-2017-12125) in Moxa EDR-810 whereby an attacker can escalate the privilege to root shell, and the buffer overflow vulnerability (CVE-2013-0657) in Schneider Graphical SCADA System which allows an attacker to trigger arbitrary code execution. The vulnerability (CVE-2018-4840) associated with the Siemens EN100 Ethernet module which permit remote attack without authentication, and the vulnerability (CVE-2014-0769) which allows an attacker to change the system configuration via request to debug service in port 4000 in the Festo CECX PLC are examples for vulnerabilities under insecure device configuration pattern. The vulnerability (CVE-2012-6437) in the Rockwell Automation Ethernet/IP products which permit a remote attacker to execute malicious script in the device is another example of the same pattern. The vulnerabilities under improper network configuration pattern include the vulnerability (CVE-201712262) in the firewall configuration of the CISCO enterprise controller module(APIC-EM) which allows an attacker to access unauthenticated services available in the internal network, and the password vulnerabilities (CVE-2017-12127, CVE-2017-12129) in the industrial secure router(Moxa EDR-810). To identify the potential vulnerability elements within different network devices which may cause device exploitation, we define Vulnerability Exploitation Test and Device-Vulnerability Exploit Set as follows. Definition 3 (Vulnerability Exploitation Test): The Vulnerability Exploitation Test γ takes a device-vulnerability pair as input and specifies whether the device can be compromised due to the exploitation of the vulnerability under consideration. For any device d in the IIoT network and vulnerability r, γ (d, r) gives a True value if and only if the vulnerability r may lead to the exploitation of the device d. For example vulnerability(CVE-2011-3143) can lead to the exploitation of the Microsystems ClearSCADA device by triggering the memory corruption. •
VOLUME 6, 2018
Definition 4 (Device-Vulnerability Exploit Set): The Device-Vulnerability Exploit Set associated with a device is defined as the set of all vulnerabilities which can be exploited to attack the device under consideration. Formally, we may say that, for any device d, the Device-Vulnerability Exploit Set DR (d) = {(d, r) | r ∈ R and γ (d, r) = T }. Let 9 be the Network Device-Vulnerability Exploit Set corresponding to all devices in the network and is given by 9 = {(d, r) ∈ D×R where γ (d, r) = T } where D is the set of devices in the IIoT network. Now we define the term Exploitable IIoT Network with reference to the above terminologies. Definition 5 (Exploitable IIoT Network): An Exploitable IIoT Network can be defined as a four-tuple exploitable structure (D, SRC, SNK , 9) where D is the set of devices in the IIoT network. SRC is the set of source nodes from which potential attacks can be initiated. • SNK is the set of sink nodes to which potential attacks are directed. • 9 is the Device-Vulnerability Exploit Set of the IIoT network. Now, we define the term Exploitable IIoT Network Graph associated with an Exploitable IIoT Network as follows. Definition 6 (Exploitable IIoT Network Graph): The Exploitable IIoT Network Graph of an Exploitable IIoT Network (D, SRC, SNK , 9) is a weighted directed graph G = (V , E) where • •
V is the set of vertices of the graph. The vertices may correspond to the exploitable elements in a device labeled by a pair (d, r) ∈ 9 or may correspond to the source nodes labelled by srcj ∈ SRC. Mathematically, V = 9 ∪ SRC. • E is the set of directed edges of the form ((d1 , r1 ), (d2 , r2 )) and represents the possibility of an exploitation from node (d1 , r1 ) to (d2 , r2 ) or (srci , (d, r)) representing the possibility of an exploitation from source srci to node (d, r). A directed edge from node (d1 , r1 ) to (d2 , r2 ) denotes the vulnerability relation that exists from the first node to the next. The strength of the edge is represented by Threat Estimator Function defined across the edge. The Threat Estimator Function TF : E → [0, 1] where TF ((d1 , r1 ), (d2 , r2 )) is the measure of the easiness of exploitation from (d1 , r1 ) to (d2 , r2 ) and TF ((srcj , (d, r)) is the measure of easiness of exploitation from attacker srcj to node (d, r). A higher value of Threat Estimator Function across an edge indicates that it is easier to exploit the vulnerability represented by the end node of that edge. TF ((d1 , r1 ), (d2 , r2 )) can be defined as the probability that the device d2 can be exploited due to a vulnerability element r2 under the condition that the device d1 is already exploited due to vulnerability element r1 . The assigned probabilistic metrics can be derived from the CVSS scores. The CVSS score of a vulnerability consists of three major scores namely base score, temporal score, and •
43591
G. George, S. M. Thampi: Graph-Based Security Framework for Securing IIoT Networks
environmental score. Each score is represented by a numerical value between 0 and 10 representing the severity of the vulnerability. The base score represents the intrinsic nature of the vulnerability, whereas temporal and environmental scores reflects the time variance and environmental variance of the vulnerability. As suggested in many works [18], [37], our method also rely on the base score of the CVSS to assign metric to the Threat Estimator Function. Furthermore, as discussed in [17] the metrics are assigned as the edge weights. 1) COMPARISON WITH GRAPH BASED APPROACHES FOR NON-IoT NETWORKS
Many approaches [38]–[40] are developed for the graphical formulation of the attack paths in the non-IoT networks. However, there are wide differences among these approaches in terms of representation of the nodes, edges, and computation of the metrics. Most of the methods discussed above, formulate the graph from the attack perspective where the nodes represent the pre-post conditions of the attacks and the edges represent the possibility of the atomic attacks. However in our approach, we view the IIoT network from the vulnerability perspective and formulate an Exploitable IIoT Network based on which the graph is modeled. Moreover, the nodes in our graph represent the vulnerability in devices and the edges represent the vulnerability relations. This enables a better security view of the network. The major problem associated with the techniques for the non-IoT network was the lack of scaling to large networks. Moreover, the computations were intensive as the network grew. These problems were due to the reason that as the network grew, the number of attack sequences grew exponentially, leading to prohibitive complexity. Hence, to make the graph scalable, Amman et al. [41] proposed an algorithm based on monotonicity assumption. The work assumes that an attacker never relinquishes an obtained privilege and hence the attacker never goes back to an already compromised state. This approach is widely accepted, and algorithms were developed [37] to remove cycles from the graph. Our proposed method also inherits these assumptions. The removal of possible cycles from the Exploitable IIoT Network Graph results in the formation of Directed Acyclic Graph(DAG). 2) ADDRESSING DYNAMICS OF IIoT NETWORK
The IIoT networks are dynamic in nature. More devices may be added or removed from the network. Furthermore, new vulnerabilities may originate in the devices or the existing vulnerabilities may be healed. The proposed multisource multi-sink model is capable of adequately covering the changing dynamics of the network. The new vulnerabilities originating in the devices can be represented as new vertices in the Exploitable IIoT Network Graph. Moreover, the vulnerability relations associated with the new vulnerabilities can be represented as the edges to the newly formed vertices. The addition of the new edges and vertices to the graph may lead to the formation of new paths from the source to sink nodes. 43592
Similarly, the removal of a vulnerability from a device in the network can be represented in the graph by removing the corresponding vertex and associated edges from the graph. This may lead to the removal of certain attack paths from the source to sink vertices of the graph. B. THREAT ESTIMATION IN EXPLOITABLE IIoT NETWORK GRAPH
In this section, we discuss the techniques to identify the different paths from the source to sink nodes of the IIoT network and to compute the cumulative threat at the latter. Let G = (V , E) be the Exploitable IIoT Network Graph associated with an Exploitable IIoT network (D, SRC, SNK , 9). Let the source nodes representing attackers be denoted by src1 , src2 , ... srcp and the sink nodes representing targets be denoted by snk1 , snk2 , ... snkq . Let for every (ni , nj ) ∈ E, TF (ni , nj ) represents the probability of exploitation from node ni to nj . Now for each attacker srci (1 ≤ i ≤ p) and target snkj (1 ≤ j ≤ q), find the possible weighted attack paths from srci to snkj . The Cumulative Threat(CT) of an attack path is the product of the threat values of the underlying edges included within the path. Let Pathm ij be the mth attack path from srci to snkj . Let the nodes in the path be srci , n1 , n2 , ... nl , snkj . Then the Cumulative Threat of the path CT (Pathm ij ) is given by, CT (Pathm ij ) = TF (srci , n1 ).
l−1 Y
TF (ni , ni+1 ). TF (nl , snkj )
i=1
(1) Now we form the Threat Score Matrix TSM ∈ R3 , where, TSM (i, j, m) = CT (Pathm ij )
(2)
The equations are important and are useful in implementation of risk mitigation strategies discussed in section III-C. 1) THREAT ESTIMATION AT SINK NODES
Let srci and snkj be any given source node and sink node representing any attacker device and target device, respectively, and Nij be the number of paths from srci to snkj . A security analyst is always keen in analyzing the threat at the sink nodes of the network. Let (SNKmaxj )i , SNKmaxj and SNKmax denote the maximum threat at snkj , from srci , maximum threat at snkj and maximum threat among all targets, respectively. Then, these threats are estimated as follows. (SNKmaxj )i = max(TSM (i, j, m))
for 1 ≤ m ≤ Nij
(3)
SNKmaxj = max((SNKmaxj )i ) for 1 ≤ i ≤ p
(4)
SNKmax = max(SNKmaxj ) for 1 ≤ j ≤ q
(5)
The equations are helpful to compute different security levels at various targets in the IIoT network. Furthermore, the priori probabilities of the attack at different targets given an attacker has initiated the attack can be derived. VOLUME 6, 2018
G. George, S. M. Thampi: Graph-Based Security Framework for Securing IIoT Networks
2) THREAT ESTIMATION FROM SOURCE NODES
Let srci and snkj be any given source and sink nodes respectively and Nij be the number of paths from srci to snkj . Let (SRCmaxi )j , SRCmaxi and SRCmax denote the maximum threat from srci to snkj , maximum threat from srci and maximum threat from among all attackers respectively. Then these threats are estimated as follows. (SRCmaxi )j = max(TSM (i, j, k)) for 1 ≤ k ≤ Nij
(6)
SRCmaxi = max((SRCmaxi )j ) for 1 ≤ j ≤ q
(7)
SRCmax = max(SRCmaxi ) for 1 ≤ i ≤ p
(8)
The severity of capabilities of the attackers in the network can be computed using these equations. Moreover, the posteriori attack probabilities of the source nodes can be derived, given any target is already been attacked. C. EVALUATION OF SECURITY PARAMETERS AND STRATEGIES FOR THREAT REDUCTION IN THE EXPLOITABLE IIoT NETWORK GRAPH
In many practical situations, it is nearly impossible to patch up all the vulnerabilities existing in the devices within the IIoT network so as to secure the network. It is because patches are unavailable for many IoT devices and many a times patching of a vulnerability requires upgradation of a software or hardware which is not often cost-effective. This motivates us to design alternative strategies for improving the network’s capability of defense. A quite obvious strategy among such alternatives is to identify a sufficient number of vulnerabilities existing within the devices of the network such that patching up of those vulnerabilities causes a significant reduction in the overall threat level of the network. As discussed in section I, these strategies are highly relevant in IIoT networks. In the course of the discussion of evaluation of security parameters and risk mitigation strategies, it is assumed that any cycle in the formulated Exploitable IIoT Network Graph is removed using the methods discussed in section III-A1 and hence the graph is acyclic. As discussed in section I, it is important to note that the removal of attack paths and nodes proposed by the risk mitigation strategies corresponds to the healing of the vulnerabilities in the devices and does not correspond to the removal of physical connectivity between the devices. 1) EVALUATION OF SECURITY PARAMETERS
As the Exploitable IIoT Network Graph encodes vulnerability relations in the network, analysis of the same can reveal many security-relevant parameters of the network. Moreover, there can be many paths from a given attacker to a target. As the edge weight represents the ease of attack, the cumulative threat corresponding to a path can be computed by taking the product of the weights of the underlying edges of the path. Hence, listing of attack paths from all attackers to targets with their cumulative threat value, can provide significant information about the threat existing at different targets. Furthermore, each of these attack paths may require different number VOLUME 6, 2018
of hops that the attacker needs to traverse to reach the target. The number of hops in an attack path may be referred as the hop-length of the path. The path with a lower hop-length poses a higher threat, as the attacker always prefers to follow a minimum number of hops, so as to remain unnoticed in the network, and to retain the chances of attacks at a later stage. Hence, the parameters such as the cumulative threat and the hop-length corresponding to the attack paths are important in security perspective. In this section, we discuss certain approaches to measure these critical security parameters from the Exploitable IIoT Network Graph. A listing of possible attack paths from a given source node srci to a given sink node snkj can be obtained by using an algorithm GETPATHS1. The output of the algorithm may be stored as table T consisting of six entries. The entries are • Path number • Source identifier srci • Target identifier snkj • Hop-length • Cumulative threat • Path from srci to snkj . Algorithm 1 Algorithm to List Possible Attack Paths Input: An Exploitable IIoT Network Graph G, a table T to store the parameters and a given target snkj . Output: A table T containing the attack paths toward snkj and the parameters associated with each path. 1: Set T = φ 2: function GetPaths1(G, T , u, hop, P, snkj ) 3: for each node v adjacent to u do 4: P[hop] := u 5: if v = snkj then 6: P[+ + hop] := v 7: Compute the threat for the path in P as described in equation 1. 8: Add hop, threat and path in P to the table T . 9: return; 10: GetPaths1(G, T , v, hop + 1, P, snkj ) To find the attack paths from srci to snkj in the given Exploitable IIoT Network Graph G, we need to call the algorithm as GETPATHS1(G, T , u, 0, P, snkj ), with u set as srci . P is an array used for the temporal storage of path during the progress of the algorithm. Table T contains all attack paths from srci to snkj with the respective cumulative threat and hop-length. Algorithm 1 illustrates the steps. The proposed method is a back tracking algorithm and the complexity is measured by counting the total number of recursive calls of GETPATHS1 during the course of execution. Let Nij be the number of paths from srci to snkj and Lij be the hop-length of the longest path amongst them. Then the complexity of the algorithm is given by O(Nij .Lij ). As our proposed graph is a DAG, the termination of algorithm is guaranteed. Moreover, the scalability problem of the 43593
G. George, S. M. Thampi: Graph-Based Security Framework for Securing IIoT Networks
graph is disregarded using monotonicity constraint discussed in section III-A1. The computation of relevant security parameters is described in Algorithm 2. The algorithm takes table T as input and compute important parameters such as maximum and minimum hops required for an attacker to reach the target, maximum and minimum threat among all paths, and the average values of hops and threat. As the algorithm runs for each paths, its complexity is given by O(Nij ).
The formulation of the bipartite graph provides a consolidated visualization of the security of the network. Let Nij , Lij , p and q represents the number of paths from srci to snkj , the hop-length of longest path among them, the number of attackers, and the number of targets respectively. Then the complexity of the algorithm is given by O(Nij .Lij .p.q).
Algorithm 2 Algorithm to Compute Security Parameters Input: A table T containing the attack paths from a given source srci to a given target snkj and corresponding security parameters. Output: A set of security parameters. 1: function FINDVALUES(T ) 2: MinHop := ∞; MaxHop := −∞; 3: MinThreat := ∞; MaxThreat := −∞ 4: for each path P with hop hp and threat th in T do 5: if MinHop > hp then 6: MinHop := hp; 7: if MaxHop < hp then 8: MaxHop := hp; 9: TotalHop := TotalHop + hp; 10: if MinThreat > th then 11: MinThreat := th; 12: if MaxThreat < th then 13: MaxThreat := th; 14: TotalThreat := TotalThreat + th; 15: AvgHop := TotalHop/Number of paths in T 16: AvgThreat := TotalThreat/Number of paths in T
Algorithm 3 Algorithm to Produce G0 Input: An Exploitable IIoT Network Graph G, a table T to store the paths, a set SRC of p source nodes, a set SNC of q sink nodes and a parameter α representing the threatthreshold that correspond to the maximum allowable cumulative threat in any attack path. Output: A sub-graph G0 of G including all sources and sinks and a subset of paths from each source to each sink with a cumulative threat at most α. 1: Set V (G0 ) = V (G), E(G0 ) = φ 2: Set V (H ) = (SRC, SNK ) and E(H ) = φ 3: for each attacker target pair (srci , snkj ) do 4: Set T = φ 5: Call GetPaths1(G, T , srci , 0, P, snkj ) 6: For each path in table T , include a directed weighted edge (srci , snkj ) in H whose weight equal to the cumulative threat of the underlying path from srci to snkj . 7: for each edge (u, v) in E(H ) do 8: if weight of the edge (u, v) is less than or equal to α then 9: Include the path in G that corresponds to the edge (u, v) into the graph G0 and update the set E(G0 ) accordingly. 10: Return
2) THREAT REDUCTION BY REMOVING PATHS WITH HIGH CUMULATIVE THREAT
3) THREAT REDUCTION BY REMOVAL OF ATTACK PATHS WITH LOW HOP LENGTH
It seems quite evident that the attack paths with a high cumulative threat within the Exploitable IIoT Network Graph are easier for the attackers to exploit. Therefore, it is logical to remove all the attack paths of which cumulative threat exceeds a given threshold value referred as the threat-threshold. The procedure to remove the paths with a high cumulative threat is illustrated in Algorithm 3. The input to the algorithm is the Exploitable IIoT Network Graph G = (V , E) along with parameter α representing the threat-threshold in any attack path. The algorithm produces the output graph G0 , which is a sub-graph of G with all the paths with higher threat eliminated. From the given input graph G, the algorithm forms a weighted directed bipartite multi-graph H = (SRC, SNK ), which consists of edges only of the form (u, v) where u ∈ SRC and v ∈ SNK , with the weights representing the cumulative threat of the corresponding attack path from u to v. The algorithm then extracts the edges of H whose edge weights are lesser than α and include the edges corresponding to these light-weight paths in the output graph G0 .
An attacker always tries to avoid the event of being noticed by the security monitoring devices and the strategies deployed within the network. Therefore a common strategy that any attacker may follow is to avoid the use of the attack paths with more number of hops while attacking a network. This is due to the fact that if the attack paths with more number of hops are used for the attack, the attacker needs to pass through more number of devices in the network except in the cases of privilege escalations. This increases the attacker’s chance of getting detected by the security mechanisms. This further implies that the removal of the attack paths with lesser number of hops would be a fair heuristic approach to reduce the threat that is imposed by the attackers. To find only desired paths from srci to snkj with the hop-length more than a hop-threshold value β in a given Exploitable IIoT Network Graph G an algorithm GETPATHS2(G, T , u, 0, P, snkj , β) may be called with u set as srci . Here, T represents the table storing each desired path from srci to snkj and P is an array used for the temporal storage of path during the progress of the algorithm.
43594
VOLUME 6, 2018
G. George, S. M. Thampi: Graph-Based Security Framework for Securing IIoT Networks
Algorithm 4 Algorithm to List the Attack Paths With HopLength Larger Than Hop-Threshold β Input: An Exploitable IIoT Network Graph G, a table T to store the required paths from a given source srci to given target snkj . Output: A table T containing the required attack paths from a given source srci to snkj . 1: Set T = φ 2: function GetPaths2(G, T , u, hop, P, snkj , β) 3: for each node v adjacent to u do 4: P[hop] := u 5: if (v = snkj ) then 6: P[+ + hop] := v 7: if (hop < β) then 8: return; 9: Add the path in P to the table T . 10: return; 11: GetPaths2(G, T , v, hop + 1, P, snkj , β)
Algorithm 4 illustrates the steps. This algorithm is a slight variant of GETPATHS1. It is quite obvious that the implementation of both the algorithms is the same. Hence the complexity of the algorithm is given by O(Nij .Lij ). Algorithm 5 Algorithm to Produce G00 Input: An Exploitable IIoT Network Graph G, a table T to store the path, a set SRC of p nodes, a set SNC of q nodes and a parameter β representing the hop-threshold. Output: A sub-graph G00 of G including all the source and sink nodes and a subset of paths from each attacker to each target with a hop-length at least β. 1: Set V (G00 ) = V (G), E(G00 ) = φ 2: for each source sink pair (srci , snkj ) do 3: Set T = φ 4: Call GetPaths2( (G, T , srci , 0, P, snkj , β)). 5: Include the paths specified in T to E(G00 ). 6: Return Algorithm 5 describes the steps to produce G00 which is a sub-graph of G in which all the paths with the hop-length lower than the hop-threshold are removed. The complexity of the algorithm is given by O(p.q.Nij .Lij ). 4) DETECTION OF HOT-SPOTS IN THE IIoT NETWORK
As discussed in section I, relations exist among the vulnerabilities. This corresponds to connectivities in our modeled graph. The more the connectivity of a node representing a vulnerability, the more it paves the path for an attack. Furthermore, a heavily connected node acts as a hub node and there is a high possibility that many attack paths may pass through such nodes. Hence, the removal of such nodes will decrease the connectivity space of the attacker to launch attacks and thereby improves the overall security of the IoT network. In this section, we propose a technique to VOLUME 6, 2018
identify the vulnerabilities which are ’heavily connected’. We refer these vulnerabilities in the network and corresponding nodes in the graph as hot-spots. We introduce the term hot-spot index to each node to represent the connectivity of the node. The nodes with hot-spot index greater than a threshold value can be considered as hot-spots in the network. Algorithm 6 Algorithm to Find Hot-Spots in the IIoT Network Input: An Exploitable IIoT Network Graph G, a table TB to store the new label, actual label and hot-spot index of each node in the graph G. Output: A table TB containing the new label, actual label and hot-spot index of each node in the graph G. 1: function FINDHOTSPOTS(G, TB) 2: Relabel each node of G as 0, 1, 2, 3, ..n − 1 and add the pair (newlabel, actual label) to the table TB. 3: for i:=1 to n-1 do 4: indegree = 0; 5: outdegree = 0; 6: for j:=1 to n do 7: indegree = indegree + G[j][i]; 8: outdegree = outdegree + G[i][j]; 9: hotspotindex := indegree + outdegree; 10: Add hot-spot index to the third field of the ith row of TB. 11: Return TB The steps for finding the hot-spots in a network is given in Algorithm 6. The algorithm assumes that the graph is implemented using adjacency matrix. The algorithm starts with renaming the nodes of the graph G as 1, 2, 3...n. Furthermore, a table TB consisting of n rows and three columns is generated by the algorithm. The first two fields of each row represent the new label and actual label of the corresponding nodes of the graph and the third field represents the hopspot index of the nodes. The complexity of the algorithm is given by O(n2 ), where n is the number of nodes of the graph. To identify the hot-spots in an IIoT network, we have to first set a cut-off value for the hot-spot index. Let this parameter be denoted as cut-off index. The nodes with hot-spot index greater than or equal to the cut-off index are detected as hot-spots in the network and are candidates for removal. The security administrator has to set the value for the cut-off index. Higher the cut-off index, lower the number of nodes identified as hot-spots in the network. The healing of the vulnerabilities represented by hot-spots leads to the removal of the corresponding nodes and associated edges from the Exploitable IIoT Network Graph. It shall always contribute to the termination of the attack paths associated with those nodes. Hence, the hot-spot detection and removal approach plays important role in the reduction of risk at the targets in the underlying IIoT network. 43595
G. George, S. M. Thampi: Graph-Based Security Framework for Securing IIoT Networks
FIGURE 3. An example industrial IoT network.
IV. SIMULATION RESULTS
In this section, we consider an example IIoT network scenario to understand the graphical formulation and security evaluation discussed in our proposed method. Furthermore, we present the simulation results conducted on synthetic graphs to evaluate the performance of the proposed risk mitigation strategies. A. AN EXAMPLE SCENARIO
Energy-efficient buildings and organizations with solar rooftops or farms are gaining importance toward the realization of self sustained industrial environment. Industrial control systems are used to monitor and control the physical processes involved in the industry. The industrial control network is connected over the WAN to the enterprise’s internal network to allow remote monitoring and management of the industrial processes. Intelligent energy control enables the proper management of power from solar panels, grid, generator, and inverter. Fig3 shows an IoT solar network integrated with an industrial plant control network which is taken as an example network to understand the graphical representation of the vulnerability relations in it. In this network, the Solar Array Management Module(SAMM) and the inverter are IoT appliances and are integrated with the building power management system of the organization. The integrated system is capable of maintaining optimal levels of power harvested from the solar arrays, smartly regulating the consumption from the backup generators, and power grid. The system also helps in controlling 43596
the solar arrays to orient their direction to the sun, and in controlling the fans for cooling the panels as per requirement to prevent them from damage. The IoT functionality provides monitoring of the modules and changing the configurations. The internal network consists of three LAN divisions namely an End User Network, a restricted Admin Network, and a Finance Network. A Virtual Private Network(VPN) is employed for managing the group of employees working away from the company. The Cisco ASA is used to manage the VPN. A wireless access point is also provided to facilitate services to the visitors of the company. The DMZ hosts a group of server machines such as a Mail Server, Payment Gateway Server, SAN Server, AD Server, and a Web Server. The SAMM and inverter are allowed to be accessed from the Internet as the vendor needs to login and verify the functional status and efficiency from time to time. Both the units are connected to the Building Management Console(BMC) which can be controlled from the internal network of the organization. In the internal network, there is no restriction for communication between any LAN user networks and internal services network which hosts the File and Print server. A user in the admin network is allowed to communicate with DMZ, which hosts the payment gateway server. Wireless network users have access to the File and Print server. However, access restrictions are in place between the DMZ network and internal services network. Furthermore, the web server and the mail server belong to the same network and no network access restrictions are in place between them. The VPN users login to the network using their VPN login credentials and are VOLUME 6, 2018
G. George, S. M. Thampi: Graph-Based Security Framework for Securing IIoT Networks
TABLE 3. List of vulnerabilities in example network .
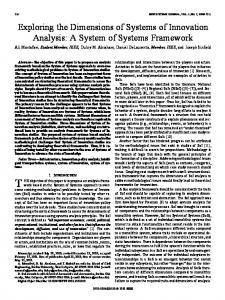
assigned IP addresses from the VPN IP pool. The VPN users have access to the File and Print server. Network access is permitted between the File and Print server and the industrial control network via the WAN network. There can be many vulnerabilities present in various devices of this IIoT network. The details of vulnerabilities considered for this example and their normalised base score are listed in Table 3. Let the sink node be identified as the SCADA server system. The password vulnerability (CVE-2010-2772) on the SCADA server system can be exploited via the File and Print server to compromise and control the plant systems, causing serious infrastructure and financial losses. Moreover, a false feedback may be sent to the controllers so that the attack is not detected until the damage is done. There are many possible attack scenarios in this network connecting different vulnerabilities. A few attack scenarios reaching the SCADA system are presented. As the SCADA system can be accessed only through the File and Print server in the example considered, only the paths from attacker towards File and Print server are illustrated here. The attacker exploits the firmware vulnerability (CVE-2017-9861) in the SAMM and compromises it, granting access to the local operating system. The attacker can use this access to pivot into the internal network of the industrial enterprise. The attacker further compromises the Building Management System(BMS) in the network by exploiting the vulnerability (CVE-2012-4701). This provides access to key BMS features including disabling alarms, beacons, disabling access control, open building access doors including that of data-centers and key restrictive areas, controlling fire alarms and controlling building power. Further, the attacker exploits the vulnerability (CVE-2013-0640) in the LAN user machine to obtain limited privilege in the machine. The attacker then exploits a privilege escalation vulnerability (CVE-2017-11783) to gain local admin privilege on the same machine. The attacker uses the directory traversal vulnerability (CVE-2008-0405) to access the unauthorized files in the File and Print Server. In another possible attack, the attacker exploits the vulnerability (CVE-2017-9859) in the inverter unit of the building power management and then exploits the vulnerability (CVE-2012-4701) in the BMC. The attacker further obtains admin privilege in the LAN user system by sequential exploitation of the vulnerabilities VOLUME 6, 2018
FIGURE 4. Exploitable IIoT network graph of example industrial network.
(CVE-2013-0640) and (CVE-2017-11783), as discussed before. An attack is further launched into the Payment Gateway Server through the vulnerability (CVE-2015-0079). The attacker can further advance to the Mail Server through the internal mail relay vulnerability (CVE-2002-1278). The attacker proceeds with launching a cross cite script vulnerability (CVE-2002-1278) in CISCO ASA to create a new VPN user in the VPN server. The attacker can use this VPN login credentials to connect through VPN to access the File and Print Server in the network. The unauthorized files in the File and Print Server can be accessed by exploiting the directory traversal vulnerability (CVE-2008-0405). The Exploitable IIoT Network Graph representing all possible attack paths are shown in Fig 4. The nodes are assigned with identifiers as denoted in Table 3. The source node and sink node are designated with node identifiers 0 and 11 respectively. The list of the attack paths from the source node to sink node and security parameters associated with each of these paths can be found using the function GETPATHS1 described in the section III-C1. The paths and associated parameters are listed in Table 4. The security parameters of the IIoT network is evaluated and are given in Table 5. The security parameters of the network provides information about the overall security of the network. The security administrator can implement the proposed risk mitigation strategies and further evaluate the security parameters of the network so as to get a measure of improvement in the overall security.
B. PERFORMANCE OF RISK MITIGATION STRATEGIES
The changing dynamics of the IIoT network result in the addition or removal of new devices in the network. As this 43597
G. George, S. M. Thampi: Graph-Based Security Framework for Securing IIoT Networks
TABLE 4. List of paths and parameters.
TABLE 5. Security parameters. FIGURE 6. Performance of threat-based strategy with variation of number of edges.
FIGURE 7. Performance of threat based strategy with variation in threat-threshold.
FIGURE 5. Performance of threat-based strategy with variation of number of nodes.
can lead to addition or removal of vulnerabilities, Exploitable IIoT Network Graph changes its size and structure from time to time. Hence, for a comprehensive performance evaluation, the algorithms are to be run over many graphs with different structures and sizes. In such cases, synthetic graphs are commonly used [18] for the simulation purpose. As our model of the Exploitable IIoT Network Graph is the first of its kind, and as algorithms for risk mitigation run on this graph, other algorithms are unavailable for comparison of performance. In this section, we present certain performance parameters of our algorithms with respect to the changing dynamics of the IIoT network. To analyze the performance of the algorithms, synthetic graphs with required number of nodes and edges are generated. The number of attackers and targets are taken as 2 each. For the threat-threshold based strategy, the change in 43598
number of paths to be removed against varying number of nodes in the graph for a fixed edge size of 100 and threatthreshold of 0.1 is plotted in Fig 5. We can observe that the number of paths to be removed decreases as the number of nodes increases. This is because as more number of nodes are introduced into the graph, the chances for more nodes getting included in attack paths increase, effectively reducing the cumulative threat value of the path as the edge weights are between 0 and 1. The change in the number of paths to be removed with respect to the increase in the number of edges of the graph for a fixed node size of 35 and threatthreshold of 0.1 is plotted in Fig 6. It is easy to understand that increasing the number of edges in a graph with fixed number of nodes results in an increase in the number of attack paths, many of which may have a cumulative threat greater than that of the threat-threshold. Hence, we see an increase in number of paths to be removed with an increment in the number of edges for a fixed number of nodes and for a fixed threat-threshold. Furthermore, the sensitivity of the algorithm to the changes in the threat-threshold is analyzed in Fig 7 for VOLUME 6, 2018
G. George, S. M. Thampi: Graph-Based Security Framework for Securing IIoT Networks
FIGURE 8. Performance of hop-based strategy with variation in number of nodes.
FIGURE 9. Performance of hop-based strategy with variation in number of edges.
a node size of 35 and edge size of 100 in the graph. It can be seen that as the threat-threshold increases, less number of paths are to be removed from the graph. For the hop based strategy, the variation in the number of paths to be removed with respect to the change in the number of nodes is presented in Fig 8. The edge size and the hopthreshold are kept at 100 and 4 respectively. We observe that the number of paths to be removed decreases as the number of nodes increases. The reason for this is that as more number of nodes are introduced into a graph with a fixed number of edges, the chances for more nodes present in a possible path of attack increase, effectively increasing the number of hops required for that attack and resulting in a decrease in attacks using less number of hops. The variation in number of paths to be removed with an increase in the number of edges for a fixed node size of 35 and hop-threshold of 4 is plotted in Fig 9. We observe an increment in number of paths to be removed with increase in number of edges for fixed number of nodes in the graph. This is because for a graph with a fixed number of nodes, an increase in the number VOLUME 6, 2018
FIGURE 10. Performance of hop-based strategy with variation in hop-threshold.
FIGURE 11. Performance of hot-spot detection technique for varying number of nodes.
of edges results in a more number of attack paths with less number of hops, effectively increasing the number of paths to be removed. The sensitivity of the algorithm to changes in the hop threshold is analyzed in Fig 10. The node size and edge size are kept at 35 and 100 respectively. It is obvious that as the hop-threshold increases, more number of paths are to be removed from the graph. This corresponds to the removal of more vulnerabilities from the network and incur more cost. As discussed in III-C4, the cut-off index governs the number of hot-spots in the network. The higher the cut-off index, the more will be the number of nodes classified as hot-spots in the network. The variation in the number of hot-spots detected against varying number of edges in the graph is plotted for different values of the cut-off index in Fig 11. Synthetic graphs of edge size 200 and node size varying from 100 to 150 are generated. The cut-off index is varied from 4 to 7. It is easy to understand that for a given number of nodes of the graph, the number of hot-spots detected decreases as the cut-off index increases. Furthermore, it can also be observed that for a given cut-off index the number of hot-spots detected 43599
G. George, S. M. Thampi: Graph-Based Security Framework for Securing IIoT Networks
FIGURE 12. Performance of hot-spot detection technique for varying number of edges.
increases as the number of nodes of the graph increases. This is because as the number of nodes of the graph increases with a fixed edge size, the number of edges associated with a single node decreases, effectively bringing down the hot-spot index of each node. Similarly variation in the number of hot-spots detected against varying number of edges of the graph is plotted for different values of the cut-off index in Fig 12. Graphs with 120 nodes and edges varying from 200 to 250 are generated. In this case also, the cut-off index is varied from 4 to 7. As is obvious, it can be seen that the number of hot-spots detected decreases with an increase in the cut-off index for a fixed number of edges in the graph. Moreover, as the number of edges of the graph increases with a fixed node size, more number of edges are associated with each node, and hence the number of the hot-spots detected increases. The sensitivity of the system to changing cut-off index for a graph with 120 nodes and 220 edges is plotted in Fig 13. As is obvious, it is observed that as the cut-off index increases, the detected number of hot-spots decreases. As discussed in section I, the security administrator has to work within the constraints of IIoT networks, such as unavailability of patches for many vulnerabilities, adhoc nature of connectivity and cost of patching of the vulnerabilities. The risk mitigation strategies discussed above, proposes to find the number of vulnerabilities to be healed so as to achieve the envisaged security improvement in the IIoT network. The number of vulnerabilities to be healed, depends on the values set for threat-threshold, hop-threshold and cut-off index. Setting these parameters to the extreme values may lead to healing of too many number of vulnerabilities in the network, which may not be possible within the constraints of IIoT network. Moreover, the cost modeling associated with the patching of vulnerabilities is highly contextual and widely accepted standards are unavailable. Hence, the security administrator has to set these threshold values in such a way to find an optimal set of vulnerabilities to be healed, without violating 43600
FIGURE 13. Performance of hot-spot detection technique for varying cut-off indices.
the constraints of the specific IIoT network. The security administrator can evaluate hardening options by varying the threshold values to find optimum number of vulnerabilities to be healed. Thus, the proposed system empowers the security administrator to arrive at optimal threshold values. V. CONCLUSION AND FUTURE WORK
In this work, a graph based security framework is discussed for securing the IIoT network from vulnerabilities residing in the network devices. The critical parameters that represent different security-relevant information about the network are derived from this graph. Risk mitigation strategies are proposed on the graph to reduce the overall threat level in the network. The model and the techniques proposed enable a security administrator to visualize the threat levels posed by the vulnerabilities existing in the network. The framework also provides an optimization platform for the security administrator to find the optimum threshold values corresponding to the threat, hop and hot-spot index within the constraints of the IIoT network. The options provided by the proposed risk mitigation strategies helps the administrator to choose viable solutions for security improvement. The proposed techniques pave the way for a safer IIoT environment. The framework can be improved by incorporating cost models for hardening of the vulnerabilities in the network. However, widely accepted standard for cost modeling are currently unavailable even though a few works have proposed their-own mechanism for the cost calculation. The feasibility of a standard cost modeling for the patching of vulnerabilities can be investigated and incorporated into the framework to find the optimal threshold values corresponding to the threat, hop and hot-spot index. REFERENCES [1] L. Da Xu, W. He, and S. Li, ‘‘Internet of Things in industries: A survey,’’ IEEE Trans. Ind. Informat., vol. 10, no. 4, pp. 2233–2243, Nov. 2014. [2] Z. Pang, Q. Chen, J. Tian, L. Zheng, and E. Dubrova, ‘‘Ecosystem analysis in the design of open platform-based in-home healthcare terminals towards the Internet-of-Things,’’ in Proc. 15th Int. Conf. Adv. Commun. Technol. (ICACT), Jan. 2013, pp. 529–534. VOLUME 6, 2018
G. George, S. M. Thampi: Graph-Based Security Framework for Securing IIoT Networks
[3] Z. Pang, Q. Chen, W. Han, and L. Zheng, ‘‘Value-centric design of the Internet-of-Things solution for food supply chain: Value creation, sensor portfolio and information fusion,’’ Inf. Syst. Frontiers, vol. 17, no. 2, pp. 289–319, 2015. [4] B. Karakostas, ‘‘A DNS architecture for the Internet of Things: A case study in transport logistics,’’ Procedia Comput. Sci., vol. 19, pp. 594–601, Jan. 2013. [5] C. Long, Y. Cao, T. Jiang, and Q. Zhang, ‘‘Edge computing framework for cooperative video processing in multimedia IoT systems,’’ IEEE Trans. Multimedia, vol. 20, no. 5, pp. 1126–1139, May 2018. [6] Y. Saleem, N. Crespi, M. H. Rehmani, and R. Copeland. (2017). ‘‘Internet of Things-aided smart grid: Technologies, architectures, applications, prototypes, and future research directions.’’ [Online]. Available: https:// arxiv.org/abs/1704.08977 [7] W. Qiuping, Z. Shunbing, and D. Chunquan, ‘‘Study on key technologies of Internet of Things perceiving mine,’’ Procedia Eng., vol. 26, pp. 2326–2333, Jan. 2011. [8] J.-Y. Keller and D. Sauter, ‘‘Monitoring of stealthy attack in networked control systems,’’ in Proc. Conf. Control Fault-Tolerant Syst. (SysTol), Oct. 2013, pp. 462–467. [9] R. M. Lee, M. J. Assante, and T. Conway, ‘‘German steel mill cyber attack,’’ Ind. Control Syst., vol. 30, pp. 1–5, Dec. 2014. [10] J. Leyden, ‘‘Hack on saudi aramco hit 30,000 workstations, oil firm admits,’’ The Register, Aug. 29, 2012. [11] C. Kolias, G. Kambourakis, A. Stavrou, and J. Voas, ‘‘DDoS in the IoT: Mirai and other botnets,’’ Computer, vol. 50, no. 7, pp. 80–84, 2017. [12] K Lab. Industrial Enterprise and IoT Security Threats: Forecast for 2018. Accessed: May 21, 2018. [Online]. Available: https://icscert.kaspersky.com [13] M. Antonakakis et al., ‘‘Understanding the mirai botnet,’’ in Proc. USENIX Secur. Symp., 2017, pp. 1092–1110. [14] T. Yu, V. Sekar, S. Seshan, Y. Agarwal, and C. Xu, ‘‘Handling a trillion (unfixable) flaws on a billion devices: Rethinking network security for the Internet-of-Things,’’ in Proc. 14th ACM Workshop Hot Topics Netw., 2015, p. 5. [15] H. Wang, Z. Chen, J. Zhao, X. Di, and D. Liu, ‘‘A vulnerability assessment method in industrial Internet of Things based on attack graph and maximum flow,’’ IEEE Access, vol. 6, pp. 8599–8609, 2018. [16] A. K. Simpson, F. Roesner, and T. Kohno, ‘‘Securing vulnerable home iot devices with an in-hub security manager,’’ in Proc. IEEE Int. Conf. Pervasive Comput. Commun. Workshops (PerCom Workshops), Mar. 2017, pp. 551–556. [17] N. Poolsappasit, R. Dewri, and I. Ray, ‘‘Dynamic security risk management using Bayesian attack graphs,’’ IEEE Trans. Dependable Secure Comput., vol. 9, no. 1, pp. 61–74, Jan. 2012. [18] L. Munoz-González, D. Sgandurra, M. Barrere, and E. Lupu, ‘‘Exact inference techniques for the analysis of Bayesian attack graphs,’’ IEEE Trans. Dependable Secure Comput., to be published, doi: 10.1109/TDSC.2016.2627033. [19] P. Mell, K. Scarfone, and S. Romanosky. (2011). Common Vulnerability Scoring System (CVSS). [Online]. Available: http://www.first. org/cvss/cvss-guide.html [20] National Vulnerability Database (NVD). Accessed: May 10, 2018. [Online]. Available: https://nvd.nist.gov/ [21] C.-W. Ten, C.-C. Liu, and M. Govindarasu, ‘‘Vulnerability assessment of cybersecurity for scada systems using attack trees,’’ in Proc. IEEE Power Eng. Soc. Gen. Meeting, Jun. 2007, pp. 1–8. [22] S. Patel and J. Zaveri, ‘‘A risk-assessment model for cyber attacks on information systems,’’ J. Comput., vol. 5, no. 3, pp. 352–359, 2010. [23] M. H. Henry and Y. Y. Haimes, ‘‘A comprehensive network security risk model for process control networks,’’ Risk Anal., Int. J., vol. 29, no. 2, pp. 223–248, 2009. [24] J. Guan, J. H. Graham, and J. L. Hieb, ‘‘A digraph model for risk identification and mangement in SCADA systems,’’ in Proc. IEEE Int. Conf. Intell. Secur. Inform. (ISI), Jul. 2011, pp. 150–155. [25] S. Kriaa, M. Bouissou, and L. Piètre-Cambacédès, ‘‘Modeling the Stuxnet attack with BDMP: Towards more formal risk assessments,’’ in Proc. 7th Int. Conf. Risk Secur. Internet Syst. (CRiSIS), Oct. 2012, pp. 1–8. [26] R. Hewett, S. Rudrapattana, and P. Kijsanayothin, ‘‘Cyber-security analysis of smart grid SCADA systems with game models,’’ in Proc. 9th Annu. Cybern. Inf. Secur. Res. Conf., 2014, pp. 109–112. [27] Y. Cherdantseva et al., ‘‘A review of cyber security risk assessment methods for SCADA systems,’’ Comput. Secur., vol. 56, pp. 1–27, Feb. 2015. VOLUME 6, 2018
[28] U. P. D. Ani, H. He, and A. Tiwari, ‘‘Review of cybersecurity issues in industrial critical infrastructure: Manufacturing in perspective,’’ J. Cybern. Secur. Technol., vol. 1, no. 1, pp. 32–74, 2017. [29] Y. Yang, L. Wu, G. Yin, L. Li, and H. Zhao, ‘‘A survey on security and privacy issues in Internet-of-Things,’’ IEEE Internet Things J., vol. 4, no. 5, pp. 1250–1258, Oct. 2017. [30] J. Granjal, E. Monteiro, and J. S. Silva, ‘‘Security for the Internet of Things: A survey of existing protocols and open research issues,’’ IEEE Commun. Surveys Tuts., vol. 17, no. 3, pp. 1294–1312, Aug. 2015. [31] M. U. Farooq, M. Waseem, A. Khairi, and S. Mazhar, ‘‘A critical analysis on the security concerns of Internet of Things (IoT),’’ Int. J. Comput. Appl., vol. 111, no. 7, pp. 1–6, 2015. [32] J. S. Kumar and D. R. Patel, ‘‘A survey on Internet of Things: Security and privacy issues,’’ Int. J. Comput. Appl., vol. 90, no. 11, pp. 20–26, 2014. [33] Accessed: May 12, 2018. [Online]. Available: https://www.shodan.io/ [34] H. Al-Alami, A. Hadi, and H. Al-Bahadili, ‘‘Vulnerability scanning of IoT devices in Jordan using Shodan,’’ in Proc. 2nd Int. Conf. Appl. Inf. Technol. Develop. Renew. Energy Process. Syst. (IT-DREPS), Dec. 2017, pp. 1–6. [35] J. Romero-Mariona, R. Hallman, M. Kline, J. San Miguel, M. Major, and L. Kerr, ‘‘Security in the industrial Internet of Things-the C-sec approach,’’ in Proc. Int. Conf. Internet Things Big Data, vol. 1, 2016, pp. 421–428. [36] M. Ge, J. B. Hong, W. Guttmann, and D. S. Kim, ‘‘A framework for automating security analysis of the Internet of Things,’’ J. Netw. Comput. Appl., vol. 83, pp. 12–27, Apr. 2017. [37] L. Wang, T. Islam, T. Long, A. Singhal, and S. Jajodia, ‘‘An attack graphbased probabilistic security metric,’’ in Proc. IFIP Annu. Conf. Data Appl. Secur. Privacy, 2008, pp. 283–296. [38] M. S. Barik, A. Sengupta, and C. Mazumdar, ‘‘Attack graph generation and analysis techniques,’’ Defence Sci. J., vol. 66, p. 559, Nov. 2016. [39] Y. Liu and H. Man, ‘‘Network vulnerability assessment using Bayesian networks,’’ Proc. SPIE, vol. 5812, pp. 61–71, Mar. 2005. [40] M. Frigault, L. Wang, A. Singhal, and S. Jajodia, ‘‘Measuring network security using dynamic Bayesian network,’’ in Proc. 4th Workshop Qual. Protection, 2008, pp. 23–30. [41] P. Ammann, D. Wijesekera, and S. Kaushik, ‘‘Scalable, graph-based network vulnerability analysis,’’ in Proc. 9th Conf. Comput. Commun. Secur., 2002, pp. 217–224.
GEMINI GEORGE received the B.Tech. and M.Tech. degrees in computer science and engineering from Mahatma Gandhi University, India. She is currently pursuing the Ph.D. degree with the Indian Institute of Information Technology and Management-Kerala, India. Her current research interests include Internet of Things, network security, and vulnerability analysis. She is a recipient of recognition as the Women Scientist from the Department of Science and Technology, Government of India.
SABU M. THAMPI (SM’10) received the Ph.D. degree in computer engineering from the National Institute of Technology Karnataka, India. He is currently an Associate Professor with the Indian Institute of Information Technology and Management-Kerala, India. He has authored few books published by reputed international publishers. His research interests include sensor networks, IoT, authorship analysis, social networks, nature inspired computing, and video surveillance. He is a member of the IEEE Communications Society, the IEEE SMCS, and the ACM. He has served as an Editor for a few international journals and also a Program Committee Member for many international conferences and workshops.
43601