A Graphical and Open Source Matlab-GAMS interface for Electricity Market Models Federico Milano Departamento de Ingenier´ıa El´ectrica, Electr´onica y Autom´atica E.T.S.I.I., Universidad de Castilla-La Mancha Campus de Ciudad Real, 13071 Ciudad Real (Espan˜ a) Tel: +34 926 295 219, fax: 926 295 361, e-mail:
[email protected]
This paper describes the PSAT-GAMS interface to solve a variety of optimization models. The Power System Analysis Toolbox (PSAT) is an open source Matlab-based software package for analysis and design of small to medium size electric power systems. While the General Algebraic Modeling System (GAMS) is a high-level modeling system for mathematical programing problems. It consists of a language compiler and a variety of integrated high-performance solvers. A bridge between GAMS and Matlab allows using sophisticated nonlinear optimization tools with the visualization tools provided by Matlab. Examples based on a didactic 3-bus test system and the RTS-96 24-bus system are presented to illustrate the capabilities of the interface.
Abstract.
Keywords
ented to (under)graduate students and researchers in the field of electricity markets and power system analysis. PSAT is a Matlab toolbox for electric power system analysis and control [7]. PSAT includes power flow, continuation power flow, optimal power flow, small signal stability analysis and time domain simulation. All operations can be assessed by means of graphical user interfaces (GUIs) and a Simulink-based library provides an userfriendly tool for network design. One of the key point of PSAT is that it is completely open source and free. This allows exchanging ideas and effectively improving scientific research [8]. At this aim, the command line version of PSAT can run on GNU/Octave [9], which is a free Matlab clone.
In recent years, the increasing interest for competitive and secure electricity markets and their mathematical exploitations have led to the proposal of a huge variety of market clearing models. This results in a variety of models and mathematical techniques proposed in the literature to take into account diverse market features and behaviors. Recent relevant contributions on this topic are [1], [2], [3], [4], [5], and [6].
In the field of general purpose optimization techniques, one of researchers’ favorite choice is the General Algebraic Modeling System (GAMS) [10]. GAMS is a highlevel modeling system for mathematical programming problems. It consists of a language compiler and a variety of integrated high-performance solvers. GAMS is specifically designed for large and complex scale problems, and allows creating and maintaining models for a wide variety of applications and disciplines [10]. GAMS is able to formulate models in many different types of problem classes, such as linear programming (LP), nonlinear programming (NLP), mixed-integer linear programming (MILP) and (relaxed) mixed-integer nonlinear programming (MINLP).
In order to develop and fast prototype new market clearing models there is the need of a versatile software tool which is able to combine powerful optimization solvers and a power system dedicated software. This paper describes a novel open-source software tool, namely the PSAT-GAMS interface, for solving market clearing problems as well as stability constrained optimal power flows. The proposed program is suited for the analysis of small to realistic size electric power systems and is ori-
The paper is organized as follows. Firstly the main features of PSAT are illustrated in Section 2. Section 3 gives the outlines of the PSAT-GAMS interface while Section 4 gives a brief insight on the mathematical models currently implemented in the PSAT-GAMS interface. Section 5 depicts a variety of examples based on a didactic 3-bus test system and the RTS-96 test system [11]. Finally Section 6 summarizes the main contributions of this paper.
Electricity markets, optimal power flow, linear programming, nonlinear programming, Matlab, GAMS.
1. Introduction
2. PSAT Outlines PSAT is a well documented Matlab-based software for power system analysis and is aimed to researchers and power system (under)graduated students [7], [12]. The program is provided with a complete set of power system models and algorithms for static and dynamic analysis. Furthermore PSAT is modular and open-source, so that users can easily develop new models and algorithms and extend PSAT capabilities. The synoptic scheme of PSAT is depicted in Fig. 1. Observe that the PSAT kernel is the power flow algorithm, which also takes care of the initialization of dynamic models. The user has to solve the power flow first, then one can perform further static and/or dynamic analysis. These are: 1)
Continuation Power Flow (CPF);
2)
Optimal Power Flow (OPF);
3)
Small signal stability analysis;
4)
Time domain simulations. Simulink Models
Input
Other Data Format
In order to perform accurate and complete power system analyses, PSAT supports a variety of static and dynamic models, including non conventional loads, synchronous machines and controls, regulating transformers, FACTS, wind turbines, and fuel cells [12]. Besides mathematical algorithms and models, PSAT includes a variety of additional tools, such as data file conversion to and from other formats; user defined model editor and installer; and command line usage. Observe that command line usage allows running PSAT on GNU/Octave. PSAT has been thought as an educational tool. At this aim, PSAT is provided with a complete graphical user interface (GUI). For example Fig. 2 illustrates the main PSAT window, from which the user can launch all algorithms and procedures. Furthermore, PSAT allows drawing one-line electrical diagrams by means of pictorial blocks. Fig. 3 depicts the complete PSAT-Simulink library (see also Figs. 6 and 12 which illustrate the 3-bus and the RTS-96 24-bus test systems, respectively).
Saved Results
Data Files Simulink Library
PSfrag replacements
Simulink Model Conversion
Settings
Interfaces GAMS
UWpflow
PSAT
Conversion Utilities
Power Flow & State Variable Initialization
User Defined Models
Static Analysis
Dynamic Analysis
Optimal Power Flow
Small Signal Stability
Continuation Power Flow
Time Domain Simulation
Command History
Fig. 2. Main graphical user interface of PSAT.
Plotting Utilities
PMU Placement Output
Text Output
Save Results
Graphic Output
Fig. 1. Synoptic scheme of PSAT.
An important feature of PSAT is the fully exploitation of Matlab vectorized computations and sparse matrix functions. This allows optimizing performances. Furthermore PSAT is provided with the most complete set of algorithms for static and dynamic analyses among currently available Matlab-based power system softwares [7].
The PSAT computational engine is purely Matlab-based and the Simulink environment is used only as graphical tool. As a matter of fact, Simulink models are read by PSAT to exploit network topology and extract component data. A byproduct of this approach is that PSAT can run on GNU/Octave, which is currently not providing a Simulink clone. Observe that some Simulink-based tools, such as PAT [13] and EST [14], use Simulink to simplify the design of new control schemes. This is not possible in PSAT. However, PAT and EST do not allow representing the network topology, thus resulting in a lower readability of the whole system.
Fig. 3. PSAT Simulink library. Fig. 5. GUI of the PSAT-GAMS interface.
3. PSAT-GAMS Interface Figure 4 depicts the scheme of the PSAT-GAMS interface. The resulting software is a rather innovative tool able to set up large scale power system test cases, solve complex OPF problems and finally visualize results by means of a user-friendly GUI which is depicted in Fig. 5. The GUI allows selecting the market clearing model, setting model parameters (please see Section 4 for details on market clearing models), and displaying GAMS results. An existing Matlab-GAMS Interface [15] has been used as the main reference for creating the PSAT-GAMS Interface (PGI). However, the PGI has been completely rewritten and optimized for the use within the PSAT environment. Main novelties of the PGI with respect to the interface presented in [15] are as follows: Network &
Graphic Visualization
PSAT
Market Data
Tools
PSfrag replacements
PSAT-GAMS Interface Matlab Workspace Input Data GAMS Environment
Market Solution
M ATLAB-GAMS Interface
psatglobs.gms psatdata.gms
GAMS Library
fm gams.m
psatsol.m
GAMS
psatout.gms
Fig. 4. Structure of the PSAT-GAMS interface.
OPF GAMS Model
1)
PGI is platform independent. This feature improve portability and in turn the development of the interface.
2)
PGI comes with a complete GUI.
3)
PGI does not require the user to know anything about Matlab and/or GAMS programming language. This is useful for educational purposes.
Before the interface can be used, one has to create data file describing the system. At this aim the user can use the PSAT-Simulink interface and draw the on-line diagram of the network or load a predefined test network which is provided within the PSAT main distribution. The second step is solving the power flow. At this point, the PSAT-GAMS interface can be opened and the GAMS solvers launched. Observe that only networks for which market data have been defined can be used with the PSAT-GAMS interface. If no market data has been defined, the interface simply terminates with a warning message. The interface works as follows: the system information are “translated” into a GAMS file (psatdata.gms). User settings (e.g. the market clearing model) and global variables (e.g. the number of bus) are also written to a GAMS script file (psatglobs.gms). The advantage of writing data files is that one could use PSAT to export the GAMS data, and then use GAMS from scripting without the use of Matlab. This feature can be useful in case of “heavy” applications, where all computer resource are needed. Once the data files have been written, GAMS is launched from within Matlab and the market clearing procedure solved. The routines (fm gams.gms) for solving the
market clearing problems have been designed to be as general as possible, with no limit in the network size or in the number of market participants. Limits are only the computer memory and GAMS solvers’ capabilities. Finally, when the GAMS solver has terminated, the GAMS output (psatsol.m) is passed back to Matlab, so that GAMS results can be displayed using the graphical capabilities of Matlab or used for further analyses using PSAT routines.
4. Market Clearing Models The current version of the PGI is provided with five optimization problems, namely simple auction, simplified market clearing mechanism, standard OPF, voltage stability constrained (VSC)-OPF and maximization of the maximum loading condition. A brief description of these models is presented in the following subsections. A. General single-period optimization model The general optimization problem which is implemented in the PSAT-GAMS interface can be represented as a nonlinear programming model, as follows: Maximize(x,p,ˆx,λ) subject to
f (p, λ)
(1)
g(x, p) = 0 gˆ(ˆ x, p, λ) = 0 λmin ≤ λ λ ≤ λmax hmin ≤ h(x, p) h(x, p) ≤ hmax ˆ min ≤ h(ˆ h x, p) ˆ max h(ˆ x, p) ≤ h pmin ≤ p p ≤ pmax
where x, x ˆ ∈ Rn are the dependent variables, such as bus voltage phasors, p ∈ Rm are the control variables, i.e. power demand and supply bids PD and PS , respectively, and λ ∈ R is loading parameter. The functions f : Rm 7→ R, g, gˆ : Rn × Rm 7→ Rn , and ˆ : Rn 7→ R` are defined as follows: h, h A.1. Objective function For pure market clearing problems, the objective function f is defined as follows: X X f= CDi (PDi ) − (2) CSi (PSi ) i
i
Equation (2) represents consumer surplus plus the producer surplus (i.e. the net social welfare). It is computed
as the difference of two terms. The first term is the sum of accepted demand bids PDi times their corresponding bid prices CDi in $/MWh. (In the case of inelastic demand, demand powers PD are known, which can be represented in (2) by setting CD = 0.) The second term is the sum of accepted production bids PSi times their corresponding bid prices CSi in $/MWh. Observe that (2) is linear for simple auction and market clearing procedure, while is assumed to be a quadratic expression for OPF-based problems. For the voltage stability constrained problem, the objective function includes the maximization of the loading parameter λ, as it was proposed in [6]: f = ω(
X
(CDi (PDi ) −
X
i
CSi (PSi )) + (1 − ω)λ (3)
i
In (3), two terms are present, with their influence on the final solution being determined by the value of the weighting factor ω (0 < ω < 1). The first term represents the social welfare, whereas the second term guarantees that the “distance” between the market solution and the critical point is maximized [6]. Observe that ω > 0, since for ω = 0 there would be no representation of the market in the proposed OPF formulation, rendering it useless. Furthermore, ω < 1, otherwise λ will not necessarily correspond to a maximum loading condition of the system. Finally, for the maximum loading condition problem, one has: f =λ
(4)
which leads to a pure security problem with no market involved [16]. This lead to get the maximum loading condition of the system. It is important to stress the fact that the maximum value for λ can be associated with thermal or bus voltage limits, or a voltage stability limit due to a singularity of the power flow Jacobian (saddle-node bifurcation) or a controller limit such as a generator reactive power limit (limit-induced bifurcation). A.2. Equality constraints The equations g represents the standard power flow equations: g(x, p) = g(θ, V, kG , PS , PD ) = 0
(5)
where x = (θ, V, kG ) and p = (PS , PD ). The variables θ and V are the bus voltage phases and magnitudes, respectively, while kG is a scalar variable used to represent system losses through a unique or distributed slack bus. Observe that x represents the set of dependent variables to be optimized, i.e. x ∈ Rn . Generator reactive powers
QG are not included in this set and are expressed as a function of x and p. The generator and load powers are defined as follows: PG
=
P G0 + P S
PL
=
P L0 + P D
(6)
where PG0 and PL0 stand for generator and load powers which are not part of the market trading (e.g. must-run generators, inelastic loads). Loads are assumed to have constant power factor, thus: (7)
QL = PL tan(φL )
For the simple auction problem, g reduce to a lossless power balance, as follows: X X (8) (PL0i + PDi ) = 0 (PG0i + PSi ) − i
i
while in the simplified market clearing procedure losses are taken into account through a simplified quadratic expression: X (PG0i + PSi ) (9) X
i
(PL0i + PDi ) − θ T Gθ
=
0
PS + PG0 − PD − PL0 − Bθ
=
0
−
i
where G and B are the network susceptance and conductance matrices, respectively. A.3. Inequality constraints In (1), the set of inequality constraints has been split into h, which represent the physical and security limits of the system, and the bid blocks for control variables p. The physical and security limits considered in this paper are similar to what is used in [17], and take into account transmission line thermal limits: Iij (θ, V ) ≤ Iijmax Iji (θ, V ) ≤ Iijmax
(10)
generator reactive power limits: QGmin ≤ QG (x, p) ≤ QGmax
PSmin ≤ PS ≤ PSmax PDmin ≤ PD ≤ PDmax
(14)
B. Maximum loading condition constraints The second set of power flow variables x ˆ ∈ Rn and equations gˆ : Rn × Rm × R 7→ Rn , together with their associated constraints h(ˆ x) : Rn 7→ R` , are introduced to represent the solution associated with a loading parameter λ, where λ represents an increase in generator and load powers, as follows: PˆG PˆL
= =
(1 + λ + kˆG )PG (1 + λ)PL
(15)
In (15), the scalar variable kˆG allocates losses, assuming a distributed slack bus model. If using the maximum loading condition constraints, (1) is similar to the optimization problems which were proposed in [16] and [6]. It is assumed that (1) has a solution for λ = 0, i.e. the base loading conditions do not exceed the maximum system loading. Observe that for the maximum loading conˆ are used, while g and h are dition problem, only gˆ and h neglected. Boundaries for the loading margin λ have been included in (1) based on practical considerations. The minimum limit λmin is introduced in order to ensure a minimum level of security in any operating condition, where the maximum value λmax imposes a maximum required security level. These conditions ensure that the loading parameter remains within certain limits to avoid solutions of (1) characterized by either low security levels (λ < λmin ) or low supply and demand levels (λ > λmax ), which would be unacceptable [6]. Observe also that one can set λmax = λmin , thus fixing a desired value of the loading parameter.
5. Case Studies (12)
and power limits on transmission lines: |Pij | ≤ Pij max
The limits in p are represented as follows:
(11)
voltage “security” limits: Vmin ≤ V ≤ Vmax
which are used to represent stability boundaries of the system [17]. Observe that (13) are typically “conservative” and can in general lead to low transaction levels, higher costs and lower security margins as shown in [6]. The user can decide if including or not these limits. Thus, h = [Iij , Iji , QG , V, Pij ].
(13)
In this section, a simple 3-bus test system and the RTS-96 24-bus test system [11] will be used for illustrating how PSAT and the PSAT-GAMS interface work. Authors interested in reproducing the outputs could retrieve the data from the PSAT web site [12]).
PSfrag replacements
Figure 6 depicts the 3-bus test system as obtained using the PSAT-Simulink library. Each pictorial block of the diagram hides a mask where the user can set up the data associated with the correspondent component. Thus, the user can easily draw the one-line diagram and filling up the block masks to set up system data. If no data are set, default block parameters will be used.
GENCO 1
GENCO 3
GENCO 2 ESCO 2
Bus 1
Bus 3
Bus 2
ESCO 3
Fig. 6. PSAT-Simulink model of the three-bus example.
Once the model is completed, it has to be loaded in the Matlab workspace. While loading the Simulink data, PSAT takes care of the conversion into a Matlab script file in which each component is defined by means of matrices. Figure 7 represents the data file as results from the conversion of the Simulink model. Observe that this file can be easily read by Matlab, but is cannot be recognized by GAMS. Furthermore, line data are in the form of π model, while the admittance matrix elements should be passed to the GAMS optimization routines. Next step is solving the power flow from within PSAT. Once the power flow analysis has been completed successfully, the information that can be obtained is twofold. Firstly, the set of input data is “good” as it led to a power flow solution. Secondly, PSAT has internally completed all base changes and built the admittance and Jacobian matrices need during the power flow solution method. Observe that all variables, data and results are stored as global structures in the Matlab workspace so that they are available for other routines and can be displayed at any time on the Matlab workspace. At this point the PSAT-GAMS interface can be open, parameters and settings can be adjusted and the GAMS routine can be launched. Figures 8, 9, and 10 depict the input and output files which are used for exchanging data between PSAT and GAMS. Observe that the data input for the GAMS routine is a plain text file which is much less clear and “user friendly” than the Simulink one-line diagram of Fig. 6. As a results of the PSAT-GAMS interface operations, on the Matlab workspace will displays the output depicted in Fig. 11. Furthermore, the GAMS solution is stored in the PSAT global structures and is available for further analysis.
Bus.con = [ ... 1 138 1 0 2 138 1 0 3 138 1 0 Line.con = [ ... 1 3 100 138 1 2 100 138 2 3 100 138
2 3 4
1; 1; 1 ];
60 60 60
Shunt.con = [ ... 3 100 400 60 0 2 100 400 60 0
0 0 0 0 0 0
0.01 0.01 0.01
0.12 0.12 0.12
0 0 0
0 0 0
1.5
-1.5
1.1
0 0 0
0 0 0
1.5 1.5 1.5
0; 0; 0 ];
0.5; 0.8 ];
SW.con = [ ... 1 100 138 1.02
0.00
PV.con = [ ... 2 100 400 1.00 3 100 400 1.00
1.00 1.00
1.5 1.5
-1.5 -1.5
1.1 1.1
PQ.con = 3 100 1 100 2 100
0.3 0.8 0.7
1.1 1.1 1.1
0.9 0.9 0.9
1; 1; 1 ];
[ ... 138 0.5 138 1.5 138 1.5
Demand.con = [ ... 2 100 1.5 0.7 1.0 3 100 0.5 0.3 1.0 Supply.con = [ ... 1 100 1.5 1.5 0 2 100 0.8 1.0 0 3 100 0.8 1.0 0
0 0
0 0 0
0 0
0 0 0
0 0
25 33 32
30 35
0 0 0
0 0
0 0 0
0.9 0.9
0 0
0 0 0
0.9
0 0
0 0 0
0 0
0 0 0
1.5
1 ];
1; 1 ];
0 0
0; 0 ];
0; 0; 0 ];
Varname.bus = {... ’Bus1’; ’Bus2’; ’Bus3’};
Fig. 7. 3-bus test system data in PSAT format. $setglobal $setglobal $setglobal $setglobal $setglobal $setglobal $setglobal
nBus ’3’ nLine ’3’ nPs ’3’ nPd ’2’ nBusref ’1’ control ’3’ flow ’1’
Fig. 8. Input file psatglobs.gms for the three-bus test system. $onempty $kill Gh parameter Gh / 1.1 1.379310 2.1 -0.689655 3.1 -0.689655 1.2 -0.689655 2.2 1.379310 3.2 -0.689655 1.3 -0.689655 2.3 -0.689655 3.3 1.379310 /; $kill Bh parameter Bh / 1.1 -16.551724 2.1 8.275862 3.1 8.275862 1.2 8.275862 2.2 -15.751724 3.2 8.275862 1.3 8.275862 2.3 8.275862 3.3 -16.051724 /; $kill Li parameter Li / 1.1 1.000000 2.1 1.000000 3.2 1.000000 /; $kill Lj parameter Lj / 2.2 1.000000 1.3 1.000000 3.3 1.000000 /; $kill Ps_idx parameter Ps_idx / 1.1 1.000000
2.2 1.000000 3.3 1.000000 /; $kill Pd_idx parameter Pd_idx / 2.1 1.000000 3.2 1.000000 /; $kill S parameter S / 1.Ps0 1.500000 2.Ps0 0.800000 3.Ps0 0.800000 1.Psmax 1.500000 2.Psmax 1.000000 3.Psmax 1.000000 1.Cs 25.000000 2.Cs 33.000000 3.Cs 32.000000 /; $kill D parameter D / 1.Pd0 1.500000 2.Pd0 0.500000 1.Pdmax 1.000000 2.Pdmax 1.000000 1.tgphi 0.466667 2.tgphi 0.600000 1.Cd 30.000000 2.Cd 35.000000 /; $kill X parameter X / 1.V0 1.000000 2.V0 1.000000 3.V0 1.000000 1.Pg0 1.502223 2.Pg0 1.000000 3.Pg0 1.000000 1.Qg0 1.143238
2.Qg0 -0.216881 3.Qg0 -0.399686 1.Pl0 1.500000 2.Pl0 1.500000 3.Pl0 0.500000 1.Ql0 0.800000 2.Ql0 0.700000 3.Ql0 0.300000 1.Qgmax 1.500000 2.Qgmax 1.500000 3.Qgmax 1.500000 1.Qgmin -1.500000 2.Qgmin -1.500000 3.Qgmin -1.500000 1.Vmax 1.100000 2.Vmax 1.100000 3.Vmax 1.100000 1.Vmin 0.900000 2.Vmin 0.900000 3.Vmin 0.900000 /; $kill N parameter N / 1.g 0.689655 2.g 0.689655 3.g 0.689655 1.b -8.275862 2.b -8.275862 3.b -8.275862 1.g0 0.689655 2.g0 0.689655 3.g0 0.689655 1.Pijmax 999.000000 2.Pijmax 999.000000 3.Pijmax 999.000000 1.Pjimax 999.000000 2.Pjimax 999.000000 3.Pjimax 999.000000 /; $offempty
Fig. 9. Input file psatdata.gms for the three-bus test system.
IEEE One Area RTS-96
nout = nout + 1; varargout{nout} = zeros(3,1); varargout{nout}(1) = 1.50000E+00; nout = nout + 1; varargout{nout} = zeros(2,1); varargout{nout}(1) = 4.92559E-01; varargout{nout}(2) = 1.00000E+00; nout = nout + 1; varargout{nout} = zeros(3,1); varargout{nout}(1) = 1.10000E+00; varargout{nout}(2) = 1.09589E+00; varargout{nout}(3) = 1.09695E+00; nout = nout + 1; varargout{nout} = zeros(3,1); varargout{nout}(2) =-8.30605E-02; varargout{nout}(3) =-6.65812E-02; nout = nout + 1; varargout{nout} = zeros(3,1); varargout{nout}(1) = 7.97250E-01; varargout{nout}(2) = 4.06715E-02; varargout{nout}(3) = 3.45458E-01; nout = nout + 1;
varargout{nout} = zeros(3,1); varargout{nout}(1) = 2.95867E+01; varargout{nout}(2) = 3.00000E+01; varargout{nout}(3) = 2.99175E+01; nout = nout + 1; varargout{nout} = zeros(3,1); varargout{nout}(1) = 6.07791E-01; varargout{nout}(2) = 7.57890E-01; varargout{nout}(3) = 1.50303E-01; nout = nout + 1; varargout{nout} = zeros(3,1); varargout{nout}(1) = 6.07791E-01; varargout{nout}(2) = 7.57890E-01; varargout{nout}(3) = 1.50303E-01; nout = nout + 1; varargout{nout} = zeros(3,1); varargout{nout}(1) =-5.26614E-01; varargout{nout}(2) =-6.81753E-09; nout = nout + 1; varargout{nout} = zeros(3,1); nout = nout + 1; varargout{nout} = zeros(3,1);
Bus 118
Bus 121 Bus 122 Bus 117
Bus 119
Bus 116
Bus 123
Bus 115
Bus 114
Bus 113
Fig. 10. Output file psatsol.m for the three-bus test system. ----------------------------------------------------------------PSAT-GAMS Interface -----------------------------------------------------------------
Bus 120
Bus 124
Bus 111
Bus 112
PSfrag replacements
Bus 109
Bus 110
Standard OPF Single-Period Auction Bus 103
Power Supplies Bus Ps [MW] 1.0000 150.0000 3.0000 0.0000 2.0000 0.0000
Ps max [MW] 150.0000 100.0000 100.0000
Ps min [MW] 0.0000 0.0000 0.0000
Power Demands Bus 3.0000 2.0000
Pd max [MW] 100.0000 100.0000
Pd min [MW] 0.0000 0.0000
Qg max [MVar] 150.0000 150.0000 150.0000
Qg min [MVar] -150.0000 -150.0000 -150.0000
Bus 106
Bus 104 Bus 108 Bus 105
Pd [MW] 100.0000 49.2559
Generator Reactive Powers Bus Qg [MVar] 1.0000 79.7251 2.0000 4.0672 3.0000 34.5459 Power Flow Solution Bus V theta [p.u.] [rad] 1.0000 1.1000 0.0000 2.0000 1.0959 -0.0831 3.0000 1.0970 -0.0666 Prices and Pays Bus LMP [$/MWh] 1.0000 29.5868 2.0000 30.0000 3.0000 29.9176
PG [MW] 300.2223 100.0000 100.0000
NCP [$/MWh] 0.0000 0.0292 0.0231
PL [MW] 150.0000 199.2559 150.0000
Pay S [$/h] -8882.6037 -3000.0000 -2991.7556
Flows on Transmission Lines From To Iij Iijmax [p.u.] [p.u.] 1.0000 3.0000 0.6078 999.0000 1.0000 2.0000 0.7579 999.0000 2.0000 3.0000 0.1503 999.0000
Margin [p.u.] 998.3922 998.2421 998.8497
Bus 101
Bus 102 Bus 107
Fig. 12. PSAT-Simulink model of the RTS-96 24-bus test system.
QG [MVar] 79.7251 4.0672 34.5459
QL [MVar] 80.0000 92.9861 90.0000
Pay D [$/h] 4438.0139 5977.6770 4487.6335
Iji [p.u.] 0.6078 0.7579 0.1503
Ijimax [p.u.] 999.0000 999.0000 999.0000
Margin [p.u.] 998.3922 998.2421 998.8497
Totals --------------------------------------------------------------Total Losses = 0.966 [MW] Bid Losses = 0.744 [MW] Total demand = 149.2559 [MW] Total Transaction Level = 499.255 [MW] ISO Pay = 28.9638 [$/h] --------------------------------------------------------------Check file ˜\fmilano\psat\fm_gams.lst for GAMS report. PSAT-GAMS Optimization Routine completed in 1.292 s
Fig. 11. PSAT-GAMS OPF report for the three-bus test system.
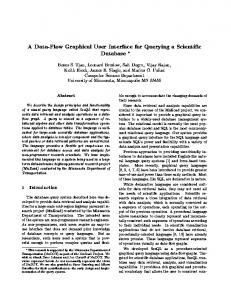
One of the main advantages of Matlab are its advanced graphical features. Thus, the PSAT-GAMS interface provides a bridge in between the sophisticated GAMS solvers and the versatile plotting utilities of Matlab. To illustrate this feature, let us consider the RTS-96 24-bus test system. The 24-bus system as obtained using the PSAT-Simulink library is depicted in Figure 12.
Fig. 13. PSAT GUI for plotting OPF results. The curves represent LMPs for the 24-bus system as a function of the weighting factor ω.
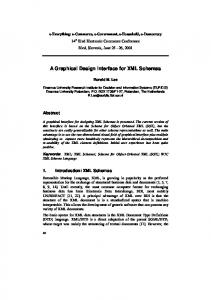
Figures 13 and 14 depict the Locational Marginal Prices (LMPs) and the Total Transaction Level (TTL = ΣPLi ), respectively, as a function of the weighting factor ω. Results are for the multi-objective voltage stability constrained OPF problem which was described in [6].
[4] M. Shahidehpour, H. Yamin, and Z. Li, Market operations in electric power systems: forecasting, scheduling and risk management. New York: John Wiley and Sons, 2002.
6150
6140
6130
[5] A. J. Conejo and J. M. Arroyo, “Multiperiod Auction for a Pool-based electricity market,” IEEE Transactions on Power Systems, vol. 17, no. 4, pp. 1225–1231, Nov. 2002.
TTL [MW]
6120
6110
[6] F. Milano, C. A. Ca˜nizares, and M. Invernizzi, “Multiobjective Optimization for Pricing System Security in Electricity Markets,” IEEE Transactions on Power Systems, vol. 18, no. 2, May 2003.
6100
6090
6080 PSfrag replacements
6070
0.1
0.2
0.3
0.4
0.5
0.6
Weighting factor ω
0.7
0.8
0.9
Fig. 14. Total transaction level (TTL) for the 24-bus system as a function of the weighting factor ω.
6. Conclusions The proposed interface is based on PSAT, which is a userfriendly toolbox provided with a complete graphical user interface and a graphical editor of one-line network diagrams. PSAT is currently used by several undergraduates, Ph.D. students and researchers, and has an active mailing list (http://groups.yahoo.com/groups/psatforum) currently counting about 400 members. The PGI provides a variety of OPF-based market and stability optimization problems. The interface merges the sophisticated optimization solvers provided by GAMS with the advanced graphic tools of Matlab. In its current form, it is a convenient tool for educational purposes. Among future projects, there are including new market clearing models based on mixed integer linear programming and extending the currently implemented OPF to dynamic models (e.g. synchronous machines and controllers). The PGI is open source, thus allowing anyone to quickly extend its capabilities and/or including new optimization problems. Any suggestion and/or bug report are very welcome.
References [1] M. Huneault and F. D. Galiana, “A Survey of the Optimal Power Flow Literature,” IEEE Transactions on Power Systems, vol. 6, no. 2, pp. 762–770, May 1991. [2] G. B. Shebl´e, Computational Auction Mechanism for Restructured Power Industry Operation. Boston: Kluwer Academic Publishers, 1998. [3] M. Shahidehpour and M. Alomoush, Restructured electric power systems. New York: Marcel Dekker Publishers, 2001.
[7] F. Milano, “An Open Source Power System Analysis Toolbox,” Accepted for publication on IEEE Trans. on Power Systems, Mar. 2005. [8] R. M. Stallman, Free Software, Free Society: Selected Essays of Richard M. Stallman. Boston: Free Software Foundation, 2002. [9] J. W. Eaton, GNU Octave Manual. Bristol, UK: Network Theory Ltd., 1997. [10] A. Brooke, D. Kendrick, A. Meeraus, R. Raman, and R. E. Rosenthal, GAMS, a User’s Guide, GAMS Development Corporation, 1217 Potomac Street, NW, Washington, DC 20007, USA, Dec. 1998, available at http://www.gams.com/. [11] Reliability Test System Task Force of the Application of Probability Methods subcommittee, “The IEEE Reliability Test System - 1996,” IEEE Transactions on Power Systems, vol. 14, no. 3, pp. 1010–1020, Aug. 1999. [12] F. Milano, “PSAT, Matlab-based Power System Analysis Toolbox,” 2002, available at http://thunderbox.uwaterloo.ca/∼fmilano. [13] K. Schoder, A. Feliachi, and A. Hasanovi´c, “PAT: A Power Analysis Toolbox for M ATLAB/Simulink,” IEEE Transactions on Power Systems, vol. 18, no. 1, pp. 42–47, Feb. 2003. [14] C. D. Vournas, E. G. Potamianakis, C. Moors, and T. V. Cutsem, “An Educational Simulation Tool for Power System Control and Stability,” IEEE Transactions on Power Systems, vol. 19, no. 1, pp. 48–55, Feb. 2004. [15] M. C. Ferris, MATLAB and GAMS: Interfacing Optimization and Visualization Software, Computer Sciences Department, University of Wisconsin-Madison, Aug. 1999, available at http://www.cs.wisc.edu/mathprog/matlab.html. [16] W. D. Rosehart, C. A. Ca˜nizares, and V. Quintana, “Multi-Objective Optimal Power Flows to Evaluate Voltage Security Costs in Power Networks,” IEEE Transactions on Power Systems, vol. 18, no. 2, pp. 578–587, May 2003. [17] K. Xie, Y.-H. Song, J. Stonham, E. Yu, and G. Liu, “Decomposition Model and Interior Point Methods for Optimal Spot Pricing of Electricity in Deregulation Environments,” IEEE Transactions on Power Systems, vol. 15, no. 1, pp. 39–50, Feb. 2000.