constants from scme enzyme-catalyzed reactions not monitored to completion. ... used to extract the rate constant, k, from absorbance-time data described by ...
A graphical method for extracting rate constants from some enzyme-catalyzed reactions not monitored to completion BERNARD R. GLICK &'.W.Best I~rstitute,Bonding umd Best Deparmltnt of Merficul Resectrch, Utzisersity of Toronto,
112 College Street, Toronto, O t ~ t .Canada , M5G 1L6
Can. J. Biochem. Downloaded from www.nrcresearchpress.com by 99.250.173.17 on 08/23/18 For personal use only.
LEWISJ . BRUBACHER Guelph-Waterloc~Centrejbr Gruduate Work in Chemistry, Waterloo Camnpus, Department of Chemistq, University qf Waterloo, Waterloo, Ont., Canada N2L 362 AND
DAVIDJ. EEGGETT Urziversity qf Torotato, Erindtile College, Missixsnuga, Otzt., Canada L5L 1C6 Received February 23, I978 Revised July 3 1, 1978 @lick, B. R.. Brubacher. t.1. & Leggett, D. J. (1978)A graphical method for extracting rate constants from scme enzyme-catalyzed reactions not monitored to completion. Cast. J.Biorhttn. 56, 1055-1057 A large nun1ber of enzyme-catalyzed reactions can be described by the equation y At - B(l eckf),where y is the amount of product formed, A is the slope of the linear portion of the curve, andB is a constant dependent on the mechanism of the reaction. The methods which are generally used to extract the rate constant, k , from absorbance-time data described by this equation require that the reaction be monitored for some 10 to 15 half-lives. We show herein that the rate constant R is readiay obtained from a plot of (v" - y') vs. - yo) where yo, y ' , and y" are the values ofy at times t . t At, and t + 2Ar. This graphical methbd is simple, reliable, and requires that the reaction be monitored for only three to five half-lives of the exponential phase ofthe reaction. We Rave used this method to measure the rate of activation of a mixed disulfide of papain and 2-nitro-5-mercaptobenzoic acid in the presence of substrate.
-
+
G k k , B. R., Brubacher, L. S . & Leggett, D. J. (1978)A graphical method for extracting rate constanth from some enzyme-catalyzed reactions not monitored to cornpleticm. Can. J. Biochern. 56, 1055-1057 Un grand nomkre de reactions catalysees par lesenzymes peuvent 2tre decrites parl'kquation y = At - B(1 - e ou y est Ia quantitk de produit formk,A est la pente de la portion 1inCait-e de la courbe et B, une constante dtpendantedu mecanisme de la reaction. Les rnethodes genCralement utilisees pour obtenir laconstante de vitesse, k, des donnees de I'absorbance en fonctiondu temps decrites par cette equation requierent que la reaction soit enregistree pour quelque I0 15 demi-vies. Nous montrons ici que la constante de vitesse k est faciiement obtenue de la courbe (y" - y ' ) vs. ( y l - vU) ou yo, y' et v" sont les vdeurs de y aux temps r , t + At, et t + 2Af. Cette mktRt9degraphique-estsimple, sdre et elle necessite que la reaction soit enregistree pour seuiement trois a cinq demi-vies de la phaw exponentielle de la reaction. Nous avons employe cette methode pour rnesurer le tauxd'activation d'un disulfure mixtede Ba papitine et de l'acide 2-nitro-5-mercagtobenzoi'queen presence du substrat. [Traduit par le journal]
Introduction The proteolytic enzyme papain exists in an inactive form as a mixed disulfide of enzyme and cysteine (1,2). A study of the activation of papain in the presence of substrate suggested tkdt the substrate could bind to the inactive enzyme (3) probably in a nonproductive binding mode (4, 5 ) . To gain additional insight into the nature of the site where papain binds substrates nonproductively a study of the activation of several papain mixed disulfides was undertaken (6). This manuscript describes a graphical method developed to determine the rate constant for the activation reaction. For a large number of enzyme-catalyzed reactions the appearance of product P(=y) as a function s f time can be
expressed by [I] In this equation k is a rate constant, A is the slope of the linear portion of the curve, B is a constant which is a function of the mechanism s f the reaction, and t is time. For proteolytic enzymes, El] can be used to describe presteady-state burst reactions (71, enzyme activation or inactivation monitored by substrate hydrolysis (3). as well as reactions which employ monitoring substrates to detect intermediate processes for nonchromophoric substrates (8). The form of [I] may be derived from several mechilnistic pathways. The rate constant is normally extracted from curves of
Can. J. Biochem. Downloaded from www.nrcresearchpress.com by 99.250.173.17 on 08/23/18 For personal use only.
1056
CAN. J . BBOCHEM. VOL. 56. 1978
the form described by [ I ] using either of two graphical methods (7). One method employs a first-order plot of the differences between the slope of the tangent to the curve at time d and the slope sf the linear portion of the curve, The other method employs a first-order plot of the differences between the actual curve and the extrapolated linear region. Both of these methods require that the reaction proceed for some 10 to I$ half-lives of the exponential process so that a good linear region is obtained. This requirement often cauws problems since true linearity occurs only if the substrate concentration is constant throughsttt the course of the reaction. Another problem with naonitoring for 10 to 15 half-lives is the possibility of enzyme degradation or other complicating side reactions occurring in this time period. In cases where the reaction cannot be followed for as much as 10half-lives, a modified Guggenheim (9)analysis laas been suggested by Gutfreund and Sturtevant (10). This approach is less dependent on the condition that the substrate concentration be constant or much greater than K,, (Mishaelis-Menten notation). Ira this paper we propose an alternative to the modified Guggenheim approach. Ow- approach, based on the met hod of Mezdy et ad. (1B B. has the advantages of making the maximal use s f the data, requiring only three to five half-lives to be completed, and does not invc~lve log-top csr semilogarithmic plotting.
In this equation SEi and EiS are nonactive enzyme-substrate cornp!exes analogous t s nonprod~active (SE) and productive (ES) complexes with active enzyme, respectively, and k,,, kaf, and k,, are the second-order rate constants for the reaction of activator, A, with the species SEi, Ei, iand EiS, respectively.
From this mechanism, using the steady-state approximation it can be shown that
where
PI
= =
[Ea1 + [Eul total enzyme concentration
+ bEiSl + [SEil total concentration of nonactive enzyme
[91 bEnl = [Eil =
[lo] [Eaj
-
+
[El f [ES] [ES'] concentration of active enzyme
= total
Prc.parution of Papain p mixed Dissdjide Mercuripapain (Worthiragton Biochemicals Inc.) was activated with L-cysteineand then passed through a Sephadex G-25 column, equilibrated with 0.635M borate buffer, pN8.5, ,u = 0.10M , [EDTA] = M , to remove the L-cysteine from the papain. Solutions of active papain were modified by the addition of a 108-fold naolar excess of 5,s'-dithiobis(2-nitrobewzoicacid). After incrbatiotm for 30rnin at room temperature the excess reagent was removed by passing the mixture through a G-25 column equilibnated as above.
k, = overall first-order activation rate constant
Kinetics of Actir.atiorm of Papeas'rz Mixed Dishtlfide Five rnillilitrec of a-N-knzoyl-L-argit~ineethyl ester in an aqueous solution containing 0.30M KC1 and IW3M EDTA were added to a pH-stat reaction vessel maintained :at 25.0 2 O.lO&. After 50pI of 2 x 1W5M papain mixed disulfide, in 0.05.M borate buffer, pH 8.5, ,u = 0. BOM. [EBTAJ = 10--"M, were added to the reaction mixture the pH was adjusted to 8.8. At t h e F = 8,50pill of a solution s f L-systeinewere added to the reaction mixture. The reaction progress was msnitored by re- Thus [ 7 ] , derived from the kinetic mechanism depicted in cording the amount of base required to maintain a constant pH of 123, has the form of [I]. From [I] it fdlows that at times t , 8.8. F -+ As, and F -+ 2At, Priancipks
The mechanism represented by [2] depicts the activa- [14] tion of a mixed disulfide of papain and 2-witrcr-5mercaptobenzoi~acid in the presence of the substrate [I51 a-l$r-bewmyl-L-arginineethyl ester (3-5).
[16]
y Q = At - B(1 - e-'"') y' = A(t t A t ) - B(I - e-k(t'At))
y" = A(t
+ ZAt) - B(l
- e-x(t'2d')1
Subtracting [14] from 1151 and 1151 from 1161 and rearranging yklds
[I71 (y" - y ' ) = A&(l - e-kAt)+ (y' - yo)e-kA' C SE
KS' .--
&
E+S
Ks
L ES
k:
--+ESP
+ PI
From [I73 a plot of cv" - y') vs. (y' - yo) is linear with a slope of exp (- khs) and intercept ofAAr(1 - exp (--k%t)),
so that both k and A are readily obtained, where A vmax
-
=
In practice the value ofA is obtained, more reliably, as follows. Once the data O," - y') vs. (y' - yo) have been piotted and the best straight line drawn through the data, ra second line, slope equal to unity, is drawn from the origin to intersect the first line. Since this is the bisectrix of the graph then
Can. J. Biochem. Downloaded from www.nrcresearchpress.com by 99.250.173.17 on 08/23/18 For personal use only.
el81 (Y" - yY')= (yY'- Y O ) Substituting [I$] into [I71 yields
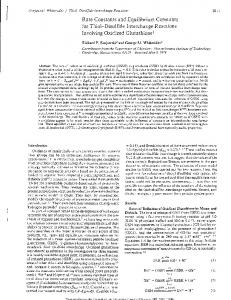
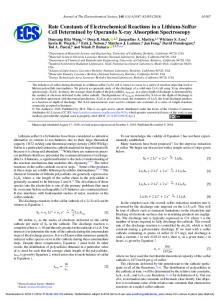
Thus the point of intersection of the best straight line through the data with the bisectrix, divided by At, givesA directly. Results and Diseussiom Figure I depicts a typical pH-stat recorder trace of the activation of a mixed disulfide of papain and 2-nitro-5mercaptobenzoic acid in the presence of a-N-benzoylL-arginine ethyl ester. Simple graphical methods which rely on the slope of the tangent to the curve at infinite time being accurately known generally overestimate the rate constant for the experimental process. This problem may be overcome by monitoring the reaction for apprsximately 10- 15 half-lives of the experimental process. However, monitoring the re-ertction for long periods of time can cause a significant depletion of substrate resulting in a decreased final slope as well as possible unwanted side reactions. A plot of the data of Fig. t as suggested by 1171, i.e., (yo - y ' ) VS.(v' - yo), is shown in Fig. 2. T o draw Fig. 2 we
TIME (rnin) FEG.1. Activation of a mixed disulfide of papain and 2-nitro5-mercaptobenzsate. The y-axis represents the number of millilitres of 0.10M KOM required ts maintain a constant pH (1 mrn chart paper = l pl of base added). [Papain] = 2 x M, pH 8.0. [a-lV-benzoyl-L-arginincethyl estherj = (9.05M , and [L-cysteine] 3 x 1 0 - W e
-
FIG.2. A plot of (v" - v ' ) VS. (Y' (from intercept) = 2.14
X
-
- yo) for the data of
Fig. 1; Ar 1.12 x lo-" A lWR,and A from (bisectrix) = 2.09 x
= 10min; slope = 0.51, intercept = 49.8, k
first divided the data of Fig. 1 into three equal time intervals, At. This plot is linear with the points grouped together and located some distance from the y-axis. By determining A by the bisectrix method we avoid having to depend o n a n accurate determination of the p-intersept of this curve, after a relatively long extrapolation. Although we have shown only one curve analyzed by the method described herein we have tested it extensively with both real and simulated data. We find that this method is quite reliable and in fact yields accurate vaiaaes (within 5%) of both k and A with an uncertainty on simulated data. It is also clear that this method does not require the subjective and often difficultjudgement of the linearity of later portions of the curve. A detailed discussion of the results of the activation several papain mixed disulfides is the subject of a fordhcoming manuscript. 1. Sluyterrnan, L. A. A. (1967) Biochbn. Bfopbays. Actlz 139. 430-438 2. Klein, I. B. & Kirsch, J. F. (1969) Biochena. Biophys. Res. Cornmupa.34,575-581 3. Sluytermdn, k.A. A. (1968)Biochirn. Bs'opkoys. Acta 1-51, 178- 187 4. Brocklehurst, K.,Crook, E. M. & Wharton, C. W.(1968) FEBS Lett. 2,69-73 5 . Glisk, B. R. Bfs Brukacher, L. J. (1974) Can. J.Biocb1el~2.52, 877-883 4. Glick, El. W. (1974) Ph.D. thesis, University s f Waterloo, Waterloo, Ontario 7. Bender. M. L. & KCzdy , F. J . (1965) Annu. Rev. Biocheln. 34,49-76 8, Brubacker, L. J . 61975) Can. J. Chrrn. 53,564-571 9. Graggenheirn, E. A. (1926) Phil. Mag. 2,538-557 18. Gutfreund, H. 2% Sturtevant, J . M. (1956) Bitrcbzcrrt. J . 43. 456-661 11. KCady, F. J . , Jaz, S . & Bruylants, A. (1958) Bujl. Soc. Chirn. Belg. 67,687-7M