From: AAAI Technical Report SS-99-01. Compilation copyright © 1999, AAAI (www.aaai.org). All rights reserved.
A Graphical Technique for Preliminary Assessment of Effects on DNA Sequences from Toxic Substances A Nandy1, C Raychaudhury1 and S C Basak2 1
Computer Division, Indian Institute of Chemical Biology, 4 Raja S C Mullick Road, Calcutta 700 032, INDIA. Email:
[email protected] 2 Natural Resources Research Institute, University of Minnesota, 5013 Miller Trunk Highway, Duluth, Minn. 55811, USA. E-mail:
[email protected]
Abstract Some toxic substances are known to bind preferentially to specific segments in a DNA sequence while others such as copper preferentially affect DNA constituents such as guanine. In view of the complex nature of large molecules such as DNAs and the possibility of these toxic chemicals affecting homologous segments, techniques for identifying the possible DNA sites that may be affected assume significance. While chemical and laboratory tests remain the basic tools of such investigations, rapid computer-based searches that may help to minimise the possible locations of such toxic damages would be a useful supplement. We have observed using a two-dimensional Cartesian representation technique for DNA sequences that individual genes have unique graph signatures. These arise from the base arrangements and distribution in the coding sequences that are specific to each gene type and therefore have characteristic graphical representations. For conserved genes the entire gene including coding and non-coding regions are seen to have unique shapes. The characteristic shapes retain their shape similarity for homologous genes making visual identification possible from a library of gene graph signatures. Use of automatic pattern recognition programs can make such identifications simple and fast and lead to more efficient scanning of long DNA sequences. A quantitative indexing scheme recently proposed by u s estimates the dispersion of the graphical representation and provides quantitative estimates of graph similarity. This will help to further narrow down the possible matches against the library catalogue. The basic benefit we derive from a twodimensional graphical technique is that minor deviations in base sequences do not alter the characteristic shape and hence homologous sequences generate shape similarity, which we may term as shape homology; identification of homologous sequences i n the normal character-based representation present a more formidable problem. In the case of effects of toxic substances on specific DNA sequences, we can trace the pattern of the sequence segment in the twodimensional representation, and homologous sequences that have shape homology with this pattern can be expected to be receptive to such toxic chemicals. A rapid visual or computer search of a complete DNA sequence for such specific patterns can lead to identification of possible sites which can then be investigated further by more rigorous means. A s another example of the use of these graphs, high levels of copper toxicity leading to depletion of guanine
component of a DNA sequence will show up in these graphs as a compression along the horizontal axis There are many other information that can be read off from these graphs that make them a useful tool i n analysis of DNA sequences; several of these could be profitably employed in the search for effects of toxic substances. Systematic differences are seen in the characteristic shapes for a set of homologous conserved genes, and these can be used as a guide for estimating significant changes. Closer inspection of the graphical shapes provides indications of local base dominances and evidences of repetitive segments and therefore possible extent of damages that may accrue from high toxicity levels. Thus the graphical technique provides to a first approximation a new and useful predictive and diagnostic tools.
Introduction The wide use of different chemical substances and growing library of new synthetic chemicals have led to increased possibility of toxic effects on tissues and cells of living beings (Basak et al 1998). Several toxic substances are known to cross the cellular barrier and affect intracellular matter; e.g., arsenic toxicity arising from the ability of arsenite [As(III)] to bind protein thiols (Hu , Su and Snow 1998), furazolidone or N-(5-nitro-2furfurylidene)-3-amino-2-oxazolidone, one of the members of the group of synthetic nitrofurans at a concentration level of 0.5 µg/ml inhibiting DNA synthesis (Maiti et al 1983), Cr genotoxicity manifesting as gene mutations, several types of DNA lesions and inhibition of macromolecular synthesis (Singh et al 1998), a series of synthetic chemicals such as methyl and ethyl quaternary pyridiniumtetrahydrocarbazoles active in inhibiting DNA synthesis in Ehrlich ascites cells (Ferlin et al 1998), norfloxacin and its inducing metabolites in vitro with S9 rat liver mutagenic to hisG48 strains TA102 and TA104 (Arriaga-Alba et al 1998), airborne particulates inducting sister chromatid exchanges (SCE) in human tracheal epithelial cells (Hornberg et al 1998), and others. While some toxic substances can affect DNA molecules binding preferentially to specific segments in a DNA sequence, others like copper preferentially affect DNA constituents such as guanine. The nature of the interaction of Cu(II) ions with DNA has been found to be dominant in two ways which may take place simultaneously at low ionic strengths of the solvent: type I interaction prevalent at low values of Cu(II) ions/DNA ratio has the overall effect of stabilising (Richard Daune and Schreiber 1973) or nondenaturing (Foerster et al 1979) the DNA; type II
interaction is predominant at higher values (>0.3) of the Cu(II) ions/DNA ratio and has the effect of destabilising the DNA by initiating breakage of G-C bonds or mutation or depletion of the Gs (Richard Daune and Schreiber 1973, Foerster et al 1979). Similarly, several other chemicals are suspected of causing gene mutations leading to inherited genetic defects leading to necessity of techniques to predict and identify such effects. In view of the complex nature of large molecules such as DNAs and the possibility of these toxic chemicals affecting homologous segments, methods for identifying the possible DNA sequences that may be affected become significant. While chemical and laboratory tests remain the basic tools of such investigations, and new techniques are constantly being innovated (see, e.g., Mitchelmore et al 1998), rapid computer-based searches that may help to minimise the search for possible locations of such toxic damages would be a useful supplement. In this paper we report application of a graphical technique (Nandy 1994) that can be used for this purpose.
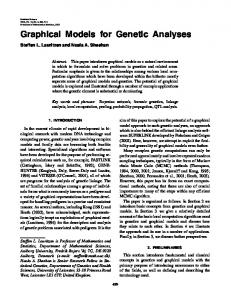
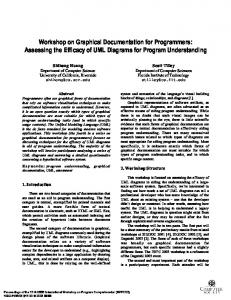
adenosine gets relatively enhanced. This is evident visually from as low as a 5% depletion of the guanine. In terms of the graph radius as defined in our earlier paper, we find that the graph radius for the three plots change from 96.17 for the unaltered human beta globin gene to 97.61 for a 5% random depletion of guanine and 100.29 for a 10% depletion. Thus, a comparison of beta globin gene sequence from a standard reference sample and from contaminated samples can readily be tested for random mutation of bases. Our studies on histones, kinases, thymidines and other samples of conserved gene sequences also show similar variations with changes in one or more bases that may have been induced by the action of toxic chemicals; the comparison can be extended similarly to any identified sequence segment.
-250
-150
-50
50 50
C A
G
Method
0 -50
The method of representing DNA sequences graphically using a 2-dimensional Cartesian coordinate system has been explained elsewhere (Nandy 1994, Ray Raychaudhury and Nandy 1998). The shapes of these DNA graphs depend on the base distribution in the sequence. The plot is generated by moving one step in the positive x-direction for a guanine (G) in the sequence, the negative x-direction for an adenosine (A), the positive y-direction for a cytosine (C ) and the negative y-direction for thymine (T), the succession of such steps producing a shape characteristic of the sequence. We have shown (Nandy 1994) that for conserved genes such plots are shape similar thereby making identification of a new sequence of the family possible rapidly and easily by visual inspection alone; elsewhere we have shown that one can read off base preferences and local abundances directly from the shape of these graphs (Nandy 1995), or identify coding and noncoding sequences (Nandy 1996a). Changes in base distribution and composition induce changes in the visual plots of the DNA sequences; for the same gene for different species we have noticed systematic drifts in the sequence pattern which has been attributed to evolutionary changes (Nandy 1996b). This has been estimated quantitatively by using a new algorithm that sums the co-ordinate values of the graph points and normalizes to per nucleotide as has been explained in Raychaudhury and Nandy 1998.
Results and Discussions As a preliminary exploration of the technique we have used the complete normal human beta globin gene sequence inclusive of introns and exons as the base sequence. A random alteration in the guanine bases in the sequence was performed programmatically to simulate the effect of high dose of copper (Cu(III)) toxicity. The plot of the beta globin gene sequence is seen to shift to the left as the guanine gets depleted and the abundance of the
-100 -150 3
-200
1 2
T
-250
Fig: Human Beta globin gene from the beta globin region on chromosome 11 and variations plotted on the ACGT axes. 1: The normal beta globin gene sequence; 2: beta globin gene sequence with 5% random mutation in guanine; 3: same with 10% random mutations in guanine. This method, both quantitatively and in visual graph system, is also useful in the case of contaminants that more generally affect pyrimidines or purines. In the former case the plot will show change in the extent in the vertical y-axis, while the latter will alter the extent and spread along the x-axis. Development of a suitable program for pattern recognition and comparison from a set of standard library of sequence shapes will automate the processes and allow this technique to be used as a ready reckoner to measure the intensity of toxicity of newly synthesized as well as already available chemicals and products. Such a technique could be especially useful for measurement of the toxic effects on life forms where other clues are not readily available as in the case of mussels and other aquatic fauna.
Conclusion
We have thus shown that a 2D-graphical method of DNA sequence representation can be used to provide visual clues to sequence mutation and alteration brought on by toxic substances like Cu(III) in relatively high concentrations. This technique can be used to measure the extent of toxicity by quantitative estimation of the degree of mutation so as to set a comparison standard. Development of a pattern recognition software to scan and identify regions of deviations from a reference library of sequence plots would help in rapid identification of toxicity effects and quantification of levels of toxicity in newly synthesized and existing toxic chemicals.
References Arriaga-Alba M, Barron-Moreno F, Flores-Paz R, GarciaJimenez E, Rivera-Sanchez R 1998, Genotoxic evaluation of norfloxacin and pipemidic acid with the Escherichia coli Pol A-/Pol A+ and the ames test, Arch Med Res 29(3):235-40 Basak S C, Grunwald G D, Host G E, Niemi G J and Bradbury S P 1998, A comparative study of molecular similarity, statistical, and neural methods for predicting toxic modes of action, Environ Toxic Chem, 17(6):1056-1064 Ferlin M G, Chiarelotto G, Marzano C, Severin E, Baccichetti F, Carlassare F, Simonato M and Bordin F 1998, Synthesis and biological properties of a new series of N-pyrido substituted tetrahydrocarbazoles, Farmacol 53(6): 431-437 Foerster W, Bauer E, Schitz H, Akimenko N M, Minchenkova L E, Evolokimov Y M and Varshakovsky Y M 1979, Bioploymers 18: 625 Hornberg C, Maciuleviciute L, Seemayer NH, Kainka E 1998, Induction of sister chromatid exchanges (SCE) in human tracheal epithelial cells by the fractions PM-10 and PM-2.5 of airborne particulates, Toxicol Lett 9697:215-20 Hu Y, Su L, Snow ET 1998, Arsenic toxicity is enzyme specific and its affects on ligation are not caused by the direct inhibition of DNA repair enzymes, Mutat Res 408(3):203-18 Maiti, M, Ghosh, S, Chatterjee, A and Chatterjee, S N 1983, Thermal stability of DNA interacting with furazolidone and Cu(II) ions, Z Naturforsch, 38c: 290293 Mitchelmore C L, Birmelin C, Livingstone D R and Chipman J K 1998, Detection of DNA strand breaks in isolated mussel (Mytilus edulis L.) digestive glans cells using the ÒCometÓ assay, Ecotoxicol Environ Saf 41(1):51-58 Nandy, A 1994, A new graphical representation and analysis of DNA sequence structure: I. Methodology and Application to Globin Genes, Current Sc 66(4):309-314 Nandy A and Nandy P 1995, Graphical analysis of DNA sequence structure: II. Relative abundances of nucleotides in DNAs, gene evolution and duplication, Current Sc 68(1), 75-85. Nandy, A 1996a: Two dimensional graphical representation of DNA sequences and intron-exon
discrimination in intron-rich sequences, Comput Appl Biosci, 12(1):55-62 Nandy, A 1996b: Graphical analysis of DNA sequence structure: III. Indications of evolutionary distinctions and characteristics of Introns and Exons, Current Sc 70(7): 661-668 Ray, A, Raychaudhury, C and Nandy, A 1998, Novel Techniques of Graphical Representation and Analysis of DNA Sequences - A Review, J Biosc 23(1):55-71 Raychaudhury, C and Nandy, A 1998, ÒIndexing Scheme and Similarity Measures for Macromolecular SequencesÓ, J Chem Info Comput Sc, in press Richard H, Daune M and Schreiber J P 1973, Biopolymers 12: 1 Singh J, Carlisle D L, Pritchard D K, Patierno S R 1998, Chromium-induced genotoxicity and apoptosis: relationship to chromium carcinogenesis, Oncol Rep 5(6): 1307-1318 Tinkler J, Gott D and Bootman J, Risk assessment of dithiocarbamate accelerator residues in latex-based medical devices: genotoxicity considerations 1998, Food Chem Toxicol 36(9-10):849-866