A Hierarchical Evolutionary Approach to Multi-Objective Optimization Christine L. Mumford School of Computer Science PO Box 916 Cardiff University Cardiff CF24 3XF United Kingdom Email:
[email protected]
Abstract— This paper describes a hierarchical evolutionary approach to Pareto-based multi-objective optimization. Using the SEAMO algorithm (a simple evolutionary algorithm for multiobjective optimization) as a basis, it demonstrates how it is possible to obtain a better spread of results if subpopulations of various sizes are used in a simple hierarchical framework. Three alternative hierarchical models are tried and the results compared.
I. I NTRODUCTION Evolutionary algorithms (EAs) that utilize subpopulations are popular for two reasons: first, they adapt readily to parallel hardware, leading to faster execution; and second, isolated populations encourage genetic diversity and discourage premature convergence. Premature convergence is a serious problem with EAs, and is encountered with single and multi-objective problems alike. Multi-objective optimization requires the simultaneous optimization of several (often competing) objectives. Problems involving multiple objectives are characterized by optimum sets of alternative solutions, known as Pareto sets, rather than by single optima. Pareto-optimal solutions are non-dominated solutions in the sense that it is not possible to improve the value of any one of the objectives, in such a solution, without simultaneously degrading the quality of one or more of the other objectives in the vector. Evolutionary algorithms are well suited to multi-objective optimization problems because they produce many solutions in parallel. However, the simple scalar fitness function, which usually provides a focus for progress in the single objective case, is inappropriate for multiple objective problems, where it is difficult to rank solutions that have strengths and weaknesses in different objectives. One approach is to construct a scalar fitness function from a weighted combination of the individual objectives [17]. The disadvantage of this scheme is that a priori decisions are required regarding the relative importance of the various objectives. An alternative approach, favored by many researchers today (for example see [3], [4], [19], [21]), is to design an EA that will converge on multiple non-dominated solutions (i.e. approximate Pareto sets), leaving a decision maker to select a single solution from these alternatives at a later stage. In this way knowledge of the distribution of non-
dominated solutions can lead to a more informed judgement. On the other hand, when a naive weighted combination of objectives is used, excellent solutions are easily overlooked. An excellent survey of evolutionary multi-objective optimization is provided by Coello Coello in [2]. Maintaining diversity within a population remains a primary challenge for all EA researchers. In the single objective case, the search spaces of many real world problems are multimodal and highly difficult. In the multi-objective case, multimodal search spaces can exist in many dimensions, compounding the problem difficulty. Nevertheless, most research on modern multi-objective EAs has focussed on scalability over the problem dimensions, rather than over the problem difficulty [8]. However, the diversity along the Pareto front is different in nature from the diversity required to to avoid premature conversion within the individual dimensions of the problem. The latter was named lateral diversity in [5]. The rationale behind the present study is to explore some of the opportunities that arise through the increased availability of large-scale computing resources, in the form of faster processors and parallel architectures (although only very basic computing resources are used for the experiments in the present, preliminary study). As computing power becomes less of an issue, how should we best structure multi-objective EAs to effectively capitalize on the improved resources on offer, to enhance population diversity, in both senses, and produce a better spread of higher quality solutions? Several previous studies have explored a number of different parallel [16] and hierarchical [1], [8] models for multi-objective EAs. The intended contribution of the present author is to offer an exceptionally simple framework for this. The paper presents some new hierarchical models for multi-objective EAs, based on the SEAMO2 algorithm [14], which is an improved version of the original SEAMO algorithm (a simple evolutionary algorithm for multi-objective optimization)[13], [18]. The eventual plan is to implement the most successful of the new ideas on real world problems and parallel hardware. The SEAMO algorithms would appear to be particularly good candidates for parallel implementation for the following reasons: • They perform well in comparison with other state-of-the-
art multi-objective EAs [13], [14], [18] They are particularly simple to implement • No complex global calculations are required for fitness or dominance Unlike most other multi-objective EAs, the SEAMO algorithms rely on a few simple locally applied rules for replacing individuals in the population with superior offspring in a steady-state environment. In contrast, other multi-objective EAs tend to focus their genetic search at the selection stage, where they use various fitness functions that reflect the global dominance relationships within a population, to bias the choice of parents for breeding in favor of the ‘better individuals’ (for example see [3], [4], [19], [21]). Fitness functions based on dominance relationships were first proposed by Goldberg [6] and are known collectively as Pareto-based fitness functions. The test problems used in this study consist of multiple knapsack problems (MKPs) and continuous functions all selected from [21]. The MKPs were randomly generated with uncorrelated profits and weights, and each knapsack capacity was set to half the total weight of all the items in that knapsack. The continuous functions, SPH-2 [10], [17], ZDT6 [20], QV [16] and KUR [9], provide conditions of extreme difficulty for testing multi-objective EAs. Problem sizes for the MKP experiments vary between 500 and 750 items in 2, 3 or 4 knapsacks, denoted knn.m, where n is the number of items and m the number of knapsacks. The MKP is a generalization of the simple 0/1 knapsack problem. The 0/1 MKP involves m knapsacks of capacities c1 , c2 , c3 , ..., cm . Every selected object must be placed in all m knapsacks, although neither the weight of an object oi nor its profit is fixed, and will probably have different values in each knapsack. Four continuous functions have been selected for this study. All consist of two objectives and 100 variables. •
a) it replaces a parent, if possible b) else it replaces another individual at random 2) else if offspring dominates either parent it replaces it 3) else if offspring is neither dominated by nor dominates either parent it replaces another individual that it dominates at random 4) otherwise it dies In part 1a of the above replacement strategy, a new offspring will replace its first parent, provided that deletion of that parent does not result in the loss of a global best value, (e.g. if the offspring discovers a new global best-so-far for objective 1, parent 1 should not be deleted if it harbors a best-so-far for objective 2). For problems with two objectives, whenever it is unsafe to delete parent 1, it will always be possible to delete parent 2 without losing a global best. This is not always the case when there are 3 or more objectives, however [14]. Procedure SEAMO Begin Generate N random individuals {N is the population size} Evaluate the objective vector for each population member and store it Repeat For each member of the population This individual becomes the first parent Select a second parent at random Apply crossover to produce single offspring Apply a single mutation to the offspring Evaluate the objective vector produced by the offspring if offspring qualifies Then the offspring replaces a member of the population else it dies Endfor Until stopping condition satisfied Print all non-dominated solutions in the final population End Fig. 1.
Algorithm 1 A basic framework for SEAMO
II. BACKGROUND This section outlines the SEAMO2 algorithm and the representation schemes used for the MKP and the continuous functions. It also makes some preliminary observations regarding the effect population size appears to exert on the quality, range and spread of solutions that can be obtained. It was these observations that provided the initial inspiration for the present paper. A. The SEAMO2 algorithm The SEAMO framework, outlined in Figure 1, illustrates a simple steady-state approach, which sequentially selects every individual in the population to serve as the first parent once, and pairs it with a second parent that is selected at random (uniformly). A single crossover is then applied to produce one offspring, and this is followed by a single mutation. Each new offspring will either replace an existing population member, or it will die, depending on the outcome of the chosen replacement strategy. The replacement strategy adopted in SEAMO2 (developed in [14]) is as follows: Replacement Strategy for SEAMO2 1) if offspring harbors a new best-so-far Pareto component
The replacement of a parent by a dominating offspring in part 2 is dealt with in a similar manner to 1a, above. The first parent is tried, to begin with, and then the second parent is tried if the offspring fails to dominate its first parent. If the new offspring dominates neither parent, and yet it is not dominated by either of them, SEAMO2 will save the new offspring if it is possible to do so. In this situation, the algorithm will search the entire population for a suitable candidate for replacement: a suitable candidate being an individual that is dominated by the new offspring. A random ‘sampling without replacement’ routine is used to implement this search. In the rare event that no suitable candidate is found, the new offspring will die, despite the fact that it is non-dominated. This is necessary, in SEAMO2, to ensure a constant population size is maintained. Finally, before any new offspring is allowed to enter the population, it is tested to ensure that it is not identical to any current population member. If it is found to be a duplicate, it will be deleted at this stage. Phenotypic duplicated, rather than genotypic duplicates are deleted for speed and simplicity. (See [14] for justification)
500 items in two knapsacks
4
2.05
x 10
750 items in two knapsacks
4
2.95 Population 200 Population 50
x 10
Population 250 Population 50
2.9
2
Profit in second knapsack
Profit in second knapsack
2.85 1.95
1.9
1.85
1.8
2.8 2.75 2.7 2.65 2.6 2.55
1.75
2.5 1.7 1.7
1.75
1.8
1.85
1.9
1.95
Profit in first knapsack
Fig. 2.
2 4
x 10
2.45 2.4
2.5
2.6 2.7 2.8 Profit in first knapsack
2.9
3 4
x 10
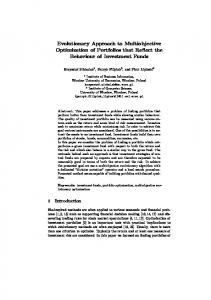
SEAMO2 on kn500.2 and kn750.2 to compare results for large and small populations
B. Representation for the Multiple Knapsack Problem An order-based representation with a first fit decoder [7] is is used in this study for the MKP. With order-based schemes, the chromosomes consist of orderings of all the items, and a decoder is used to produce legal solutions. Starting with an empty knapsack, a first fit decoder selects items in sequence from a permutation list to add to the knapsacks, starting with the first item on the list, then working through to the second, then the third and so on. Whenever inclusion of an item from the list would result in a constraint violation (i.e. an over full knapsack), that item is skipped over and the next item tried. (For further details see [12].) Cycle Crossover (CX) [15] is used as the recombination operator, and a simple mutation operator swaps two arbitrarily selected objects within a single permutation list. The order-based representational scheme was chosen because it produced better results than the more popular bit string approach in a recent comparative study, [12]. In the same study, CX was shown to out perform other order-based recombination operators. C. Representation for the Continuous Functions For all of the continuous functions, the solutions are coded as real vectors of length 100, and one-point crossover acts as the recombination operator. The mutation operator is based on the non-uniform mutation described on page 111 of [11]. For full details of the implementation of non-uniform mutation, the interested reader is referred to [13]. In the SEAMO algorithms, deletion of duplicates helps maintain diversity and prevent premature convergence. For the knapsack problem and other combinatorial problems, where the objective functions can take on only a limited number of discrete values, phenotypic duplicates are easily identified as individuals with matching solution vectors. With continuous functions, however, exact duplicates are likely to be rare. For this reason, values for component objective functions xi and x0i of x and x0 , respectively, are deemed to be equal if and
only if xi − ² ≤ x0i ≤ xi + ², where ² is an error term, which is set at 0.00001 × xi for the purpose of these experiments. D. Preliminary Observations on the Effect of Population Size Experiments using SEAMO2 with different population sizes produce some interesting results, when compared on an evaluation for evaluation basis on the MKPs kn500.2 and kn750.2: • Small populations gave a wider spread of results. • Large populations gave higher quality results in the center of the range. Figure 2 plots the non-dominated solutions extracted from typical runs of SEAMO2 on the knapsack problems, kn500.2 and kn750.2, for different populations sizes. In the left hand diagram population sizes of 50 and 200 are tried on kn500.2, and in the right hand diagram we use population sizes of 50 and 250 on kn750.2. In each experiment SEAMO2 is halted after 4,000 generations. The traces for the larger populations represent the non-dominated solutions extracted from single runs consisting of 200 × 4000 evaluations for kn500.2 and 250 × 4000 evaluations for kn750.2. When population sizes of 50 are used, however, non-dominated solutions are collected from four (kn500.2) or five (kn750.2) replicate runs, to ensure that the total number of evaluations performed is the same for each problem, regardless of the population size. The results illustrated in Figure 2 provide convincing evidence that small populations do indeed give better results at the extremes of the Pareto front and, further, that larger populations produce better solutions towards the center of the range. The remainder of the paper concentrates on devising and testing different techniques to combine a range of population sizes within a single hierarchical algorithm. III. T HE H IERARCHICAL A LGORITHMS Two basic hierarchical models are tried, each easily implemented using some simple recursive code. The first model is named the hierarchical-biased algorithm because it divides
Procedure Hierarchical-biased (population) Begin if (populationsize > threshold) split population into lef tpop and rightpop Hierarchical-biased (lef tpop) Run evolutionary algorithm on rightpop else Run evolutionary algorithm on (unsplit) population End
Procedure Hierarchical-balanced (population) Begin if (populationsize > threshold) split population into lef tpop and rightpop Hierarchical-balanced (lef tpop) Hierarchical-balanced (rightpop) Recombine lef tpop and rightpop into population Run evolutionary algorithm on population else Run evolutionary algorithm on (unsplit) population End
Hierarchical-biased 2000 generations
Population 400 2000 generations
Population 50
Population 50
Population 100
Population 200
Hierarchical-balanced 1000 generations
400 1000 generations
200
200 1000 generations
100
100
100
100
1000 generations
50
50
50
50
50
50
50
50
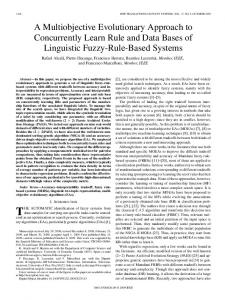
Fig. 3. Hierarchical algorithms: pseudocode (upper) and schematic examples (lower)
the initial population into subpopulations of unequal sizes. A genetic search is then executed on each of these subpopulations and the results finally combined, once more, into a single population. Implementation of a final genetic search on the combined population is optional, and its effect will be examined experimentally. The second model is based on a binary tree structure and splits the population in half, and then in half again as it progresses down the tree, until a threshold subpopulation size is reached. The final subpopulations will be approximately equal in size in this case. Genetic searches will be applied at each level of the tree, starting at the bottom and moving up, with two subpopulations from the level below, merging into a larger subpopulation at each nonleaf node. Figure 3 gives pseudocode and schematic examples for the two hierarchical multi-objective algorithms. Typical population sizes are given in the rectangular nodes of the diagrams, and the number of generations executed at each level is also shown. The first model is illustrated in the top schematic, in which a population (of 400 in this example) is recursively split evenly into left and right subpopulations. However, following each split, the recursion continues on the right hand subpopulation only, leaving the left hand subpopulation intact, and producing unequal populations (of 50, 50, 100 and 200 in this example). In one version of the first model (shown in the diagram but not the pseudocode), the EA is initially run on each of the subpopulations (for 2,000 generations) and finally on the combined population (of 400 for 2,000 generations). In an alternative version (shown in the pseudocode but not the diagram) the final run on the combined population is omitted, and the results are simply collected from double length runs (of 4,000 generations) on the component subpopulations. The two versions of the hierarchical-biased algorithm are named as follows: • the hierarchical-biased-2layer algorithm (or HBI2 for short), and the • the hierarchical-biased-flat algorithm (or HBIF for short) The lower diagram in Figure 3 illustrates the second model, in which the initial population is split evenly at each level to form a binary tree structure. In the example given, the initial population is repeatedly split into two halves until eight subpopulations of 50 individuals are formed. Following execution of the EA on each of the eight subpopulations, the results are combined in pairs, to give four subpopulations of 100 individuals at the next level up. Execution then progresses on these newly merged subpopulations of 100 and the results are combined in pairs, once again, to give two populations of 200. Following execution on the subpopulations of 200, the process completes with a final execution of the EA on all 400 individuals. In this example the EA runs for 1,000 generations at each level, to ensure that both the hierarchical models perform an equal number of evaluations. IV. E XPERIMENTAL M ETHOD In the first set of experiments, the three hierarchical algorithms described in Section III are compared with the
standard SEAMO2 algorithm on the various instances of the MKP. Following these, a second set of experiments extends the comparisons to some continuous functions. None of the hierarchical algorithms is compared to any other state-of-theart EA in the present paper. SEAMO2 has demonstrated its strength in relation to other EAs in a forthcoming paper, [14], and it would thus appear to be a suitable benchmark in its own right. For the MKP, experiments are run for 4,000 generations using a total population of 400 for kn500.2, and 600 for kn750.2, kn750.3 and kn750.4. The examples in Figure 3 show the subpopulation structures used on kn500.2 for hierarchicalbiased-2layer and hierarchical-balanced. Hierarchical-biasedflat runs for 4,000 generations on each of the subpopulations and omits the final stage on the total population. Minimum subpopulation sizes are 50 for kn500.2 and 75 for the three larger knapsack problems, kn750.2, kn750.3 and kn750.4. The subpopulation structures are as displayed in Figure 3 for kn500.2, but lead to splits of 75, 75, 150 and 300 for kn750.2, kn750.3 and kn750.4. For each set of experiments, 30 replicate runs are collected for each algorithm, each run seeded with a different random number. For the continuous functions comparisons are restricted to the hierarchical-balanced and SEAMO2 algorithms, due to lack of time. Population sizes of 400 are used with subpopulations of 50, and experiments are run for 10,000 generations (2,500 generations at each level of hierarchical-balanced). The performances of all algorithms are assessed using the S and C metrics described in [19]. In addition, 2D graphical plots are used where these are helpful. For the MKP, the size of the dominated space is quoted as a percentage of the reference volume between the origin and a utopia point, defined as the profit sums of all items in each objective in [21]. Unfortunately, it is not possible to apply the S metric directly to the results obtained from the continuous functions used here, because they are all minimization problems. Using a suitable formula, however, it is possible to transform a minimization problem into a maximization problem. For the present study, this is achieved by simply inverting the objective values so that: objective10 =
1 objective1
and objective20 =
1 objective2
| {b ∈ B; ∃ a ∈ A : a º b} | |B|
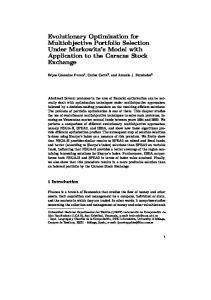
V. R ESULTS The results for the multiple knapsack problems are presented in Section V-A, covering all four algorithms. Section V-B compares SEAMO2 with the hierarchical-balanced on the four continuous functions. A. Multiple Knapsack Problems In this section the three hierarchical algorithms are compared with SEAMO2 on multiple knapsack problems with two, three and four objectives: kn500.2, kn750.2, kn750.3 and kn750.4. The box plots in Figure 4 compare the performance of SEAMO2 and the three hierarchical algorithms on the four knapsack problems, according to the S or hypervolume metric. The boxplot diagrams indicate the spread of results for 30 replicate runs of each algorithm. SE2 represents SEAMO2, HBI2 and HBIF represent the two biased hierarchical algorithms 2-layer and flat, respectively and HBAL represents the balanced hierarchical model. Clearly, the hierarchical algorithms dominate more space, and thus perform better than SEAMO2, although it is not easy to distinguish a front runner from the three hierarchical algorithms based on hypervolume. One-way analysis of variance tests (anova1 in MATLAB) show the results on all four problems to be highly significant (with probability values close to zero). TABLE I AVERAGE VALUES FOR C OVERAGE (A º B) ON THE KNAPSACK PROBLEMS ( THE STANDARD DEVIATION IS IN BRACKETS )
(1)
In addition to the hypervolume and coverage metrics, some graphs are included to illustrate the performances of the algorithms on MKPs with two objectives. Each graphical trace represents the non-dominated solutions extracted from
Coverage (A º B) Test problems B kn500.2 kn750.2 kn750.3 HBI2 37.6 50.1 46.4 HBIF 64.9 70.8 61.4 HBAL 22.2 32.8 19.1 SEAMO2 25.4 15.0 5.2 HBIF 75.4 68.1 50.1 HBAL 20.0 14.8 4.0 SEAMO2 5.8 2.8 0.8 HBI2 7,7 14.9 7.3 HBAL 5.4 6.1 1.5 SEAMO2 28.9 21.8 12.8 HBI2 54.7 72.0 44.4 HBIF 72.4 77.1 60.6
Algorithm A SEAMO2
HBI2
HBIF
etc.
For each of the continuous functions, the size of the dominated space is scaled to give suitable values for easy tabulation. The C metric is measures the coverage of two sets of solution vectors. Let A, B ⊆ X be two sets of solution vectors. The function C maps the ordered pair (A, B) to the interval [0, 1] C(A º B) =
30 replicate runs of a particular experiment. Graphs are sometimes valuable for giving an over all visual impression of the quality and distribution of approximate Pareto points for the various algorithms.
HBAL
kn750.4 46.9 60.1 21.9 4.4 37.2 6.8 1.1 4.9 2.3 6.4 25.2 50.8
Table I presents the average values for Coverage (A º B) for each pair of algorithms. The hierarchical-balanced algorithm scores much more highly than the hierarchicalbiased algorithms for this metric. SEAMO2, however, also performs well for the coverage metric. 2D plots in Figure 5 compare SEAMO2 and hierarchicalbalanced visually. It shows a larger range of Pareto solutions for the hierarchical algorithm, when compared with SEAMO2 on kn500.2 and kn750.2.
750 items in two knapsacks
500 items in two knapsacks 52.6 52.4
52 Percent dominated space
Percent dominated space
52.2 52 51.8 51.6 51.4 51.2
51.5
51
51
50.5 50.8 50.6 SEAMO2
HBI2
HBIF
SEAMO2
HBAL
HBI2
33
20.4
32.8
20.2 Percent dominated space
Percent dominated space
20.6
32.6 32.4 32.2 32 31.8
20 19.8 19.6 19.4 19.2
31.6
19
31.4
18.8 SEAMO2
HBI2
HBIF
SEAMO2
HBAL
Fig. 4.
HBIF
HBAL
Box plots for the various algorithms showing percentage dominated space, S, on kn500.2, kn750.2, kn750.3 and kn750.4
500 items in two knapsacks
4
x 10
750 items in two knapsacks
4
3
SEAMO2 Hier−balanced
x 10
SEAMO2 Hier−balanced
2
2.9
1.95
Profit in second knapsack
Profit in second knapsack
HBI2 Algorithm
Algorithm
1.9
1.85
1.8
2.8
2.7
2.6
2.5
1.75
1.7 1.7
HBAL
750 items in four knapsacks
750 items in three knapsacks 33.2
2.05
HBIF Algorithm
Algorithm
1.75
Fig. 5.
1.8 1.85 1.9 profit in first knapsack
1.95
2 4
x 10
2.4 2.5
2.55
2.6
2.65 2.7 2.75 2.8 profit in first knapsack
Comparing the performance of SEAMO2 with Hierarchical-balanced on kn500.2 and kn750.2
2.85
2.9
2.95 4
x 10
SPH−2
QV
ZDT6
KUR
130
140 80
120
75
120
90 80
70
65
70
70
Dominated space
100
Dominated space
75
Dominate space
Dominated space
110
65
60
55
60
100 80 60 40
60 50
50 SEAMO2
HBAL
Algorithm Fig. 6.
SEAMO2
HBAL
Algorithm
20 SEAMO2
HBAL
SEAMO2
Algorithm
HBAL
Algorithm
Comparing the performance of SEAMO2 with hierarchical-balanced on the continuous functions
B. Continuous Functions Figure 6 gives boxplots of the hypervolume for SEAMO2 and hierarchical-balanced on the four continuous functions. The results indicate that the hierarchical-balanced algorithm out-performs SEAMO2 on three of the four functions. The exception is ZDT6. Although even the performance of SEAMO2 is not very strong on ZDT6, as has been demonstrated in [14]. This weakness is probably due to the present lack of a specific mechanism, in any of the SEAMO algorithms, to encourage evenly spread results across the Pareto front. ZDT6 provides an extreme example of a non-uniformly distributed objective space. Table II compares the coverage values for the two algorithms. For this metric, the hierarchical algorithm performs better than SEAMO2 for KUR, worse for ZDT6 and about the same for SPH-2 and QV. TABLE II AVERAGE VALUES FOR C OVERAGE (A º B) ON THE CONTINUOUS FUNCTIONS
Coverage (A º B) Algorithm Test problems A B SPH-2 ZDT6 QV SEAMO2 HBAL 4.4 98.9 20.8 HBAL SEAMO2 5.4 0 21.6
KUR 10.1 66.2
VI. D ISCUSSION AND F UTURE W ORK General wisdom assumes that better solutions can be achieved by EAs when large populations and long running times are used. Depending on the application, the computational cost of performing a large number of evaluations must be traded with the need for high solution quality. However, with further increases in processor speeds and easier access to
parallel architectures, computational cost is becoming less of an issue. Assuming greater computational power is available, the following question arises with respect to EAs: • given large computational resources, how do we make best use of them? In particular, do we concentrate our computing resources on EAs with large, single populations, or are better results obtained using EA architectures that utilize subpopulations? In this paper some new hierarchical models for multiobjective EAs have been presented. All were built using the SEAMO2 algorithm as a framework. The SEAMO algorithms have performed well in several comparative studies, out-performing their competitors on many problem instances [18], [13], [13], [14]. Their good performance coupled with their simple architecture would appear to make them ideal candidates on which to base new hierarchical and parallel models. SEAMO algorithms are able to produce good results without relying on complex global calculations for fitness or dominance. Results presented in the paper show that the hierarchical algorithms with subpopulations based on SEAMO2 are able to produce a better spread of solutions than the standard SEAMO2 algorithm without a serious degradation in solution quality, in most cases. Over all, the hierarchical-balanced algorithm seems to perform better than the hierarchical-biased algorithms. The general goal is to make effective use of available computing power to extend the spread of Pareto solutions for SEAMO2, whilst maintaining their quality. Previous observations suggest that, whilst increasing the population size improves the density and quality of SEAMO2 solutions in the center of the range, it seriously restricts the spread of solutions at the extremes. On the other hand, small populations appear to perform well at the extremes, but very poorly in the center of the range. A poorer range of solutions for larger populations
would appear, perhaps, rather counter-intuitive. However, close examination of SEAMO’s population replacement strategy may hold the key to this dilemma. Although replacement of an individual in the population by a new offspring is usually determined on the basis of dominance, an exception is made whenever an offspring produces a new global best for any component of its Pareto solution vector. In these circumstances, an offspring will normally be included in the population on the strength of its ‘good’ objective, no matter how poor are its values for the other objectives. In this way, smaller populations are likely to put proportionally more effort than larger populations into expanding their range of solutions, and less into improving the quality towards the center of the range. For an extreme example consider a population with just two individuals for a two objective problem: at any given moment in time, one member will hold the population’s global best for objective 1, and the other member the global best for objective 2. In the two individual population, the algorithm will concentrate 100 % of its effort at the two extremes. Hierarchical models were designed with a view to utilizing different populations sizes, within the same algorithm, in an attempt to obtain a good spread of excellent solutions across the whole range. Future work will concentrate on further, more detailed experiments to tune the hierarchical-balanced EA, and on devising new hierarchical models. Work is already in progress on an algorithm that focuses each of its subpopulation on a different region of the Pareto space. It is hoped that this approach will encourage a more evenly spread set of solutions than are generally obtained at present. Another plan is to try a hierarchical-balanced algorithm based on a ternary tree or a quadtree, rather than a binary tree. Using a quadtree, for example, it would be possible to expand the population size without making the tree taller - for example we could combine 1,200 individuals initially split as 16 subpopulations of 75, in groups of four and complete the EA in 2,000 generations, rather than the 8,000 used in the present paper for this population size. The eventual plan is to implement a successful hierarchical version of SEAMO on massively parallel hardware for real world problems. ACKNOWLEDGMENT The author would like to thank the anonymous referees for their helpful comments. R EFERENCES [1] A. J. Chipperfield, B. Bica, and P. J. Fleming, “Fuzzy Scheduling control of a gas turbine aero-engine: a multiobjective approach”, IEEE Transactions on Industrial Electronics, 49 (3) (2002) 536–548. [2] Carlos A. Coello Coello, “An updated survey of GA-based mulitobjective optimization techniques”, ACM Computing Surveys, 32(2) (2000) 109– 143.
[3] D. W. Corne, J. D. Knowles, and M. J. Oates, “The Pareto envelopebased selection algorithm for multiobjective optimization”, Parallel Problem Solving from Nature – PPSN VI, Lecture Notes in Computer Science 1917 (2000) 839–848, Springer. [4] K. Deb, S. Agrawal, A. Pratap, and T. Meyarivan, “A fast elitist nondominated sorting genetic algorithm for mult-objective optimization: NSGA-II”, Parallel Problem Solving from Nature – PPSN VI, Lecture Notes in Computer Science 1917 (2000) 849–858, Springer. [5] K. Deb, T. Goel, “Controlled elitist non-dominated sorting genetic algorithms for better convergence”, Proc. the First International Conference on Evolutionary Multi-Criterion Optimization, (2001) 67–81, Springer. [6] D. E. Goldberg, Genetic Algorithms in Search, Optimization, and Machine Learning, Addison-Wesley (1989). [7] R. Hinterding, “Mapping, order-independent genes and the knapsack problem”, Proceedings of the first IEEE Conference on Evolutionary Computation, Orlando, Florida, (1994) 13–17. [8] J. Hu, K. Seo, Z. Fan, R. Rosenberg, and E. Goodman, “HEMO: A sustainable multi-objective evolutionary optimization framework”, Proc. 2003 Genetic and Evolutionary Computing Conference, Chicago USA, Springer LNCS (2003) 1029–1040. [9] F. Kursawe, “A variant of evolution strategies for vector optimization”, In H.-P. Schewefel and R. M¨anner (Eds), Parallel Problem Solving from Nature Berlin, Springer(1991) 193–197. [10] M. Laumanns, G. Rudolph, and H -P. Schewefel, “Mutation control and convergence in evolutionary multi-objective optimization”, Proceedings of the 7th International Mendel Conference on soft Computing (MENDEL 2001), Brno, Czech Republic (2001). [11] Z. Michalewicz, Genetic Algorithms + Data Structures = Evolutionary Programs, Third, revised and extended edition, Springer, 1996. [12] C. L. Mumford (Valenzuela), “Comparing representations and recombination operators for the multi-objective 0/1 knapsack problem”, Congress on Evolutionary Computation (CEC) Canberra Australia (2003) 854–861. [13] C. L. Mumford-Valenzuela, A Simple Approach to Evolutionary Multi-Objective Optimization, In Evolutionary Computation Based MultiCriteria Optimization: Theoretical Advances and Applications, edited by Ajith Abraham, Lakhmi Jain and Robert Goldberg. Springer Verlag (2004) London. [14] C. L. Mumford “Simple Population Replacement Strategies for a Steady-State Multi-Objective Evolutionary Algorithm”, Genetic an Evolutionary Computation Conference (GECCO), Seattle, Washington, USA, June 2004 (to appear). [15] I. M. Oliver, D. J. Smith, and J. R. C. Holland, “A study of permutation crossover operators on the traveling salesman problem”, Genetic Algorithms and their Applications:Proceedings of the Second International Conference on Genetic Algorithms (1987) 224–230. [16] D. Quagliarella, A. Vincini, “Sub-population policies for a parellel multiobjective genetic algorithm with applications to wing design”, IEEE International Conference on Systems, Man, and Cybernetics San Diego California (1998) 3142–3147. [17] J. D. Schaffer, “Multiple objective optimization with vector evaluated genetic algorithms”, Genetic algorithms and their applications: Proceedings of the First International Conference on Genetic Algorithms, (1985) 93–100. [18] C. L. Valenzuela, “A simple evolutionary algorithm for multi-objective optimization (SEAMO)”, Congress on Evolutionary Computation (CEC), Honolulu, Hawaii (2002) 717–722. [19] E. Zitzler and L. Thiele, “Multiobjective evolutionary algorithms: a comparative case study and the strength pareto approach”, IEEE Transactions on Evolutionary Computation, 3(4) (1999) 257–271. [20] E. Zitzler, K. Deb, and L. Thiel, “Comparison of multiobjective evolutionary algorithms: Empirical results”, Evolutionary Computation 8(2) (2000) 173–195. [21] E. Zitzler, M. Laumanns, and L. Thiele, “SPEA2: Improving the strength Pareto evolutionary algorithm”, TIK-Report 103, Department of Electrical Engineering, Swiss Federal Institute of Technology (ETH), Zurich, Switzerland, {zitzler, laumanns, thiele}@tik.ee.ethz.ch.(2001) (Knapsack Data downloaded from: http://www.tik.ee.ethz.ch/zitzler/testdata.html)