In order to include these features in urban sustainability and ecosystem service ... USA; 2Student Services Contractor, US EPA/ORD, Research Triangle Park, NC, USA; 3Department of Geography, University of North ... processing software.
A Hierarchical, Machine Learning Approach to Meter-scale Urban Land Cover Mapping Jeremy
1,2 Baynes ,
Matthew
2,3 Dannenberg , Andrew
N.
4 Pilant
1Center
for Earth Observation, North Carolina State University, Raleigh, NC, USA; 2Student Services Contractor, US EPA/ORD, Research Triangle Park, NC, USA; 3Department of Geography, University of North Carolina, Chapel Hill, NC, USA; 4US EPA/ORD, Research Triangle Park, NC, USA
Background
Shadows
Results
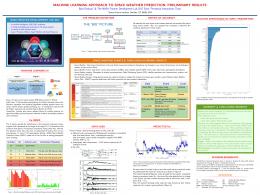
Neighborhood parks and street trees are a vital part of urban green spaces that often occur at a sub-pixel scale in the 30 meter National Land Cover Dataset (NLCD). In order to include these features in urban sustainability and ecosystem service analyses, there is a need for finer spatial resolution land cover (LC) data. The National Agriculture Imagery Program (NAIP) collects 4-band (RGB+NIR) aerial imagery at 1 meter resolution on a one to three year cycle for most of the conterminous US. Multiple supervised machine learning classifications were created from NAIP imagery, each to identify a low number of classes. Using a hierarchical image processing workflow, high resolution urban land cover maps were created with these classes: water, impervious surface, soil & barren, trees & forest, grass & herbaceous, agriculture, and wetlands. The high resolution land cover maps serve as input for many of the EnviroAtlas data layers.
Machine Learning The Genie Pro software (www.observera.com) uses machine learning algorithms to classify any number of classes in a single pass based on user-defined training regions. However, sequentially identifying a single class against a background tends to produce better results. Using a series of classification steps, in which one to three LC classes were mapped (rather than six or more at once), we implemented a hierarchical workflow to determine the final classification for each pixel. NAIP imagery with multiple machine learning classifications in downtown Pittsburgh, PA.
Pittsburgh, PA Land Cover 2010
Shadows cast by vegetation and structures add significant noise to imagery at one meter resolution. Shadows typically appear at the edges of tall buildings and trees, and mottled within tree canopies, and are commonly misclassified as water or impervious surface. Using a binary step of classifying vegetation versus non-vegetation reduced these errors. The image on the right shows shadowed areas correctly classified as impervious (red) or vegetation (green).
Right: The large LC map covers the full study area as defined by the 2010 Census Urban Area. Below: 3 areas at various scales to show the level of detail. For each group: a) NAIP imagery; b) classification; c) transparent classification over imagery.
Conclusions
a.
a.
a.
b.
b.
b.
c.
c.
c.
• NAIP imagery was effective for this very high resolution land cover mapping, and is availabe at little or no cost. • Variable image radiometry (brightness) due to multiple flightlines and collection dates posed challenges for classification of large regions. • Vegetated and impervious surfaces not in shadow were easily separated. • Shadows over impervious surfaces were distinguished from shadow over vegetated surfaces when using a simplified classification scheme and sophisticated image processing software. • Manual correction of misclassified pixels was considerably quicker and easier to perform on multiple binary classifications than on a single multi-class layer. • Bare soil and impervious surfaces were difficult to separate. • Adding LiDAR height-above-ground and intensity to the four NAIP bands improved results, especially with tree canopy.
Data Processing Workflow 6 Band Raster NAIP Aerial Imagery 4 Band (RGB + NIR) Lidar Height Above Ground Lidar Intensity
PHOTO
Raster Calculator Logic Start
Water = 1 Image Processing and Classification with GeniePro, ENVI, and ArcGIS
Tree Classification 0 – background 1 – tree
True
Remaining Classification (IVS) 0 – background 1 – vegetation 2 – soil/barren
True
Hand editing
IVS = 1
True
Class = 2
Tree = 1
False
Hand editing Class = 3
Raster Calculator
1 km
Class = 1
False
False Hand editing
3 km
False
IVS = 0
Water Classification 0 – background 1 – water
6 km
Final 1 Meter Land Cover
U.S. Environmental Protection Agency Office of Research and Development
Accuracy Assessment
Class = 5
True
Class = 4
EnviroAtlas is an easy to use multi-faceted decision support tool. In includes an interactive map, the Eco-Health Relationship Browser, research and information on ecosystem services, and analysis and statistical tools. Additionally EnviroAtlas provides links to other environmental decision support tools, as well as other resources on the relationships between ecosystems, people, and well-being.
Acknowledgements EnviroAtlas is a team effort that requires hard work from many people. Thanks to the entire EnviroAtlas Development Team, U.S. Forest Service, and the land cover group of Keith Endres, Charles Rudder, and Ben Riegel. Aerial Imagery from USDA. LiDAR point cloud from Pennsylvania Spatial Data Access (PASDA). Although this work was reviewed by U.S. EPA and approved for publication, it may not necessarily reflect Agency policy. Use of trade names does not imply endorsement by the authors or U.S. EPA.