A High Level Visual Language for Spatial Data Management Marie-Aude Aufaure-Portier, Christine Bonhomme Laboratoire d’Ingénierie des Systèmes d’Information INSA & UCBL Lyon F-69 621 Villeurbanne Email :
[email protected],
[email protected]
Abstract In this paper, we present a visual language dedicated to spatial data called Lvis. This language has been defined as an extension of the Cigales visual language based on the Query-By-Example principle. The language is based on predefined icons modelling spatial objects and operators which are used to build a visual query. The visual query is then translated into the host language of any Geographic Information System (GIS). A major problem of such a language is that visual queries are generally ambiguous because of multiple interpretation of the visual representation. We first present a brief state of the art of languages dedicated to GIS and then formally define our visual language. The global architecture of the system is described. We then focus on visual ambiguities and propose a model of detection and resolution of these ambiguities. Key-words : Visual Languages, Metaphors and Icons, Spatial Databases 1.
Introduction
Many recent research have been recently done in the field of Geographic Information Systems (GIS) especially for data storage, new indexing methods, query optimization, etc. [LAU 92]. A main characteristics of GIS is to manage complex and large amount of data. An fundamental research area concerns the definition of high level user interface because GIS users are generally non computer scientists. Many applications are concerned by spatial data: urban applications, geomarketing, vehicle guidance and navigation, tourism and so on. Human actors implied in these applications are architects, engineers, urban planners, etc. GIS application have recently migrated towards citizen-oriented applications. This makes crucial the definition of simple and userfriendly interfaces. Cartographic information can be graphically visualized (maps, pictograms, etc.) using marketed GIS, but, in most cases the languages developed for queries and updates are very poor and dedicated to only one specific system. The consequence is that end-users applications cannot be supported by other systems. Another drawback is the complexity for non-computer specialists to design and develop applications. However, the main characteristics of spatial information is to be graphical. This implies that graphical or visual languages are well-suited for spatial applications. Graphical languages are based on the use of symbols representing the data model concepts. These symbols are only pure graphical conventions, without any metaphorical power, and consequently need to be explained and memorized. Visual languages use metaphors to show the concepts. Metaphors take the mental model of the end-user into account. We propose a visual language defined as an extension of the Cigales language [AUF 95]. This language, Lvis, is based on the use of icons. These icons represent the spatial objects stored into the database and the spatial operators used to build a visual query. The extension concerns: (1) the definition of new operators such as logical operators; (2) the detection and resolution of visual ambiguities due to the principle of query construction; (3) the integration of this language into a customizable visual environment [LBA 97] devoted to the design and development of spatial applications. We firstly present a state of the art of visual languages for spatial applications. Then, we formally define our visual language. We then present how to deal with visual ambiguities and propose a detection and resolution model of particular class of visual ambiguities. A description of the prototype is also described. We then conclude on our future work and perspectives.
2.
State of the art
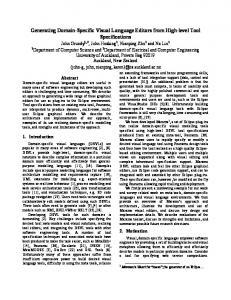
Many propositions have been made the last decade in the field of spatial information retrieval. We can distinguish between the query language approach and the hypermedia approach. We can classify the propositions of query languages into two kinds: (1) textual approach (natural language and extensions of SQL), (2) non textual approaches (tabular, graphical or visual languages). Natural language [BEL 92] approach seems the most suitable for the end-user. But, a serious difficulty of this approach is that many ambiguities must be solved. Another troublesome issue is that query formulation can be verbose and difficult (generally, a drawing is better than a long sentence). This approach can be seen as a good complement for graphical and visual approaches. Many extensions of the SQL language have been proposed [COS 95] [EGE 94]. These extensions are necessary in order to allow Data Base Management Systems to store and retrieve spatial information. However, this class of languages are not suited to end-users because of the difficulty to express spatial relations in natural language and the lack of conviviality for technical languages such as extensions of SQL. Tabular approaches [STA 91] [VAD 93] are defined as extensions of QBE (Query-By-Example) [ZLO 77]. The main difficulty is to express joins. Graphical languages [AND 93] make a better use of visual medium but the underlying concepts are not perceived in a metaphorical way. Considering that spatial information is visual, visual languages [AUF 95] [MEY 92] [BEN 96] [EGE 97] have been proposed. Some work have also be done to design new metaphors [EGE 95] [KUH 93]. We now present visual languages. Visual Languages use icons and metaphors to model spatial objects, spatial relations between objects and queries. The user’s mental model is taken into account [DOW 77]. A metaphor can be seen as a mapping between a domain with a high level of abstraction and another domain with a low level of abstraction. An icon can be viewed as a visual representation of a concept. This approach have been expanded very rapidly because of the evolution of the applications towards citizens and the requirements of the end-users of conviviality and ease of use of the interface. Visual languages offers an intuitive and incremental view of spatial queries but lack from a poor expressive power, execution inefficiency and multiple interpretations for a query. Two main approaches have been developped to design visual languages: (1) the end user draws a pattern using a set of icons, and (2) the end-user makes a drawing directly on the screen using the blackboard metaphor. The first approach is illustrated by the Cigales language [AUF 95] and the second one by the Sketch! [MEY 92] and Spatial-QueryBy-Sketch [EGE 97] languages. The main objectives of Cigales are : (1) to provide a natural and user-friendly query language for GIS users, (2) to support applications on several platforms and (3) to allow the end-user to define his query by successive refinements. The basic idea is that the user draws a pattern according to the data he wants to be displayed and to his mental view of the application [NOR 83]. The main idea is to query against the database using a query by example philosophy [ZLO 77]. A Cigales query is expressed by combining a set of static icons which represent spatial objects and operators that can be applied upon these objects like inclusion, intersection, etc. The graphical query is then compiled into a functional language [HUD 89]. This intermediate language guarantees (1) the support of any platform for the application and (2) the possibility to use again intermediate results to define a query by successive refinements. The graphical editor is made of two parts : a working window in which an elementary query (using only one operator) appears and a window in which the final query is built step by step. The end-user has first to define the operands and then applies an operator by selecting an icon. Then, the system creates the composition of the operands and the operator. The semantics of spatial objects are given by the end-user (navigation in the data model using pop-up menus). This semantics must be represented by metaphors for a more natural comprehension. Figure 1 represents the expression of the query “Find all the urban areas containing a forest part” using the Cigales language.
w orking
selection
area
save
help
CIGALES
end
Inclusion utilit aries aggregates
Int ersect ion
dat a model
Adjacency
path
distance
Figure 1. Cigales visual Language The main advantage of such an approach is its ease of use. The end user does not need to memorise the spatial operators available with this language. Spatial objects and operators are represented by icons. The major drawback comes from multiple interpretations multiple visual representations of queries. Another drawback is that many operators such as negation, logical operators, etc. are not available. The Sketch! language [MEY 92] is based on the blackboard metaphor. The user makes a drawing directly on the screen and then, the system makes the interpretation of this query. Spatial operators are deduced from the drawing. The alphanumerical part of the query is expressed graphically using the entity-relation model. The semantics of spatial objects are given using menus. The query is then translated step by step into a logical expression. The main advantage of such an approach is that the user has no constraints to express a query and does not have any new language to learn. Figure 6 represents the expression of the query “Find all the urban areas situated in a protection zone of an historical monument” using the Sketch! language. QUERY : SPATIAL 1 Zone1 type='urban' Plot1 #plot-number owner-name dist=500m
Figure 2. Sketch! visual language In the Spatial-Query-By-Sketch language [EGE 97], the user selects an object class and draw its boundaries. He can also fills the objects. The drawing is made using the Query-By-Example philosophy (figure 3).
Figure 3. Spatial-Query-By-Sketch Language The main advantage of these two approaches comes from the fact that the user does not have any constraint to express a query and no new language to learn. The main limitation is that a query can lead to multiple interpretations. The user’s drawing may not represent the real world (error due to the mental representation of the user) and may lead to a wrong interpretation or may not represent the user’s viewpoint. These languages can be seen as precursors for visual querying in the GIS domain application and provide two different approaches. The main contribution is that users having a low level in computers can express queries with an intuitive manner. These languages also permits the visual definition of spatial views. Nevertheless, many limitations still remains. The main limitation comes from the ambiguities of visual languages. This problem is the object of paragraph 4. Another limitation is that alphanumerical and spatial data are not uniformly supported. A few operators have no graphic equivalence like operators used for reasoning and deduction. Temporal objects are not taken into account in these languages but we are still working on this problem. 3.
Definition of the visual language Lvis
This section describes the general architecture of our project, then formally defines the syntax and semantics of the Lvis language. A prototype is already available on the marketed GIS MapInfo and is described in section 3.3. An example of construction of a visual query is then given in section 3.4. 3.1 Architecture of the project Lvis is integrated into a customisable design and development environment [LBA 97]. The end-user interface is based upon icons and pop-up menus. A visual query can be seen with a visual representation (visual metaphors), a technical representation (spatial objects and operators involved in the query) and a textual representation (extended SQL). A query is first expressed using the visual language: incremental composition of icons and operators. This query is then translated into an intermediate language in order to be independent from the GIS. This intermediate language is based on the functionality’s proposed in SQL3-MM [ISO 96]. The query is then translated, using a specific driver, towards the host language of the GIS plat-form. Figure 4 shows the general architecture of our system. The successive representations of a query are given step by step. We can notice that this query appears in a visual form and a textual form in the intermediate language and GIS host query language.
_ Visual language
Χ Structural representation
VIS-PIV TRANSLATOR
Pivot language
Req1 R1 Inclusion R11 Select * From Parc Where NIL R12 Select NIL From Montagnes Where Nom = "Alpes"
Syntaxic analyser target GIS
PIV-SIG1 TRANSLATOR
...
SIG1 language
PIV-SIGn TRANSLATOR
SIGn language
Select * From Parc, Montagnes Where Montagnes.Nom = "Alpes" And Parc.obj Entirely Within Montagnes.obj Into Req1
Figure 4. Architecture of the project Lvis 3.2 Definition of the language This section describes the syntax and semantics of Lvis. The alphabet of the language (See Figure 5) is divided into two sub-sets: the spatial object types set and the operators set.
A L P H Spatial A Topological Metrical B Intersection Point E Inclusion selection T Adjacency Ray selection Disjunction Equality
Set theory Intersection Union Identity Difference Exclusive conj.
Spatial types Polygonal Linear Operators Logical And Or Not
Interactive selection Point Radius Rectangle Any Area
Structural Creation Modification Deletion Buffer Zone
Figure 5. The alphabet of the LVIS language The two spatial object types to be handled are areal and linear objects (See Figure 6). We assume that a punctual object would be represented by a polygonal object the area of which is null.
Polygonal object
Linear object
Spatial part that is selected Boundary of the spatial objects
Figure 6. Spatial object types of the Lvis language This set ST of spatial object types is defined by:
TS: NTS x ITS et NTS = {Polygonal, Linear]}, ITS={ , } ( ) ∀ st ∈ ST , st = name st , icon st ∧ name st ∈ NST ∧ icon st ∈ IST ∧ iconts =
iff namets = "Polygonal",
iff namets = "Linear"
Another set of object types is the set of data types. We only consider in this paper spatial data, i.e. objects of the database that own a spatial type. The icons that represent these object types generally use visual metaphors and aim at being as closely as possible to the mental models of the users. TD: NTD x ITD x TS et NDT is the set of names of semantic object types stored in the database, IDT is the set of icons of semantic object types stored in the database, ST is the set of spatial object types previously defined. ∀td ∈ TD, td = (nametd , icontd , typeSts ) ∧ nametd ∈ NTD ∧ icontd ∈ ITD ∧ icontd = ficontd (nametd ) ∧ typeStd ∈ TS with ficontd is a mapping function which associates an icon to a name of data types. The set of operators contains spatial, set theory's and logical operators. Spatial operators are composed of topological operators (intersection, inclusion, adjacency, disjunction, equality) and metrical operators (selection at a given point, circular range selection, buffer zone). The choice of the topological operators have been made in accordance to those which are handled by the normalisation of a spatial SQL [ISO 96]. All of these operators are either binary or unary operators. Set theory's operators (intersection, union, identity, difference, exclusive conjunction, and the complementary ones) have been separated from the spatial ones because they are not used to perform an analyse of the spatial relationships on the database, but are employed to select some parts of objects to which a spatial operator would be applied. Logical operators are made of the disjunction, the conjunction and the negation operators. Figure 7 shows the icons associated to topological spatial operators and logical operators. Topological Operators Intersection Inclusion Adjacency Disjunction Equality Logical Operators
Disjunction, Conjunction, Negation
,
,
Figure 7. Set of topological and logical operators of Lvis The set O of operators is defined by: O: NO x IO x AO x STO x SDO x RO and NO is the set of the names of the operators, IO is the set of the icons of the operators, AO = { 1, 2} is the set of arity of the operators (either unary or binary operators), STO = { Topological, Metrical, Set Theory’s, Logical}, SDO is the set of semantic description of the operators, RO is the set of application rules of the operators. ∀o ∈ O , o = (nameo, icono, nbropo, semtypeo, semdesco, ruleo ) ∧ nameo ∈ NO ∧ icono ∈ IO ∧ icono = ficono( nameo ) ∧ nbropo ∈ AO ∧ nbropo = fnbropo( nameo ) ∧ semtypeo ∈ STO ∧ semtypeo = fsemtypeo( nameo ) ∧ semdesco ∈ SDO ∧ semdesco = fsemdesco( nameo ) ∧ ruleo ∈ RO ∧ ruleo = fruleo( nameo )
with
{ficono, fnbropo, fsemtypeo, fsemdesco, fruleo}, a set of mapping functions which associate the name of an operator to an icon, a number of operands, a semantic type, a semantic description and an application rule. Figure . Definition of the 2D-2D intersection operator We just give an example of the definition of the intersection operator. All the operators available in Lvis are defined in the same way. In the next section, we describe the prototype that has already been developed. 3.3 Prototype 3.4 Example of query 4.
How to deal with ambiguities ?
Visual ambiguities can occur at two different moments. They can be a problem either above or below the visual representation of a query (cf. Figure ). On one hand ambiguities appear when a few visual representations are suitable for a given query and it must be decided which one of these representations will be displayed to the user, on the other hand ambiguities are generated when a visual representation of a given query is interpreted in different ways. This second case of ambiguities, interpretation ambiguities, is minimised thanks to the syntax and semantics of our visual language. We are focused also on the first case of ambiguities, those of representation.
Forest
? Town
River
Interpretation Ambiguity
Representation Ambiguity Lvis language
Visual representation of a query
End-users
Figure . Representation ambiguities vs. interpretation ambiguities Firstly a classification of (visual) ambiguity types have been defined (cf. Figure ). Four main types of ambiguities have been distinguished : visual ambiguities tied to the (1) topological relations between the objects
of a query; (2) location of objects expressed in Cartesian or cardinal coordinates; (3) geometry of objects; (4) number of occurrences for a given spatial relation between objects. The two first classes are subdivided into three subclasses: simple ambiguities between two objects, grouping ambiguities between groups of objects and intersection ambiguities between intersections of objects. Our study is concentrated to the handling of topological ambiguities which are concerned with the intersections of objects (C13) and especially to the problem of the "don't care" relations. AMBIGUITY TYPE Topology
Location
Simple
C11
Grouping
C12
Relations with objects’ intersections
C13
Simple
C21
Grouping
C22
Relations with objects’ intersections
C23
Geometry
C3
Number of relations between two objects
C4
Figure . Taxonomy of visual ambiguities We illustrate the problem of "don't care" relations in taking an example of a spatial query. Let's be the query Which towns are crossed by a river and have a forestry zone? This query would have been expressed with our language in two steps: At first, a specification of an intersection relation between an object type Town and an object type River; subsequently, formulation of another intersection relation between the same object type Town and a new object type Forest. But the nature of the spatial relation between the objects River and Forest is unknown... because it doesn't care. What must decide the system? Which visual representation must be chosen for these two objects and for the whole query? (cf. Figure ). Textual query
A few possible visual queries Forest
? Town
River
Which towns are crossed by a river and have a forestry zone? Forest
The spatial relation between the objects towns and forest doesn’t care ⇒ A few visual representations exist!
? Town
Forest River
? Town River
Figure . Example of a “don’t care” relation Then, a model for the detection of visual ambiguities has been defined [Fav98]. It determines the set of possible visual representations for a given query. This model is based on the intersection levels between objects of queries and is a graph-type model including nodes and edges (cf. Figure). Nodes and edges can be either enabled or disabled according to spatial criteria of the query. The main advantage of this model is that the model for queries composed of a given number of objects is built only once and is updated other times according to the spatial criteria of the queries. This model is conceivable for queries with up to four queries (cf. Figure). Because most of spatial queries contain less than four objects we wish we could integrate the model to our language as follows.
Figure . Model of detection of visual ambiguities (a) The graph structure of the model; (b) the complexity of the model. After a query has been confirmed by the user, the system searches for the set of possible visual representations all over the graph of the query. If more than one possible representation exist the system must then decide which one will be the less ambiguous for the user. To do that we think that it is necessary to allow interactions between the system and the user in order to build a user profile. For example, keeping the user's preferences concerning visual representations of queries types that it often formulates could be a good and efficient strategy. The system becomes so a personalised system, indeed even a self-adapted system. We think too that it could be interesting to let the user modifying itself the visual representation of its query. This can be realised by mean of dynamic alterable visual representation of the queries. Spatial criteria of queries (and so spatial relations between the objects of the queries) always still be proved whatever changes may be. 5.
Conclusion and perspectives
References [AND 93] ANDONOFF E. et al., "OHQL : un langage graphique pour l’interrogation d’une base de données", Ingénierie des systèmes d’information, vol. 1, n°2, p. 203-227, 1993. [AUF 95] AUFAURE-PORTIER M.A., " A High-Level Interface Language for GIS", Journal of Visual Languages and Computing, vol 6, n°2, p. 167-182, Academic Press, 1995. [BEL 92] BELL J.E., " The experiences of New Users of a Natural Language Interface to a Relational Database in a Controlled Setting", Proc. of the first Int. Workshop on Interfaces to Database Systems, Ed. R. Cooper, Springer-Verlag p. 433-454, 1992. [BEN 96] BENZI F. and al., "VISIONARY: a Visual Query Language Based on the User Viewpoint Approach", Third International Workshop on User-Interfaces to Database Systems, 12p, 1996. [COS 95] COSTAGLIOLA G. and al., "GISQL - A Query Language Interpreter for Geographical Information Systems", IFIP Third Working Conference on Visual Database Systems, p. 247-258, 1995. [DOW 77] DOWNS R.M., STEA D., Maps in Minds, Reflections on cognitive mapping, Harper and Row Series in Geography, 1977. [EGE 94] EGENHOFER M., " Spatial SQL : A Query and Presentation Language", IEEE Transactions on Knowledge and Data Engineering, vol 6, n°1, p. 86-95, 1994. [EGE 95] EGENHOFER M.J., BRUNS H.T., " Visual Map Algebra : A Direct-Manipulation User Interface for GIS", Proc. of VDB-3 (Third Working Conf. on Visual Database Systems, IFIP 2.6), Lausanne, Switzerland, p. 211-226, 1995. [EGE 97] Egenhofer M. J. "Query Processing in Spatial-Query-by-Sketch", Journal of Visual Languages and Computing, Vol. 8 (4), 403-424. [HUD 89] HUDAK P., " Conception, Evolution and Application of Functional Programming Languages", ACM Computing Surveys, vol 21, n°3, p 359-411, 1989. [ISO 90] ISO/IEC JTC1/SC21/WG3 DBL-SEL3b, 1990 [KUH 93] KUHN W., "7±2 Questions ans Answers about Metaphors for GIS User Interfaces", Cognitive Aspects of HumanComputer Interaction for Geographic Information Systems, T. Nyerges, D. Mark, R. Laurini & M. Egenhofer ed., p. 113122, 1993. [LAU 92] LAURINI R., THOMPSON D., Fundamentals of Spatial Information Systems, The APIC series, Academic Press, 1992. [LBA 97] LBATH A., AUFAURE-PORTIER M.A., LAURINI R. : "Using a Visual Language for the Design and Query in GIS Customization", VISUAL 97, 2nd International Conference on visual information systems, San Diego, December 1997, pp197-204. [MEY 92] MEYER B., " Beyond Icons : Towards New Metaphors for Visual Query Languages for Spatial Information Systems", Proceedings of the first International Workshop on Interfaces to Database Systems, Ed. R. Cooper, SpringerVerlag 1993, p. 113-135, 1992. [NOR 83] NORMAN D.A., Some Observations on Mental Models, Mental models, Gentner and Stevens ed., Lawrence Erlbaum, 1983. [STA 91] STAES F. and al., "A Graphical Query Language for Object Oriented Databases", Proc. of 1991 IEEE Workshop on Visual Languages, p. 205-210, 1991. [VAD 93] VADAPARTY K. and al., "Towards a Unified Visual Database Access", Proc. of SIGMOD'93 (Special Interest Group on Management of Data), Ed. P. Buneman and S. Jajodia, SIGMOD Record, vol. 22, issue 2, p. 357-366, 1993. [ZLO 77] ZLOOF M.M., "Query-by-Example : A Database Language", IBM Systems Journal, vol 16, n°4, p. 324-343, 1977.