A HIGH-SPEED BRAIN SPELLER USING STEADY-STATE VISUAL EVOKED POTENTIALS MASAKI NAKANISHI
Graduate School of Science and Technology Keio University, Yokohama, Kanagawa, 223-8522, Japan
[email protected] YIJUN WANG* and YU-TE WANG†
Swartz Center for Computational Neuroscience Institute for Neural Computation University of California, San Diego, La Jolla, California, 92093, USA *
[email protected] †
[email protected] YASUE MITSUKURA
Graduate School of Science and Technology Keio University, Yokohama, Kanagawa, 223-8522, Japan
[email protected] TZYY-PING JUNG
Swartz Center for Computational Neuroscience Institute for Neural Computation Center for Advanced Neurological Engineering Institute of Engineering in Medicine University of California, San Diego, La Jolla, California, 92093, USA
[email protected]
Implementing a complex spelling program using a steady-state visual evoked potential (SSVEP)-based braincomputer interface (BCI) remains a challenge due to difficulties in stimulus presentation and target identification. This study aims to explore the feasibility of mixed frequency and phase coding in building a high-speed SSVEP speller with a computer monitor. A frequency and phase approximation approach was developed to eliminate the limitation of the number of targets caused by the monitor refresh rate, resulting in a speller comprising 32 flickers specified by eight frequencies (8-15Hz with a 1Hz interval) and four phases (0, 90, 180, and 270 degrees). A multichannel approach incorporating Canonical Correlation Analysis (CCA) and SSVEP training data was proposed for target identification. In a simulated online experiment, at a spelling rate of 40 characters per minute, the system obtained an averaged information transfer rate (ITR) of 166.91 bits/min across 13 subjects with a maximum individual ITR of 192.26 bits/min, the highest ITR ever reported in EEG-based BCIs. The results of this study demonstrate great potential of a high-speed SSVEP-based BCI in real-life applications. Keywords: Steady-state visual evoked potential; brain-computer interface; mixed frequency and phase coding; speller.
1. Introduction In recent years, electroencephalogram (EEG)-based brain-computer interfaces (BCIs) have received increasing attention from researchers in neural engineering, neuroscience, and clinical rehabilitation. 1-10 Although the performance of current BCIs has improved significantly in the past few decades, the current performance level does not support widespread usages. Around the year 2000, the maximum information transfer rate (ITR) of BCI systems was up to 10-25 bits/min.1 1
2
M. Nakanishi et al.
Recent progresses in system design and data analysis considerably improved the ITR of BCIs. For example, the BCIbased spelling systems that use P300 potential and visual evoked potentials (VEPs) show their advantages of large amount of commands and high communication speed.11, 12 Typically, a P300- or VEP-based BCI is capable of reaching more than 30 characters for spelling. The P300 speller (a 6x6 matrix) proposed by Farwell and Donchin,13 for example, reached a speed up to 5 characters/min. Jin et al.14 obtained an ITR of 35 bits/min using a 12×7 matrix speller. Recently, in an electrocorticogram (ECoG)-based P300 BCI, a subject achieved an averaged ITR of 69 bits/min and a peak ITR of 113 bits/min.15 The speed of a P300-based speller is limited by the time during which the characters are intensified and the time between two consecutive characters.16 In general, VEP-based spellers show a higher communication speed than P300 spellers. Bin et al.17 reported an ITR of 58 bits/min in a 6-target system based on steady-state visual evoked potentials (SSVEPs). Recently, higher ITRs were reported in SSVEP-based BCIs. Nakanishi et al.17 reported an ITR of 95 bits/min in an 8-target system. Chen et al.18 reported an ITR of 105 bits/min in a 45-target system. High ITRs were also reported in BCIs using other types of VEP signals. For example, using a code modulated VEP (c-VEP) paradigm, Bin et al.19 reported an ITR of 108 bits/min in a 32-target speller. By applying adaptive learning and error correction methods, Spüler et al.20 obtained an ITR of 144 bits/min using a similar c-VEP paradigm. In an early study using c-VEP, a subject with implanted intra-cranial electrodes reached communication rates of 10-12 words/min.21 Generally, the performance of an SSVEP-based BCI depends on three major factors: (1) stimulus presentation, (2) multiple target coding, and (3) target identification. First, the properties of flickers in stimulus presentation need to be stable and accurate so that the elicited SSVEP signals are robust and reliable for accurate target identification. When using a monitor-based stimulator, the number of targets is always limited by the monitor refresh rate. Recently, the approximation approach proposed by Wang et al.22 solved this problem by using varied frequencies in different stimulation cycles. Using this method, any frequency lower than the half of the refresh rate can be accurately rendered on a computer screen.23 Second, target coding plays an important role in system design and implementation. An efficient target coding approach can enhance the signal-to-noise ratio (SNR) of VEP and thereby increase the discriminability of different targets. The multiple access methods widely used in telecommunications have been adopted in VEP BCIs.24 For example, the time division multiple access (TDMA), frequency division multiple access (FDMA), and code division multiple access (CDMA) methods have been applied to current VEP BCIs. 24 Third, a high-speed VEP BCI requires an efficient target identification method.12 Recently, a multi-channel approach based on Canonical Correlation Analysis (CCA) has been widely used in SSVEP BCIs.16, 25 Compared with power spectrum density (PSD)-based methods using single-channel EEG data, CCA can significantly improve target identification accuracy. 25 The CCA-based method has been further improved in several recent studies.26, 27, 28 This study aims to explore the communication speed limit of an SSVEP-based BCI. Currently, most SSVEP BCIs showed ITRs lower than 60 bits/min.16 The highest ITR reported in SSVEP-based BCIs, which employed frequency coding in system design, was 105 bits/min.18 Obviously, there is room for improvement. By employing hybrid coding approaches such as mixed frequency and phase coding, 29 the number of targets can be increased by integrating frequency and phase information while the discriminability of different targets remains. Furthermore, target identification approaches could be improved by integrating subject specific training data into the CCA-based method. Therefore, by solving the problems of stimulus presentation, multiple target coding, and target identification, the SSVEP-based BCI has potential to achieve a higher communication speed. This study proposes and develops a high-speed SSVEP BCI to support fast spelling at a speed of 40 characters per minute, which corresponds to an ITR up to 200 bits/min, a new world record to the best of our knowledge. To this end, this study first develops an extended approximation approach in visual stimulus presentation to realize accurate coding of both frequency and phase of SSVEPs. The limitation of number of targets caused by the monitor refresh rate can thereby be totally eliminated. A 32-target speller can be implemented by rendering the flickers characterized by eight frequencies (8-15Hz with a 1Hz interval) and four phases (0, 90, 180, and 270 degrees) on a regular LCD monitor. To assess the frequency and phase information within short time durations, this study proposes to incorporate CCA and individual SSVEP training data in target identification. The primary novelties and contributions of this study include: (1) a frequency and phase approximation approach for rendering visual flickers using a regular monitor refresh rate, e.g. 60Hz, (2) a 32-target speller design using a mixed frequency and phase coding
A High-Speed Brain Speller Using SSVEPs
3
Fig. 1. Time series of quad-phase coded (A) flickering signals, (B) elicited SSVEPs by the 10Hz stimuli presented on an LCD monitor with a 75Hz refresh rate, and (C) amplitude spectra, (D) a scatter diagram of the complex spectra of elicited SSVEPs at 10Hz from a subject.
scheme, and (3) a target identification approach using CCA with reference signals derived from individual SSVEP training data. The rest of this paper is organized as follows. Section 2 describes the frequency and phase approximation approach, the target identification method using CCA with SSVEP training data, and the experimental setups in the spelling experiment. Section 3 illustrates the signal characteristics of the SSVEP signals and the results of BCI performance in the spelling experiment. Section 4 discusses important factors that affect the system performance and points out some directions for further improvement. Finally, Section 5 concludes the study. 2. Methods 2.1. Visual stimulus design In the conventional SSVEP-based BCI systems that use a computer monitor to present visual stimuli, a visual flicker that alternates white and black frames at a specified frequency is used to elicit SSVEPs. In this way, the number of flickers that can be presented simultaneously on the screen is always limited by the refresh rate. It is impossible to realize the frequencies by which the refresh rate is not dividable (e.g., an 11Hz flicker under a 60Hz refresh rate) because the white/black reversal needs to occur every 2.73 frames. Wang et al.22 proposed an approximation approach that can generate a visual flicker at a flexible frequency by approximating the frequency with variable number of frames in a stimulation cycle. For instance, a flicker at 11Hz under a 60Hz refresh rate can be realized by interleaving five and six frames in a stimulation cycle as „1110001110011100011100111…‟. Based on this approach, any stimulus frequency up to the half of the monitor refresh rate can be realized. Therefore, the number of visual stimuli that can be presented on a monitor can be considerably increased.18, 22 Importantly, a recent study found that the phase and latency of SSVEPs
4
M. Nakanishi et al.
elicited by the approximation approach are stable across different frequencies, 17 suggesting that the approximation approach could be extended to the phase domain. In this way, the mixed frequency and phase coding approach, which was proved highly efficiently in stimulus coding,29 could be used to implement a BCI speller with a large amount of targets. Generally, to render a visual flicker at frequency f with an initial phase φ, a stimulus sequence s(f,φ,i) can be generated by: (
)
*
(⁄
)
+
(1)
where square[] generates a 50% duty cycle square wave with levels 0 and 1, and i indicates the frame index. In this way, visual stimuli tagged by the same frequency but different phases can be realized. Theoretically, the extended approximation approach can thereby implement visual flickers at any frequency (up to the half of the refresh rate) and any phase (from 0 to 360 degrees). Fig. 1A shows time sequences of quad-phase coded flickering signals (0, 90,180, and 270 degrees) at 10Hz on an LCD monitor with a 75Hz refresh rate. According to the photic driving effect,30 frequency and phase information of the target stimulus can be accurately decoded from the resulting SSVEP signals (Fig. 1B). 2.2. Signal characteristics analysis The stimulus sequence generated by (1) can accurately encode specified frequency and phase in a visual flicker. The frequency and phase of the resulting SSVEPs can be estimated through calculating the complex spectrum using fast Fourier transform (FFT). An amplitude spectrum value and a phase spectrum value can be obtained at the stimulation frequency in the complex spectrum. The initial phase is the angle between the imaginary and real parts of the complex spectrum value. The amplitude and initial phase of SSVEPs can be estimated as follows: ( )
[ ∑
(
( )
)
( )
]
[ ∑
( )
(
)
]
(2)
where ( ) is single-channel EEG signal, is the stimulation frequency, is the sampling rate, and is the number of data points. Then, the phase difference (in π radians) between SSVEPs at two stimulating frequencies ( and ) can be defined as: (
)
( )
( )
(3)
The response latency t (in milliseconds) between the visual stimulus and the SSVEP response can be derived by measuring phase as a function of stimulating frequency and estimating the slope of the curve:31, 32 ( (
) )
(4)
2.3. Target identification 2.3.1. Standard CCA-based method In an SSVEP BCI using mixed frequency and phase coding, target identification can be performed using a two-step strategy: (1) frequency detection, and (2) phase detection. This study first proposes a standard CCA-based method for frequency and phase detection. The frequency of SSVEPs is first detected by the CCA approach, and then the initial phase, which can be obtained through calculating the angle of complex spectrum value at the detected frequency, is compared with reference phases measured from the training data. CCA has been widely used to detect the dominant frequency of SSVEPs in SSVEP-based BCIs.16, 25 CCA is a statistical way to measure the linear relationship between two multidimensional variables, which may have some underlying correlation. Considering two multidimensional variable , and their linear combinations and , CCA finds the weight vectors, and , which maximize the correlation between and by solving the following problem:
A High-Speed Brain Speller Using SSVEPs
5
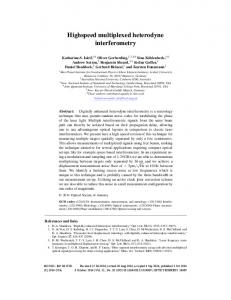
Fig. 2. Flowchart of the proposed target identification method using CCA with SSVEP training data.
(
[
) √ [
] ] [
.
(5)
]
The maximum of with respect to and is the maximum canonical correlation. Projections onto and are called canonical variants. Here, refers to the set of multi-channel EEG signals and refers to the set of reference signals that have the same length as . The reference signals are set as ( ( [
( (
) ) ) )]
(6)
where is the target frequency, is the number of harmonics, and is the number of sampling points. To recognize the frequency of the SSVEPs, CCA calculates the canonical correlation between the multi-channel EEG signals and the reference signals at each stimulus frequency. The frequency of the reference signals with the maximal correlation is selected as the frequency of SSVEPs. Once the frequency of SSVEP is detected, the complex spectrum value at the detected frequency is calculated by FFT to obtain the initial phase of SSVEP signals from a single channel. The complex spectrum is then projected onto the reference phase directions corresponding to targets at the detected frequency, which can be measured from SSVEP training data.22 The visual stimulus with the maximum projected value is then selected as the target. 2.3.2. CCA with SSVEP training data Since training data are required for phase detection, this study proposes a CCA-based method, which uses reference signals from SSVEP training data, for target identification in a one-step way. In the proposed method, training reference signals ̂ can be obtained by averaging training set ( ). Correlation coefficient between projections of
6
M. Nakanishi et al.
Fig. 3. Presentation of the 32-target visual stimuli using mixed frequency and phase coding.
test set and training reference signals ̂ using CCA-based spatial filters (i.e., in (5)) can be used to identify a target from visual stimuli. In this study, three canonical coefficients including (1) and training ̂ between test set reference signals ̂ , (2) between test set and sine-cosine reference signals , and (3) ̂ between training reference signals ̂ and sine-cosine reference signals are used as spatial filters for improving the SNR of SSVEPs. Fig. 2 illustrates the procedure of target identification using the proposed method. The target can be identified by recognizing the training reference signal that maximizes the correlation coefficient. Although the standard CCA-based method cannot discriminate different phases, it still contributes to frequency detection. Therefore, this study considers four different approaches including the standard CCA-based frequency detection method and the three correlation analysis based methods using CCA with SSVEP training data. This study develops an ensemble classifier to combine decisions from the four methods described above. A correlation vector is defined as follows: (
[ ]
̂
( [ (
̂
̂
̂)
̂
)
̂
̂
(7)
)]
) indicates the Pearson‟s correlation coefficient between and . To combine these correlation values, the where ( following weighted correlation coefficient ̃ is used as the final feature value for target identification: ̃
∑
( )
(8)
where sign() is used to remain discriminative information from negative correlation coefficients between test set and training reference signals (e.g., 0 degree vs. 180 degrees, 90 degrees vs. 270 degrees). The training reference signal that maximizes the weighted correlation value is selected as the reference corresponding to the target. To validate the efficiency of the combined method, this study compared classification performance of the following five methods: (M1) a standard CCA-based method; (M2) a correlation analysis using a spatial filter derived from test set and training reference signals; (M3) a correlation analysis using a spatial filter derived from test set and since-cosine reference signals; (M4) a correlation analysis using a spatial filter derived from training reference signals and sine-cosine reference signals; and (M5) a combined method using the ensemble classifier described in (8). 2.4. Experiment 2.4.1. Experiment 1: Offline experiment The offline experiment was designed to analyze the characteristics of SSVEPs elicited by the mixed frequency and phase coded visual stimuli and obtain training reference signals and classifiers for the simulated online experiment. In this
A High-Speed Brain Speller Using SSVEPs
7
Fig. 4. Complex spectra of (A) stimulus sequences and (B) averaged SSVEPs across all subjects at each stimulation frequency. For each sub-figure, horizontal and vertical axes indicate real and imaginary parts of complex spectra. Black dots indicate spectrum values corresponding to other stimulation frequencies. Dashed circle indicates spectrum values with maximal amplitude.
experiment, 32 visual flickers (3 cm 3 cm) were concurrently rendered on a Dell S2409W 24-inch LCD monitor (Dell Inc.) with a refresh rate of 75Hz. The horizontal and vertical intervals between two stimuli were 2 cm and 3 cm respectively. As shown in Fig. 3, targets in a 4 8 matrix were specified by four phases (0, 90, 180, 270 degrees) and eight frequencies (8Hz to 15Hz with a 1Hz interval). Different phases and frequencies were used to label rows and columns respectively. The visual stimuli at all frequencies and phases were produced by the approximation approach described in (1). The stimulation program was developed under MATLAB (Mathworks, Inc.) using the Psychophysics Toolbox extensions.33 Thirteen healthy adults (10 males and 3 females, mean age: 23 years) with normal or corrected-to-normal vision participated in the study. All subjects signed an informed consent form approved by the Research Ethics Committee of Keio University before participating in the experiment. The subjects were seated in a comfortable chair 70 cm in front of the LCD monitor in a dark room. They were asked to gaze at one of the visual stimuli (a target stimulus) for 4 seconds, and 32 targets were indicated in a random order in a run. At the beginning of each trial, a red rectangle marker (see Fig. 3) appeared for 0.5 second at the position of the target stimulus. Subjects were asked to shift their gaze to the target within the same 0.5 second duration. After that, all stimuli started to flicker simultaneously for 4 seconds on the LCD monitor. To reduce eye movement artifacts, subjects were asked to avoid eye blinks during the stimulation period. Seven runs were carried out for each subject. To avoid visual fatigue, subjects could take few minutes of rest between two runs. EEG data were recorded by 16 electrodes over the parietal and occipital areas (FPz, F3, F4, Fz, Cz, P1, P2, Pz, PO3, PO4, PO7, PO8, POz, O1, O2, and Oz) using the g.USBamp (g.tec medical engineering GmbH) with a sampling rate of 512Hz. Event triggers generated by the stimulus program were sent from the parallel port of the computer to the amplifier and recorded on an event channel synchronized to the EEG data. The 4s EEG data epochs synchronized to the visual stimuli were extracted and saved for further analysis. 2.4.2. Experiment 2: Simulated online experiment To estimate an online performance of the BCI based on the proposed paradigm, a simulated online experiment using the same data recording setup, was conducted after the offline experiments. The subjects were asked to input a sequence with all 32 characters in a run, and repeat the run twice in the experiment. The order of targets was randomized in the task sequence. Unlike the 4s stimulus duration used in the offline experiment, visual stimuli flickered for only 1 second
8
M. Nakanishi et al.
on the LCD monitor in the simulated online experiment. The 1s EEG epochs synchronized to the visual stimuli were used for estimating online BCI performance. 2.5. Data analysis and performance evaluation In offline and simulated online experiments, all data epochs were referenced using common average reference (CAR) and then band-pass filtered from 7Hz to 50Hz with an infinite impulse response (IIR) filter. Zero-phase forward and reverse IIR filtering was implemented using the filtfilt() function in Matlab. Considering a latency delay in the visual system (see Equation (4)), the data epochs for offline and simulated online experiments were extracted in [0.12s 4.12s] and [0.12s 1.12s] respectively (time 0 indicated stimulus onset). The 120ms delay was selected towards highest classification accuracy in the offline experiment. To avoid overfitting in CCA, eight electrodes over the parieto-occipital region (PO3, PO4, PO7, PO8, POz, O1, O2, and Oz) were selected for representing the SSVEP data. In the standard CCA using sine-cosine reference signals, the number of harmonics ( ) was set to 3.The single-channel SSVEP signal recorded from the Oz electrode with a small Laplacian reference was used for phase detection using the standard CCAbased method. The recorded EEG epochs were classified by the proposed target identification methods described in Section 2.3. For the offline experiment, the classification accuracy was estimated using leave-one-out cross-validation. Training reference signals and classifiers derived from offline data using 1s-long data epochs were applied to analyzing data epochs from the simulated online experiment. In addition to classification accuracy, BCI performance was also evaluated by ITR calculated as follows1: (
(
)
*
+) ( )
(9)
where M is the number of targets, P is the accuracy of target identification, and T (seconds/selection) is the average time for a selection. This study calculated classification performance using different T (Target gazing: 1s, 2s, 3s, 4s; Gaze shifting: 0.5s) in the offline experiment. For the simulated online experiment, T is 1.5s (1s for target gazing and 0.5s for gaze shifting). 3. Results 3.1. Amplitude, phase, and latency Fig. 1 shows an example of stimulus signals (Fig. 1A) and elicited SSVEPs (Fig. 1B) corresponding to four different phases (0, 90, 180, 270 degrees) at 10Hz from a subject. Fig. 1C shows amplitude spectra of the SSVEPs, which exhibit peak amplitudes at 10Hz for all phases. The scatter diagram of complex spectrum for SSVEP signals (Fig. 1D) indicates four clusters corresponding to four phases. These results indicate that the frequency and phase approximation approach Table 1. BCI performance in simulated online experiment. Subject S1 S2 S3 S4 S5 S6 S7 S8 S9 S10 S11 S12 S13 Mean±Std
Accuracy (%) Frequency 96.88 93.75 93.75 93.75 96.88 96.88 100.00 100.00 89.06 100.00 95.31 98.44 87.50 95.55±3.98
Phase 93.75 90.62 95.31 92.19 90.62 93.75 95.31 96.88 78.12 98.44 85.94 96.88 85.94 91.83±5.68
Mixed 92.19 90.62 93.75 92.19 90.62 92.19 95.31 96.88 78.12 98.44 85.94 96.88 84.38 91.35±5.69
ITR (bits/min) Frequency 108.47 99.49 99.49 99.49 108.47 108.47 120.00 120.00 89.06 120.00 103.82 113.60 84.22 105.64±11.55
Phase 62.54 56.10 66.11 59.23 56.10 62.55 66.11 69.99 35.82 74.36 47.65 69.99 47.65 59.55±10.85
Mixed 168.70 163.47 174.12 168.70 163.47 168.70 179.79 185.78 126.34 192.26 148.70 185.78 144.03 166.91±18.50
A High-Speed Brain Speller Using SSVEPs
9
Fig. 5. (A) Averaged phases of SSVEPs at all stimulation frequencies specific to four phases, and (B) estimated latencies for four phases across subjects.
can elicit robust SSVEP signals that encode accurate frequency and phase information. This approach provides a flexible solution for presenting a large number of flickering targets in an SSVEP-based BCI. Fig. 4A and Fig. 4B illustrate the complex spectra of stimulus sequences and averaged SSVEPs across subjects for each stimulation frequency. The SSVEPs were recorded from the Oz electrode. Ideally, spectrum values corresponding to target stimulation signals should appear at 0, 90, 180, 270 degrees with maximal amplitude while those corresponding to non-target stimulation signals have zero amplitude. Although there were some frequency and phase errors in stimulus sequences (e.g., stimuli at 15Hz) generated by the approximation approach, each target still has distinct frequency and phase characters and thereby can be discriminated from others. The resulting SSVEP signals show similar patterns to the stimulus signals. The change of phases between stimulus signals and SSVEPs is caused by a latency delay in the visual system, which can be estimated by (4). Fig. 5 shows the estimation of phase and latency of SSVEPs. The averaged phases across subjects were plotted in Fig. 5A as a function of stimulus frequency for four phase conditions. All frequency-phase curves fit linear models with a similar slope, indicating that the latency of SSVEP is a constant. Fig. 5B shows the latency estimated by the slope of the linear regression line. The latencies of the SSVEPs for four phase conditions (0, 90, 180, 270 degrees) were 144ms, 141ms, 142ms, and 145ms respectively. The estimated latencies are consistent with results in previous studies.34, 29 A one-way analysis of variance (ANOVA) indicates the difference of latency between different phase conditions was not significant (F(3,48)=0.43, p=0.73). These results suggest that, by extracting distinct frequency and phase information, single-trial SSVEP signals can be accurately discriminated using machine-learning based methods. 3.2. Offline BCI performance Fig. 6 shows the averaged accuracy (Fig. 6A) and ITR (Fig. 6B) across all subjects for the offline experiments. Results for different CCA-based methods were calculated with different data lengths from 1s to 4s. The five methods were described in Section 2.3.2. It is evident that the four methods (M2, M3, M4, and M5) outperformed M1 under all conditions with different data lengths. The ensemble classification method (M5) showed the highest classification accuracy and ITR. With 1-s data length, the accuracy increased from 70.95 17.53% to 88.84 11.48% (M1 vs. M5, t=5.69, p