Expert Systems with Applications 36 (2009) 8616–8630
Contents lists available at ScienceDirect
Expert Systems with Applications journal homepage: www.elsevier.com/locate/eswa
A hybrid evolutionary algorithm for attribute selection in data mining K.C. Tan a,*, E.J. Teoh a, Q. Yu a,b, K.C. Goh a a b
Department of Electrical and Computer Engineering, National University of Singapore, 4 Engineering Drive 3, Singapore 117576, Singapore Rochester Institute of Technology, USA
a r t i c l e
i n f o
Keywords: Evolutionary algorithms Support vector machines Data mining Attribute selection Pattern classification
a b s t r a c t Real life data sets are often interspersed with noise, making the subsequent data mining process difficult. The task of the classifier could be simplified by eliminating attributes that are deemed to be redundant for classification, as the retention of only pertinent attributes would reduce the size of the dataset and subsequently allow more comprehensible analysis of the extracted patterns or rules. In this article, a new hybrid approach comprising of two conventional machine learning algorithms has been proposed to carry out attribute selection. Genetic algorithms (GAs) and support vector machines (SVMs) are integrated effectively based on a wrapper approach. Specifically, the GA component searches for the best attribute set by applying the principles of an evolutionary process. The SVM then classifies the patterns in the reduced datasets, corresponding to the attribute subsets represented by the GA chromosomes. The proposed GA-SVM hybrid is subsequently validated using datasets obtained from the UCI machine learning repository. Simulation results demonstrate that the GA-SVM hybrid produces good classification accuracy and a higher level of consistency that is comparable to other established algorithms. In addition, improvements are made to the hybrid by using a correlation measure between attributes as a fitness measure to replace the weaker members in the population with newly formed chromosomes. This injects greater diversity and increases the overall fitness of the population. Similarly, the improved mechanism is also validated on the same data sets used in the first stage. The results justify the improvements in the classification accuracy and demonstrate its potential to be a good classifier for future data mining purposes. Ó 2008 Published by Elsevier Ltd.
1. Introduction In today’s context, data mining has developed into an important application due to the abundance of data and the imperative to extract useful information from raw data. Many useful data patterns can be selected out, which helps predict outcomes of unprecedented scenarios. The knowledge gained from data mining can also be subsequently used for different applications ranging from business management to medical diagnosis. Decision makers can hence make a more accurate assessment of situations based on this attained knowledge. Support vector machines (SVMs) have recently gained recognition as a powerful data mining technique to tackle the problem of knowledge extraction (Burges Christopher, 1998). SVMs use kernel functions to transform input features from lower to higher dimensions. Many practical applications exploit the efficiency and accuracy of SVMs, such as intrusion detection (Mukkamala, Janoski, & Sung, 2002) and bioinformatics where the input features are of very high dimensions. Data mining is an essential step in the process of knowledge discovery in databases (KDD) (Fayyad, 1997). In addition to data * Corresponding author. E-mail address:
[email protected] (K.C. Tan). 0957-4174/$ - see front matter Ó 2008 Published by Elsevier Ltd. doi:10.1016/j.eswa.2008.10.013
mining, major steps of KDD also include data cleaning, integration, selection, transformation, pattern evaluation, and knowledge presentation. Since data is frequently interspersed with missing values and noise, which makes them incoherent, data preprocessing has thus become an important step before data mining to improve the quality of the data. This subsequently improves the data mining results. Data pre-processing takes several forms, including data cleaning, data transformation, and data reduction. Data cleaning is done to remove noise in the data. Data transformation is to normalize the data. Finally, data reduction is to reduce the amount of data by aggregating values or removing and clustering redundant attributes. Removal of redundant attributes through selection of relevant attributes has become the focus of several recent search projects (Liu & Motoda, 1998). Several machine learning techniques have been around for attribute selection, including evolutionary algorithms (EAs), neural networks, and Bayes Theorem (Chang, Zheng, Wang, & Good, 1999; Hruschka & Ebecken, 2003; Mangasarian 2001; Tan et al., 2002; Wong, Lam, Leung, Ngan, & Cheng, 2000). Hruschka and Ebecken (2003) used the Bayesian approach to carry out attribute selection. The Markov Blanket of the class variable was used as a selection criterion. Neural networks and fuzzy logics (Benitez, Castro, Mantas, & Rojas, 2001) have also been employed
K.C. Tan et al. / Expert Systems with Applications 36 (2009) 8616–8630
for carrying out the attribute selection task. The attributes were first ranked according to a relevance measure. Attributes were then removed in an increasing order of relevance until the generalization ability of the network reached unacceptable levels. The downside of using neural networks is that they are not comprehensible to users. Furthermore, deciding the optimal number of neurons is a difficult task. EAs appear to be promising in the field of attribute selection due to their heuristical nature in a directed, stochastic search. They are based on the process of natural selection and Darwin’s theory of ‘‘survival of the fittest”, which tend to drive an objective to an optimum. Recently, EAs have been applied in attribute selection for several applications (Martin-Bautista & Vila, 1999; Shi, Shu, & Liu, 1998). Pappa, Freitas, and Kaestner (2002) combined genetic algorithm (GA) and C4.5 (Quinlan, 1992) in a multiobjective approach. Multiobjective Genetic Algorithm (MOGA) was used to select the best attribute set by minimizing the error rate and the C4.5 tree size. The results derived demonstrated that the majority of the MOGA-found solutions dominated the baseline (the set of all attributes) and were distributed evenly along the Pareto front. This justifies the ability of GA to produce good results with a wide spread due to its randomness. It is thus beneficial to investigate whether EAs and SVMs can be combined effectively to develop into a good classifier empowered by attribute selection. Based on the past successes of EAs and SVMs, they are fused in a hybrid approach to carry out both attribute selection and data classification. The workflow of this hybrid model contains two main stages. The first phase entails the selection of a set of attributes via EAs. These attributes are then passed to the SVM classifier to acquire a fitness measure for each attribute set in the second phase. These fitness values are then used in the selection of the best set of attributes based on GA. This cyclic method is known as the wrapper approach. Moreover, improvements are made by replacing unfit members of an existing population in a bid to increase the average fitness of the population and garner better results. The remainder of the paper is organized as follows. Section 2 describes the attribute selection task in data mining and the approach used. Section 3 analyzes the proposed GA-SVM hybrid algorithm in the form of a flow chart. In addition, the main characteristics of the hybrid such as the chromosome structure, population layout, and the improved correlation-based algorithm are discussed. Section 4 presents the case study, which includes the introduction of experiment datasets and simulation results. The results are then tabulated and compared with several established algorithms. The viability and usefulness of the hybrid can be observed from the results and show its prospects for future data classification. Section 5 introduces the improvement of the proposed algorithm. Finally, section 6 presents the concluding remarks. 2. Attribute selection in data mining 2.1. Attribute selection In the KDD process, interesting patterns and useful relationships are attained from the analysis of the input data. To ensure that the patterns derived are as accurate as possible, it is essential to improve the quality of the datasets in a pre-processing stage. Most real life data sets contain a certain amount of redundant data, which does not contribute significantly to the formation of important relationships. This redundancy not only increases the dimensionality of the data set and slows down the data mining process but also affects the subsequent classification performance. With this in mind, data reduction aims to trim down the quantity of data that is to be analyzed and yet produce almost similar, if not better, results as compared to the original data. More meaningful relationships can also be derived as the superfluous portions are removed.
8617
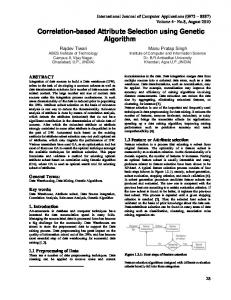
Attribute selection is the process of removing the redundant attributes that are deemed irrelevant to the data mining task (Liu & Motoda, 1998). Seemingly, a ML algorithm’s generalization ability improves with the number of attributes available. However, the presence of attributes that are not useful to classification might interfere with the relevant attributes to degrade classification performance. This is due to the noise that is contributed by these additional attributes and raises the level of difficulty of the ML algorithm in differentiating the signal from noise (Caruana & Freitag, 1994). Subsequently, the complexity of searching the attributes that produces good generalization is increased. The objective of attribute selection is therefore to search for a worthy set of attributes that produce comparable classification results to the case when all the attributes are used. In addition, a smaller set of attributes also creates less complicated patterns, which are easily comprehensible, and even visualizable, by humans. The following step would be to find an algorithm that is efficient to carry out the search for the optimum and minimum set of attributes. It has to be noted that for a data set with n attributes, there are 2n–1 possible subsets. Therefore, an exhaustive search for an optimal set of attributes would be time-consuming and computationally expensive if n is large. Several hill climbing methods have been investigated before, for example, the stepwise forward selection and stepwise backward elimination techniques. In forward selection, the search begins with an empty set and adds attributes with increasing relevance, before terminating at the point when the classification performance declines. Backward elimination starts with the complete set of attributes and prunes the most irrelevant attribute after each iteration. Due to the fact that forward selection begins with an empty set, it neglects the interaction between attributes, which may influence the selection process. On the other hand, backward elimination takes into account this interaction because it begins with a complete set of attributes. However, the analysis from the full set results in a lengthy runtime and may be unfeasible to carry out if the number of attributes is large. Another commonly used search method is best-first search (Ginsberg, 1993; Russell & Norvig, 1995), which is more robust than hill climbing. The major difference is that it is more exhaustive and evaluates the successors of the best attribute set in the solution space, unlike hill climbing which carries out exploration in a fixed path. This rigidity tends to lead the algorithm to a local optimum and terminates the search without achieving global optimality. Kohavi and John (1996) compared the hill climbing search with the best-first search for attribute selection and reported better results with the latter search. Despite this, the best-first search was similarly trapped in local optima in several of the artificial data sets tested. In light of these findings, a more randomized approach would be more suitable to avoid the possibility of being confined in local optima. Hence, in this paper, a GA is used as the underlying search operator for attribute selection. Even if the algorithm arrives at a local optimum, the genetic operators would create opportunities to amend the situation. The stochastic nature of GA is the distinction that distinguishes it from the other searches. Empirical results also demonstrate a fast rate of convergence, which makes GA an efficient algorithm as the number of attributes n increases. 2.2. Wrapper vs filter approach In the attribute selection process, there are two main approaches – the wrapper, and filter approach. The wrapper approach uses the actual data mining algorithm in its search for the attribute subsets (Kohavi & John, 1996) while in the filter approach, undesirable attributes are filtered out of the data before classification begins. Figs. 1 and 2 illustrate both methods.
8618
K.C. Tan et al. / Expert Systems with Applications 36 (2009) 8616–8630
Search (GA) Data set
Attribute set
Accuracy
Trimmed data with best attribute subset Cross-validation Accuracy and Best set of attributes
Attribute Evaluation
ML algorithm (SVM)
Wrapper Fig. 1. Wrapper approach in attribute selection.
Search (GA) Data set Attribute set
Trimmed data with best attribute subset ML algorithm (SVM)
Merit
Attribute Evaluation with a separate algorithm Cross-validation Accuracy and Best set of attributes
Filter Fig. 2. Filter approach in attribute selection.
Filter selection methods are usually executed more efficiently from a computational perspective because they use heuristics from the general characteristics of the data, instead of the actual machine learning algorithm. However, proponents of the wrapper approach exploit the fact that the machine learning algorithm will ultimately make use of the attribute subset to obtain the classification accuracy (Hall, 1999). As such, using the ML algorithm in the wrapper approach to select the optimum set of attributes will tend to bring about higher classification accuracy, as compared to relying on a totally different measure to obtain the subset. The only drawback of the wrapper approach would be a longer runtime because the ML algorithm has to run iteratively in the search for the attribute subsets. John, Kohavi, and Pfleger (1994) tested the filter approach on the artificial corral data set. The attributes were selected using a greedy filter founded on a correlation measure. C4.5 and CART (Breiman, Friedman, Olshen, & Stone, 1984) were experimented as the induction algorithms. In the attribute selection process, an attribute that was highly correlated with the class was included in the attribute subset. The instances were fragmented because this attribute and the correct tree could not be generated. Most filter algorithms would select this particular feature because of its high correlation, without knowing that its presence drastically affects the performance of the induction algorithm. Conversely, wrappers may realize that the feature selected would deteriorate performance and avoid selecting it. This clearly illustrates the benefit of employing the wrapper approach.
the most significant adaptations of EAs are genetic algorithms (GAs), which rely on a string-like representation for implementation. GAs have been extensively tested in the field of attribute selection, returning good results. The key difference usually lies in the fitness evaluation function that is applied for the GA to work. Lanzi (1997) based the fitness function on the inconsistency rate calculated, which sets the limit on the extent of reduction on the total number of attributes. A high rate implies that the attributes selected do not describe the data as well as the complete set and is assigned a low fitness. Chakraborty (2002) used a fuzzy set theoretic measure, Feature Evaluation Index, as the fitness function. For the GA-SVM hybrid, the classification accuracy from the SVM classifier is directly used as the fitness function. 3.2. Population and chromosome structure Implementation of GAs is achieved by translating the parameters into a coded string of binary digits, as is done in this proposed hybrid. These strings denote the attributes present in the data sets, with the length of the string being equal to the N + 1, where N is the number of attributes excluding the class attribute. A typical structure (a chromosome) is illustrated in Fig. 3. To represent the selected attribute set, the following assignment is used: if a particular attribute is to be selected in a chromosome, a ‘1’ is assigned to it. Conversely, for an attribute that is not included in selected subset, a ‘0’ is assigned to it. For illustration, if the first, second and fourth attributes are selected in a 5-attribute data set, it would be represented by ‘110101’. The final
3. GA-Svm hybrid 3.1. Genetic algorithm (GA) Attribute 1
Techniques based on the very fundamental principles of evolution are commonly known as evolutionary algorithms (EAs). One of
Attribute 2
……………
Attribute N
Fig. 3. Structure of a chromosome (BitSet).
Class Attribute
K.C. Tan et al. / Expert Systems with Applications 36 (2009) 8616–8630
bit indicates whether the class in a data set is provided. A ‘1’ means the provision of the class attribute while a ‘0’ suggests otherwise. A population of such strings would then be formed arbitrarily as the initial step of the GA as shown in Fig. 4 below. The genetic operators would then work on this starting population according to the fitness values that are obtained from the performance of the chromosomes. The fitness values attained are the classification accuracies that are empirically derived from the SVM classifier based on the test data. 3.3. Genetic operators The three main genetic operators are selection, crossover and mutation. The fittest chromosome of each generation is chosen and propagated into the next population ensuring that good genetic material is passed on to future generations. An additional copy of it is also made in the new population to give it a statistically higher chance of being selected in future. Following that, the rest of the population are formulated according to the fitness proportionate measure. The higher the fitness of a chromosome, the greater would be its chance of being selected for the recombination process. For the crossover procedure, single point crossover is executed. The two selected parent chromosomes are separated at a particular point that has been randomly selected and their adjacent substrings are interchanged. Next, the mutation step is carried out by flipping bits of a chromosome. In this implementation of mutation, a single bit is chosen randomly and inverted at a particular probability. The probabilities for crossover and mutation are decided with regard to the real life evolution principles, where mutation occurrences are rare.
8619
cleaning to replace the missing values if they are present. A population of 10 chromosomes that represent the attribute subsets is first initialized randomly. The data set is then reduced according to these attribute sets. It is then sent into the SVM classifier to undergo a 20-fold cross-validation. The classification accuracy obtained from this process is then affixed to each chromosome as an indication of their fitness level. This process represents one complete generation of the hybrid. After each generation, the algorithm would then check two termination criteria. Firstly, if convergence is achieved – the case when all chromosomes in the population possess the same fitness levels – the evolution process can then be halted. This means that the optimum set of attributes has been attained. However, convergence is not guaranteed. In this case, the algorithm has to be stopped at some point. The maximum number of generations that the user permits the algorithm to run before stopping the process is set prior to commencement. The second criterion is based on this parameter that is decided by the user. If convergence is not reached before the maximum number of generations, the algorithm will cease. If these two conditions are not met, the population of chromosomes will then go through selection, crossover and mutation as stipulated by the GA. This results in the formation of a newly evolved population. The next generation chromosomes are assigned their fitness levels by repeating the process of trimming the data sets based on the attribute sets they represent and sending them through SVMs. GA is then carried out iteratively until either one of the criteria is met. At termination, the optimal set of attributes is the one with the highest classification accuracy and the least number of attributes.
3.4. Support vector machines (SVM) 4. Case study Support vector machines (SVMs) are a type of classifier that is derived from statistical learning theory, as derived by Vapnik (1995). A support vector machine corresponds to a linear method performed in a very high dimensional feature space that is nonlinearly related to the input space (Hearst, Schölkopf, Dumais, Osuna, & Platt, 1998). The computations in high dimensional feature space are complicated and would be very demanding to carry out directly. However, this problem is solved by employing the use of kernels. In simple terms, the computations are executed directly in the input space although it appears as a linear algorithm in a high dimensional feature space. SVMs are based on basic ideas and provide a good overview of what learning from examples entails. They usually lead to very positive results in practical applications. Other forms of algorithms like neural networks create very complex models to solve problems but are difficult to analyse theoretically. On the other hand, SVM creates complex models that are hassle-free in terms of analysis because of the kernel trick, which largely simplifies the computation. 3.5. Workflow of the GA-SVM hybrid The overall flow chart of the GA-SVM hybrid is illustrated in the Fig. 5. GA is used in the search for candidate attribute subsets while the induction algorithm uses SVMs. The data set goes through data Chromosomes in the population Chromosome 1 Chromosome 2
Chromosome 10
Raw (Objective) value Objective 1 Objective 2
Fitness value Fitness 1 Fitness 2
Objective 10
Fitness 10
Fig. 4. Structure of a population with size 10.
4.1. Experimental setup The proposed GA-SVM hybrid is validated with 5 benchmark datasets that are obtained from the UCI machine learning repository. In most cases, datasets have to be manually partitioned into training and testing data for classification. However, this hybrid approach relies on n-fold cross-validation to acquire the classification accuracy. The data is first randomized to ensure that the different classes of data tuples are evenly spread out to obtain an unbiased validation of the hybrid. Cross-validation then divides the data set into n different portions and the average classification accuracy for the n iterations is acquired. It has been recognized that a classifier that learns well to suit the training data may not guarantee good classification of unseen samples because of overfitting. Cross-validation prevents this because it takes the average classification accuracy of the n classifiers trained. In contrast with other methods like percentage split, n-fold cross-validation is still more attractive in terms of fairness. This is because in cross-validation, all data tuples are tested and they contribute to the overall classification accuracy. Intuitively, this method of evaluating the classification accuracy would produce more consistent results. The only drawback is that it takes a longer time compared to the other methods because the testing process has to be carried out n times for n-fold cross-validation. Despite the longer run time, n-fold cross-validation is used by the hybrid in search for more accurate results. Table 1 lists the parameter settings in the GA-SVM hybrid that are applied to the 5 data sets. These parameters were chosen based on some groundwork experimentation and should not be considered the optimal configurations. In-depth analysis and trials have to be carried out to find the optimal set of parameters. The GASVM hybrid was programmed using the Java(TM) 2 Runtime Envi-
8620
K.C. Tan et al. / Expert Systems with Applications 36 (2009) 8616–8630
start Data set
Data cleaning Initialize population randomly Trim the data set based on the chromosomes
Scale reduced data set and send into SVMs Fitness Evaluation through cross validation
Converge or max_Generation?
Yes
No Propagation & duplication of fittest chromosome from previous population
GA selection and crossover
Output the best chromosome and classification accuracy
GA mutation
End Trim the data set based on the chromosomes and input to SVMs
Fitness Evaluation through cross validation
Fig. 5. Flow Chart of GA-SVM Hybrid Algorithm.
Table 1 Default parameters used in simulation. Default parameters
Value
Population size Maximum number of generations Probability of crossover Probability of mutation Total number of runs Number of folds of cross-validation
10 30 0.6 0.033 100 20
ronment, Standard Edition (version 1.4.1_05) from Sun Microsystems on an Intel Pentium III 800 MHz computer with 384 MB SDRAM. 4.2. Data sets selected The problem complexity of the data sets are summarised in the Table 2 below. 4.3. Simulation results and analysis The benchmark data sets were used to test the GA-SVM hybrid and the classification accuracies are obtained over 100 indepen-
dent runs for all the data sets. The classification accuracies are derived from the 20-fold cross-validation method. The maximum, minimum and mean accuracies for each data set are summarized in Table 3. The classification accuracies are considerably high for all the datasets, particularly for the Iris data set. A reason for this could be that the 3 classes are distinctly separated as described in Section 4.2. The accuracies for the breast-cancer data set appear to be the lowest amongst the five data sets. Nonetheless, referring to the ‘past usage’ section of the data file, we note that past experiments yielded classification accuracies which vary from 68% to 78%. As such, an average accuracy of 76.20% attained by the GA-SVM hybrid is relatively high. It is observed that the Heart-c data set is multi-class, which adds an extra dimension of complexity to the classification problem. Therefore, an average accuracy of 84.07% for that data set showcases the robustness of the GA-SVM hybrid in the multi-class domain. The standard deviations of the classification accuracies are also noted. The small standard deviations presented show the consistency of the classifier. The table also displays the best attribute set for the data sets. These are the selected attributes corresponding to obtaining the best classification accuracy for each data set. In addition, the percentage reduction of in the size of the data sets is
8621
K.C. Tan et al. / Expert Systems with Applications 36 (2009) 8616–8630 Table 2 Problem complexity of the data sets. Data set
No. of Attributes
No. of Classes
No. of Instances
% of major class
Iris Diabetes Breast Cancer Heart-c Hepatitis
4 8 9 13 19
3 2 2 5 2
150 768 286 303 155
33% 65% 66% 55% 79%
Attribute characteristics Numeric
Nominal
Missing
Yes Yes No Yes Yes
No No Yes Yes Yes
No No Yes Yes Yes
Table 3 Classification results of GA-SVM hybrid for the data sets. GA-SVM hybrid
Iris
Diabetes
Breast cancer
Heart Disease
Hepatitis
Max Min Mean Std deviation Best attribute set Total no. of attributes Percentage reduction
98.00% 96.00% 96.60% 0.56% 2,3,4 4 25.0%
78.64% 77.86% 78.26% 0.23% 2,6,7,8 8 62.5%
76.57% 75.17% 76.20% 0.27% 2,4,5,6,9 9 55.6%
85.48% 81.19% 84.07% 1.45% 1,3,4,8,9,11,12,13 13 38.5%
89.67% 84.52% 86.12% 1.73% 1,2,6,7,8,9,10,11,12,14,15,16,17,18,19 19 21.1%
tabulated. This demonstrates the redundancy present in the data sets. Without these removed attributes, we are still able to obtain very positive classification accuracy, yet operate with a smaller data set. Other than using classification accuracies, histograms were also used to analyse the performance of the GA-SVM hybrid. The following histograms of Figs. 6–10 show the performance of the classifier for the data sets tested. In general, the results show no fixed distribution patterns. However, it can be observed that the results recorded for each run are quite consistent. The variation of the classification accuracies is below 5% for all cases and this is supported by the low standard deviation from Table 3. For instance, in the breast-cancer data set, almost 80% of the runs resulted in the classification accuracy being 76.2%. Besides the histogram analysis, the convergence performance of the GA-SVM hybrid is also studied. This is shown in Figs. 11–15 for the respective data sets. The plots are drawn based on the run that produces the best classification accuracy. The evolution process is evident from the fact that the average fitness levels increase in a general exponential direction before converging to an optimum.
However, due to the stochastic nature of GA, the increase sometimes wavers, as shown in the last three plots. This could be due to the genetic operators like mutation where a chromosome mutates into one that is not as fit as its parents. The ability of the algorithm to discover good genetic material quickly can be seen from the best accuracy plot of the population. For most cases, the chromosome with the best accuracy is uncovered in the very early stages of evolution. This is observed from the roughly constant levels of the best accuracy plot. In all cases, the best accuracy either remains constant or increases. This is so because of the fitness proportionate selection method whereby the fittest chromosome is ensured automatic entry into the next population. Furthermore, it can be observed that for the iris, diabetes and breast-cancer data sets, the average fitness values of the population converge quite rapidly, even before the maximum number of generations (set at 30) is reached. On the other hand, the heart-c and hepatitis data sets are unable to attain convergence before the 30th generation. Although this is so, their final average accuracy is relatively close to the best accuracy of the population.
Fig. 6. The performance of the GA-SVM hybrid for the Iris data set.
Fig. 7. The performance of the GA-SVM hybrid for the Diabetes data set.
8622
K.C. Tan et al. / Expert Systems with Applications 36 (2009) 8616–8630
Fig. 8. The performance of the GA-SVM hybrid for the Breast-cancer data set.
Fig. 10. The performance of the GA-SVM hybrid for the Hepatitis data set.
Fig. 11. Evolution progress according to fitness of population for the Iris data set. Fig. 9. The performance of the GA-SVM hybrid for the Heart-c data set.
The reason for their inability to converge could be due to the number of attributes present in the initial data set. Referring to Table 2, it can be seen that the heart-c and hepatitis data sets contain 13 and 19 attributes respectively. This is comparatively greater than the other three data sets. Correspondingly, the chromosome length in their populations would be longer and thus, would take more generations to find good chromosomes and achieve convergence. 4.3.1. Comparison with pure SVM The GA-SVM hybrid was tested with pure SVM to investigate the performance of the additional attribute selection component. Pure SVM in this case means that no attribute selection was done on the data sets. Similarly, the best and average classification accuracies were obtained were based on 100 simulation runs and 20fold cross-validation. The results are tabulated in Table 4. As seen from the table, it can be deduced that the removal of redundant attributes is beneficial for good classification. In all cases, the average classification accuracy improves after attribute
selection is done. This shows that the quality of the data sets is enhanced, as the classifier is now able to classify a higher percentage of test data correctly albeit with a reduced data set. The best accuracy of the population also sees an increase after attribute selection is done. The additional, yet superfluous attributes could have misled the classifier, consequently causing it to wrongly classify the test data. A lesser number of attributes would also mean faster collation of future data, in which only pertinent attributes need to be considered. However, the only drawback of doing attribute selection is the additional time taken to choose the best set of attributes. This is especially true for the wrapper approach that is assumed in this hybrid. Moreover, the random nature of GA does not always ensure that the same optimum set of attributes is chosen in every run. 4.3.2. Comparison with other works In this section, the performance of the GA-SVM hybrid is evaluated against other established classifiers as a basis for comparison.
8623
K.C. Tan et al. / Expert Systems with Applications 36 (2009) 8616–8630
Fig. 12. Evolution progress according to fitness of population for the Diabetes data set.
Fig. 14. Evolution progress according to fitness of population for the Heart-c data set.
Fig. 13. Evolution progress according to fitness of population for the Breast-cancer data set.
Fig. 15. Evolution progress according to fitness of population for the Hepatitis data set.
The comparison will be done via two means. Firstly, the classification accuracies of the various classifiers are measured up against one another. Following that, a further analysis is carried out based on their respective box plots (Chambers, Cleveland, Kleiner, & Turkey, 1983). Box plots provide a clear picture of the distribution of
the classification accuracies obtained from 100 runs. A box plot gives the distribution of a sample population. The thick horizontal line within the box represents the median, while the lower and upper ends of the box represent the upper and lower quartiles of the population. Dashed appendages demonstrate the spread and
Table 4 Comparison between pure SVM and GA-SVM Hybrid. Data sets
Average accuracy for pure SVM (%)
Best accuracy for pure SVM (%)
Average accuracy for GA-SVM hybrid (%)
Best accuracy for GA-SVM hybrid (%)
Best set of attributes
Iris Diabetes Breastcancer Heart-c Hepatitis
95.67 77.02 74.14
97.33 77.73 75.87
96.60 78.26 76.20
97.33 78.64 76.57
2,3,4 2,6,7,8 2,4,5,6,9
82.87 84.67
84.82 86.45
84.07 86.12
85.48 89.67
1,3,4,8,9,11,12,13 1,2,6,7,8,9,10,11,12,14,15,16,17,18,19
8624
K.C. Tan et al. / Expert Systems with Applications 36 (2009) 8616–8630
shape of the distribution, and the ‘+’ symbol represents the outlier values. Several of the established classifiers can be found in the WEKA data mining software package. They include the renowned rule-based algorithms C4.5 rules and PART. The J48 classifier in WEKA would be used to generate a C4.5 decision tree, according to Quinlan (1992). PART is a rule-learning scheme, which can generate good classification rules (Frank & Witten, 1998). The Naïve Bayes (John & Langley, 1995) classifier was also included in the comparison test because it is a popular statistical classifier commonly used for data mining purposes. It usually reports high classification accuracy and would provide a good base measure for the GA-SVM hybrid. These three classifiers from WEKA are used here by means of their default parameters originally set in WEKA. Besides the traditional ML algorithms, we have also included other classifiers that utilize evolutionary methods in their classification process. This would provide a more all-rounded analysis of the GA-SVM hybrid, which is also evolutionary in nature. The first of them is the co-evolutionary system (GP-Co) proposed by Mendes et al. (2001), in which a GP-evolving population co-evolves with an EA-evolving population to generate well adapted fuzzy rule sets and membership function definitions. The GGP is a flexible knowledge discovery system that was proposed by Wong (2001). It applies GP and logic grammars to learn knowledge in various knowledge representation formalisms. The GBML is a fuzzy genetic-based ML algorithm proposed by Ishibuchi, Nakashima, and Murata (2001). It combines both the Michigan and Pittsburgh approach for classification. This algorithm was tested on several data sets, but only the training accuracy was provided for the Iris data. Next, the GPCE is a GP-based technique proposed by Kishore, Patnaik, Mani, and Agrawal (2000), to solve multi-category pattern recognition problems. In this algorithm, the n-class problem was first represented as n two-class problems. GPCE was then trained to recognize samples from its own class while rejecting samples from other classes. The percentage split method was used in this simulation, with the percentage set at 50%. Finally, the CORE is a coevolutionary-based classification technique by Tan, Yu, and Lee (2005) to discover cohesive classification rules in data mining. This is done by coevolving rules and rule sets concurrently in two cooperative populations to confine the search space. The results are summarised in Tables 5–9, and visually in the boxplots in Figs. 16–20. The comparisons will be made individually for each data set, beginning with the Iris data set. I. The Fisher’s Iris data set As seen from Table 5, the average classification of the GASVM hybrid is one of the best, being only 0.01% less than CORE. However, the best accuracy for all its runs cannot achieve 100%, unlike other algorithms. The low standard deviation can also be visualized using the box plot, which
Table 5 Comparison of the GA-SVM Hybrid with other classifiers for the Iris data set. Algorithm
Average accuracy
Best accuracy
Standard deviation
GA-SVM hybrid C4.5 PART NaiveBayes GP-Co GGP GBML GPCE CORE
96.6% 93.67% 93.94% 95.47% 95.3% 94.24% – 96% 96.61%
98% 100% 100% 100% – 100% 98% – 100%
0.56% 3.73% 3.93% 2.93% 7.1% 3.57% – – 2.35%
Table 6 Comparison of the GA-SVM Hybrid with other classifiers for the Diabetes data set. Algorithm
Average accuracy
Best accuracy
Standard deviation
GA-SVM Hybrid C4.5 PART NaiveBayes Itrule CN2 CART AC2 Cal5 GGP CORE
78.26% 73.13% 72.78% 75.09% 75.5% 71.1% 74.5% 72.4% 75.0% 72.60% 75.34%
78.64% 77.39% 80.08% 81.61% – – – – – 77.95% 80.15%
0.226% 2.55% 2.53% 2.45% – – – – – 2.97% 2.30%
Table 7 Comparison of the GA-SVM Hybrid with other classifiers for the Breast-Cancer data set. Algorithm
Average accuracy
Best accuracy
Standard deviation
GA-SVM Hybrid C4.5 PART NaiveBayes CORE
76.20% 71.81% 69.32% 72.34% 75.41%
76.57% 78.35% 80.41% 94.34% 84.69%
0.27% 3.55% 4.33% 3.29% 3.24%
Table 8 Comparison of the GA-SVM Hybrid with other classifiers for the Heart-c data set. Algorithm
Average accuracy
Best accuracy
Standard deviation
GA-SVM Hybrid C4.5 PART NaiveBayes NeuralLinear CORE
84.07% 76.61% 77.97% 82.96% 78.15% 80.77%
85.48% 84.16% 86.14% 90.10% – 90.10%
1.45% 3.27% 3.65% 3.37% 6.86% 3.17%
Table 9 Comparison of the GA-SVM Hybrid with other classifiers for the Hepatitis data set. Algorithm
Average accuracy
Best accuracy
Standard deviation
GA-SVM Hybrid C4.5 PART NaiveBayes CORE
86.12% 78.94% 80.02% 83.62% 84.40%
89.67% 90.57% 94.34% 94.34% 92.45%
1.73% 4.84% 4.98% 4.90% 3.72%
shows a rather flattened box. In contrast to the other algorithms, the hybrid displays better statistical stability as it contains no outliers. II. The Diabetes data set For this data set, several other algorithms are also used for comparison. The results obtained from the rule-based (Itrule and CN2) and tree-based (CART, AC2 and Cal5) algorithms (Michie, Spiegelhalter, & Taylor, 1994) are listed in Table 6. These results were obtained using 12-fold cross-validation. In this data set, the GA-SVM hybrid reported the best average accuracy but an average best accuracy value when pitted against the other algorithms. The very low standard deviation causes the box plot to be very flat. No outliers are present, which emphasizes the stability of the hybrid. III. The Breast Cancer data set From Table 7, we can see that the performance of the GASVM hybrid is the best amongst the rest of the algorithms in terms of average classification accuracy. However, the
K.C. Tan et al. / Expert Systems with Applications 36 (2009) 8616–8630
8625
Fig. 16. Box Plot for the Iris data set.
Fig. 17. Box Plot for the Diabetes data set.
best accuracy value is the lowest. Due to fact that almost an 80% of the runs gave an average accuracy of 76.2% as noticed from Fig. 8, the standard deviation is very small. As a consequence, the box plot is simply a line as seen
from Fig. 18. The outliers are also due to the high concentration of runs at 76.2%. Thus, although the other runs do not differ by less than 1%, they are considered to be outliers.
Fig. 18. Box Plot for the Breast-Cancer data set.
8626
K.C. Tan et al. / Expert Systems with Applications 36 (2009) 8616–8630
Fig. 19. Box Plot for the Heart-c data set.
Fig. 20. Box Plot for the Hepatitis data set.
IV. The Heart disease data set Neural linear is an ML algorithm proposed by Setiono and Liu (1997). It is a system for extracting oblique decision rules from neural networks that have been trained for classification of patterns. The algorithm was tested on this data set using ten repetitions of 10-fold cross-validation. The results are listed in Table 8 below. The average classification accuracy of the GA-SVM hybrid outperformed the rest of the algorithms. However, the best accuracy value is not as high as the other algorithms. Several outliers are also observed in the box plots and the hybrid does not perform as well as Naivebayes and J48 in this aspect. V. The Hepatitis data set The GA-SVM hybrid performs well for this data set. The average classification accuracy is the best of all, but the best accuracy value is the lowest when measured against the other algorithms. No outliers are spotted in the box plot for the hybrid. 4.3.3. Discussion and summary The results in the previous sections exemplify the need for attribute selection to be done on data sets to remove the redundancy
present. From Section 4.3.1, we can see that the classification accuracy improves when attribute selection was carried out. Furthermore, the dimension of the data set would then be reduced and the understanding of the discovered patterns would be simpler. The analysis on future data sets need only to be done with respect to these pertinent attributes and classification would be quicker and more efficient. In Section 4.3.2, we compared the proposed GA-SVM hybrid classifier with other established classifiers, as well as, several other classifiers proposed by data mining researchers. Such a comparison provided a more complete view of the performance of our proposed hybrid. From the results obtained, the hybrid gave the highest average classification accuracy for all the data sets, except for the Iris data set which was also closely matched to the CORE algorithm. This proves its capability as a good classifier and is comparable to the more established algorithms. However, the best accuracy of all the runs for the hybrid is usually lower than that of the other algorithms. This could be due to the fact that 20-fold cross-validation was used and the averaging could have lowered the best accuracy level. The box plots and small standard deviation values show that the GA-SVM hybrid produces very consistent results. There is not
K.C. Tan et al. / Expert Systems with Applications 36 (2009) 8616–8630
much variation of the classification accuracies throughout the runs and shows the stability of the classifier. Also, there are no outliers for the Iris, Diabetes and Hepatitis data sets. Outliers are only present in the other two data sets and this could be due to the high consistency of the classifier in producing a large number of runs with the same accuracy. As such, other neighbouring cases are considered to be outliers even though their accuracies do not differ by a large margin. Attribute selection is therefore a useful step in data mining. The only downside to it is that additional time needs to be allocated to carry out this process before the actual classification and this might be time-consuming. This is so especially for the case of the GA method of selection that we have used. Its stochastic nature does not ensure convergence in a definite period of time. In certain cases, the process may even prolong to the maximum number of generations without convergence. 5. Improvements to the Ga-Svm hybrid The most important consideration for a classifier is its ability to classify correctly. As such, the later stage of development aims for the hybrid to improve its classification capability. There are two main means that are deemed likely to increase the classification accuracy of the GA-SVM hybrid. Firstly, the average fitness of the population can be increased in hope of producing child chromosomes with better genetic material in the subsequent generations. The average fitness could be improved by eliminating the unfit chromosomes in a population and replacing them with fitter chromosomes. By doing this additional step, we also anticipate the optimum to be attained in quicker time and increase the efficiency of the algorithm. Secondly, another way to improve the classification accuracy would be by adjusting the configuration parameters of the simulation. This, however, is a very tedious method with a degree of uncertainty involved. This is so because the values of certain parameters may be more adaptive to different kinds of data sets, resulting in better accuracy for some data sets and worse for others. Also, there is no definite way to tune the parameters. Tuning has to be done based on trial and error and extensive experimentation. With regards to these two methods discussed, further extensions were done using the same data sets. These would be described in detail in Sections 5.1 and 5.2.
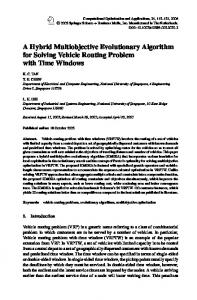
5.1. Correlation-based improvement (a) Methodology As prior mentioned, the underlying principle of this method is to eliminate the weaker chromosomes in the population and substitute them with new chromosomes. The new chromosomes are introduced into the population to replace others who are significantly more unfit than the majority. The new chromosomes are randomly initialized, which means that they are not derived based on chromosomes from previous populations. A point to note is that this random infusion of these new chromosomes would also result in greater diversity. As a matter of fact, diversity is very essential for evolution and this extra dimension should prove helpful in leading the evolutionary process to better accuracies. The next step would be to decide on the measure to determine whether a chromosome is unfit or not. A possible option would be to use SVMs to generate accuracies for the individual chromosomes and decide using this measure. However, this method would mean executing the ‘‘wrapper” twice, first to get the fitness measures to filter out the unfit chromosomes, then to obtain the fitness of the new chromosomes. The fitness is derived from a 20-fold
8627
cross-validation, which means that it would be time-consuming if the cross-validation procedure is repeated twice. As such, an alternative method is adopted in the determination of unfit members in the population. To begin with, let us differentiate two types of fitness levels that would be mentioned hereafter. The first kind is the normal fitness that is used for the evolutionary process. The other is termed the ‘‘retention fitness”, which is used to tell apart the unfit chromosomes from the fitter ones that would be retained in the population. In a bid to reduce the time spent in doing cross-validation, a ‘filter’ method is integrated into the hybrid. This means that in the deciding step to determine which chromosomes are unfit, a totally different algorithm is used to supply the ‘‘retention fitness” values of the population, instead of SVMs. The method considered is based on the correlation between the attributes and was initially mentioned in Section 2.2 to compare the filter against the wrapper approach. According to Hall (1999), a good feature subset is one that contains features highly correlated with (predictive of) the class, yet uncorrelated with (not predictive of) each other. This is the motivation of the ‘‘Correlation-based Feature Selection” method that he formulated. A chromosome that returns a high correlation value suggests that the attribute subset that it represents is a good subset. This correlation value is used in our extension of the project as the ‘‘retention fitness” to indicate which chromosomes are considerably more unfit in the population. The flowchart of the improved algorithm is shown in Fig. 21. For any population formed, the correlation measure of each chromosome is calculated. At the same time, the correlation measures of the chromosomes are added cumulatively. This total value is divided by the population size to obtain the average correlation measure of the population. The population is then scrutinized using this average. Any chromosome that has a correlation measure less than the average would be considered unfit as compared to the rest of the population. They would subsequently be replaced by a randomly generated chromosome. A check has to be done to ensure that this new chromosome also meets the requirement of having a correlation measure greater than the average. If the chromosome fails to meet the requirement, it would be replaced by another randomly formed chromosome. This process is carried out iteratively until a chromosome that has a correlation measure superior to the average is generated. This process ensures that the very unfit chromosomes are removed such that their genetic material is not forwarded to the next generation. Moreover, from the simulations, it can be observed that the correlation measure in most cases is proportional to the classification accuracy. Thus, the correlation measure is a good estimate of the classification accuracy. By means of the correlation method, the unfit chromosomes can be quickly replaced without directly going through the hassle of mining the classification accuracy using cross-validation. (b) Results and discussion For the simulations, the default parameters remained the same as specified in Table 1. The improved algorithm was tested on the same 5 data sets and the results are summarized in Table 10 below. As can be seen from the results, the average classification accuracy is improved for most cases, except for the breast-cancer data set which shows a reduction of 0.05%. There is also an increase in the best accuracy value for the diabetes and heart-c data set. However, it decreased for the hepatitis and iris data set. It can also be seen that the standard deviation of the accuracy values has reduced for all the data sets, especially so for the heart-c and the hepatitis data sets. This implies that the classifier has become more stable using the improved algorithm. Finally, the lowest accuracy
8628
K.C. Tan et al. / Expert Systems with Applications 36 (2009) 8616–8630
CORRELATION COMPONENT Start
Data set
Find correlation measure for each chromosome and calculate average
Data cleaning Initialize population randomly
Identify unfit chromosomes
Trim the data set based on the chromosomes
Generate new chromosomes for replacement
Scale reduced data set and send into LIBSVM
Yes
Correlation measure higher than average?
Fitness Evaluation through cross validation
No
Converge or max_Generation?
Yes
No Propagation & duplication of fittest chromosome from previous population
CORRELATION COMPONENT
GA selection and crossover
GA mutation Output the best chromosome and classification accuracy
Trim the data set based on the chromosomes and input to LIBSVM
End
Fitness Evaluation through cross validation
Fig. 21. Flow Chart of Correlation-based improved Algorithm.
Table 10 Comparison of GA-SVM hybrid before and after the correlation measure was introduced. Data sets
Average accuracy
Best accuracy
Lowest accuracy
Standard deviation
Iris With correlation W/o correlation
96.77% 96.60%
97.33% 98.00%
96.00% 96.00%
0.520% 0.562%
Diabetes With correlation W/o correlation
78.29% 78.26%
78.91% 78.64%
77.60% 77.86%
0.185% 0.226%
Breast-Cancer With correlation W/o correlation
76.15% 76.20%
76.57% 76.57%
75.17% 75.17%
0.232% 0.270%
Heart-c With correlation W/o correlation
84.86% 84.07%
85.81% 85.48%
83.83% 81.19%
0.373% 1.450%
Hepatitis With correlation W/o correlation
87.70% 86.12%
89.03% 89.67%
85.81% 84.52%
0.779% 1.730%
has either remained constant or increased, with exception to the diabetes data set. This further supports the cases where the average accuracy showed an increase.
In conclusion, judging from the average classification accuracy, it is advantageous to apply the correlation measure to obtain a fitter population and inject diversity into it. In the
8629
K.C. Tan et al. / Expert Systems with Applications 36 (2009) 8616–8630 Table 11 Comparison of GA-SVM hybrid after an increase in population size. Data sets
Average accuracy
Best accuracy
Lowest accuracy
Standard deviation
Iris With correlation W/o correlation Pop_size = 16
96.77% 96.60% 96.73%
97.33% 98.00% 97.33%
96.00% 96.00% 96.00%
0.520% 0.562% 0.494%
Diabetes With correlation W/o correlation Pop_size = 16
78.29% 78.26% 78.34%
78.91% 78.64% 78.64%
77.60% 77.86% 77.86%
0.185% 0.226% 0.160%
Breast-Cancer With correlation W/o correlation Pop_size = 16
76.15% 76.20% 76.29%
76.57% 76.57% 76.57%
75.17% 75.17% 74.83%
0.232% 0.270% 0.251%
Heart-c With correlation W/o correlation Pop_size = 16
84.86% 84.07% 85.15%
85.81% 85.48% 85.81%
83.83% 81.19% 84.49%
0.373% 1.450% 0.264%
Hepatitis With correlation W/o correlation Pop_size = 14
87.70% 86.12% 88.53%
89.03% 89.67% 89.67%
85.81% 84.52% 87.10%
0.779% 1.730% 0.581%
following section, the effect of changing the configuration parameters on the performance of the classifier is investigated. 5.2. Parameter-based improvement When investigating the effect of the configuration parameters, the only method would be to vary the parameters and study the corresponding performance of the classifier. However, it is infeasible to test all the parameters exhaustively because there are too many parameter values that can be varied. As such, a more reasonable approach would be to adjust the parameters that are most likely to bring about an increase in the classification accuracy. Out of the list of parameters in Table 1, a probable parameter that might achieve this is the population size. Other parameters such as the probability of crossover and mutation could be tested at a secondary stage because their default values have already been chosen approximately based on evolutionary theory. For instance, in real life, the probability of mutation is small. There will not be much room variation because increasing the probability to too large a value would degrade evolution into an entirely stochastic process. In this section, the size of the population is increased to do a more comprehensive search of the solution space with the expectation that the accuracy would increase. A larger population would mean that more generations might be needed for convergence. Thus, the number of generations was also raised to 100 in a bid to allow the GA search to converge. In this simulation, the size of the population was raised from 10 to 16. This was possible for all the data sets except for the hepatitis data set. The Pentium III computer used was unable to process the program. A reason for this could be that an increase in the population would mean that more computer resources and memory has to be allocated for execution of the program. Moreover, the fact that the hepatitis data set has the largest number of attributes means that more resources have to be used to carry out the classification. Therefore, for the hepatitis data set, the results obtained are based on a population size of 14. The results of the simulation are shown in Table 11. It has to be noted that the increase in population size was in relation to the correlation-based GA-SVM hybrid. As seen from the results, the increase in population size helps to improve the average clas-
sification accuracy for all the data sets, except for the Iris data set which showed a very slight decrease. Increasing the population size enabled the GA to search the solution space more thoroughly. When this is done, the chance of the algorithm being trapped in a local optimum is reduced and encourages a more detailed search for the global optimum. More points are covered in the search and thus a better result is achieved. In addition, it can be seen that the standard deviation of the runs have reduced for most of the data sets. The implication is that the increase in population size also enhances the stability of the classifier. However, the only negative aspect of increasing the population size is that the GA takes a longer time to compute the values for each generation. 6. Conclusions This paper has proposed a hybrid evolutionary algorithm for attribute selection in data mining. The GA-SVM hybrid incorporates the stochastic nature of genetic algorithms together with the vast capability of support vector machines in the search for an optimal set of attributes. The eradication of the redundant attributes using the GA-SVM hybrid improves the quality of the data sets and enables better classification of future unseen data. The proposed GA-SVM hybrid was validated upon 5 data sets obtained from UCI machine learning repository. Results collated have shown that the proposed hybrid is able to produce a high average classification accuracy that is comparable or better than some of the established classifiers in the data mining community. The simulations carried out also showcase the statistical consistency of the GA-SVM hybrid, which is evident from the histogram analysis and box plots. Secondary improvements to the hybrid included the utilization of a correlation measure to improve the average fitness of a chromosome population. The results obtained verify that the substitution of weaker chromosomes based on the correlation measure improved the hybrid’s classification ability. This was observed from the higher classification accuracy attained upon testing on the same UCI data sets. The stability of the classifier was also enhanced as ascertained by the low variance of the results collected. The analysis hitherto has thus demonstrated the viability of the GA-SVM hybrid as a good classifier when the irrelevant attributes are removed.
8630
K.C. Tan et al. / Expert Systems with Applications 36 (2009) 8616–8630
Acknowledgements The authors would like to thank the developers of Waikato Environment for Knowledge Analysis (WEKA) and the Library for Support Vector Machines (LIBSVM) for the provision of the open source code. References Benitez, J. M., Castro, J. L., Mantas, C. J., Rojas, F. (2001). A neuro-fuzzy approach for feature selection. In Joint 9th IFSA world congress and 20th NAFIPS international conference (Vol. 2, pp. 1003-8). Breiman, L., Friedman, J. H., Olshen, R. A., & Stone, C. J. (1984). Classification and regression trees. Wadsworth International Group: Belmont, CA. Burges Christopher, J. C. (1998). A tutorial on support vector machines for pattern recognition. Data Mining and Knowledge Discovery, 2(2), 121–167. Caruana, R., & Freitag, D. (1994). Greedy attribute selection. In Proceedings of the eleventh international conference on machine learning (pp. 28–36). Chakraborty, B. (2002). Genetic algorithm with fuzzy fitness function for feature selection. In Proceedings of the IEEE international symposium on industrial electronics (Vol. 1, pp. 315–319). Chambers, J. M., Cleveland, W. S., Kleiner, B., & Turkey, P. A. (1983). Graphical methods for data analysis. Pacific, CA: Wadsworth and Brooks/Cole. Chang, Y. H., Zheng, B., Wang, X. H., & Good W. F. (1999). Computer-aided diagnosis of breast cancer using artificial neural networks: Comparison of backpropagation and genetic algorithms. In Proceedings of the international joint conference on neural networks, Washington, DC, USA (Vol. 5, pp. 3674–3679). Fayyad, U. (1997). Data mining and knowledge discovery in databases: Implications for scientific databases. In Proceedings of the ninth international conference on scientific and statistical database management (pp. 2–11). Frank, E., Witten, I. H. (1998). Generating accurate rule sets without global optimization. In Proceedings of the fifteenth international conference machine learning (ICML’98) (pp. 144–151). Ginsberg, M. L. (1993). Essentials of artificial intelligence. Morgan Kaufmann Publishers. Hall, M. A. (1999). Correlation-based feature selection for machine learning. University of Waikato. Hearst, M. A., Schölkopf, B., Dumais, S., Osuna, E., & Platt, J. (1998). Trends and Controversies – Support Vector Machines. IEEE Intelligent Systems, 13, 18–28. Hruschka, E. R., & Ebecken, N. F. F. (2003). A feature selection Bayesian approach for extracting classification rules with a clustering genetic algorithm. Applied Artificial Intelligence, 17, 489–506. Ishibuchi, H., Nakashima, T., & Murata, T. (2001). Three-objective genetic-based machine learning for linguistic rule extraction. Information Sciences, 136, 109–133. John, G. H, Kohavi, R., & Pfleger, K. (1994). Irrelevant features and the subset selection problem. In Proceedings of the eleventh international machine learning conference (pp. 121–129). New Brunswick, NJ: Morgan Kaufman. John, G. H., & Langley, P. (1995). Estimating continuous distributions in Bayesian classifiers. Proceedings of the eleventh conference on uncertainty in artificial intelligence. San Mateo: Morgan Kaufman. pp. 338–345.
Kishore, J. K., Patnaik, L. M., Mani, V., & Agrawal, V. K. (2000). Application of genetic programming for multicategory pattern classification. IEEE Transactions on Evolutionary Computation, 4(3), 242–258. Kohavi, R., & John, G. (1996). Wrappers for feature subset selection. Artificial intelligence, Special issue on relevance, 97, 273–324. Lanzi, P. L. (1997). Fast feature selection with genetic algorithms: A filter approach. IEEE International Conference on Evolutionary Computation, 25, 537–540. Liu, H., & Motoda, H. (1998). Feature selection for knowledge discovery and data mining. Boston: Kluwer Academic Publishers. Mangasarian, O. L. (2001). Data mining via support vector machines. University of Wisconsin: Computer Sciences Department. Martin-Bautista, M. J., Vila, M.-A. (1999). A survey of genetic feature selection in mining issues. In Proceedings of the 1999 congress on evolutionary computation (Vol. 2, pp. 13–21). Mendes, R. R. F., Voznika, F. B., Freitas A. A. and Nievola, J. C. 2001. Discovering fuzzy classification rules with genetic programming and co-evolution. In Principles of data mining and knowledge discovery (Proceedings of fifth European conference, PKDD 2001) – lecture notes in artificial intelligence (Vol. 168, pp. 314–325). Springer-Verlag. Michie, D., Spiegelhalter, D. J., & Taylor, C. C. (1994). Machine learning, neural and statistical classification. London: Ellis Horwood. Mukkamala, S., Janoski, G., & Sung, A. (2002). Intrusion detection using neural networks and support vector machines. In Proceedings of the 2002 international joint conference on neural networks (Vol. 2, pp. 1702–1707). Pappa, G. L., Freitas, A. A., Kaestner, C. A. A. (2002). A multiobjective genetic algorithm for attribute selection. In Proceedings of the fourth international conference on recent advances in soft computing (RASC-2002) (pp. 116–121). Berlin: Springer. Quinlan, J. R. (1992). C4.5: Programs for machine learning. San Mateo, CA: Morgan Kaufmann. Russell, S. J., & Norvig, P. (1995). Artificial intelligence: A modern approach. New Jersey: Prentice Hall. Setiono, R., & Liu, H. (1997). NeuroLinear: From neural networks to oblique decision rules. Neurocomputing, 17, 1–24. Shi, D., Shu, W., & Liu, H. (1998). Feature selection for handwritten Chinese character recognition based on genetic algorithms. IEEE international conference on systems, man, and cybernetics, 5, 4201–4206. Tan, K. C., Tay, A., Lee, T. H. & Heng, C. M. (2002). Mining multiple comprehensible classification rules using genetic programming. In Proceedings of the IEEE congress on evolutionary computation, Honolulu, Hawaii (pp. 1302–1307). Tan, K. C., Yu, Q., & Lee, T. H. (2005). A distributed coevolutionary classifier for knowledge discovery in data mining. IEEE transactions on systems, man and cybernetics: Part C (applications and reviews), 35(2), 131–142. Vapnik, V. (1995). The nature of statistical learning theory. New York: SpringerVerlag. Wong, M. L. (2001). A flexible knowledge discovery system using genetic programming and logic grammars. Decision Support Systems, 31, 405–428. Wong, M. L., Lam, W., Leung, K. S., Ngan, P. S., & Cheng, J. C. Y. (2000). Discovering knowledge from medical databases using evolutionary algorithms. IEEE Engineering in Medicine and Biology Magazine, 19(4), 45–55.