Network Biology, 2012, 2(1):38-44
Article
A Java software for drawing graphs WenJun Zhang School of Life Sciences, Sun Yat-sen University, Guangzhou 510275, China; International Academy of Ecology and Environmental Sciences, Hong Kong E-mail:
[email protected],
[email protected]
Received 7 May 2011; Accepted 13 August 2011; Published online 1March 2012 IAEES
Abstract In this study the software for drawing graphs, which is run as a Java application, was described. It can be freely downloaded and run on Windows platforms. The software can be used to draw directed, undirected, cyclic and acyclic graphs. Keywords software; graph; drawing; Java.
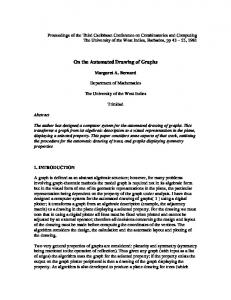
1 Introduction Java is an object oriented and platform independent programming language. It has been widely used in the development of various biological software (Liu and Zhang, 2011; Zhang, 2011a, b). A lot of network and graph related software have been developed using Java, e.g., NetLogo, Repast, et al. In the following sections, the software for drawing various graphs, running as a Java application, is described (Zhang, 2012). It can be freely downloaded and run on various Windows platforms. 2 Array Storage of Graph The graph in present study is stored in computer using a method, Two Linear Array (Zhang, 2012). For instance, the directed graph in Fig. 1 can be expressed in Two Linear Array as: S1=(v1, v1, v1, v2, v2, v2, v3, v3, v5, v6), S2=(v2, v4, v3, v2, v3, v4, v4, v4, v5, v6), S=(1, 1, -1, 3, 1, 1, 2, -2, 3, 0).
Fig. 1 A directed graph (Zhang, 2012) IAEES
www.iaees.org
Network Biology, 2012, 2(1):38-44
39
Changing the graph in Fig. 1 to undirected graph, its Two Linear Array representation will be: S1=(v1, v1, v1, v2, v2, v2, v3, v4, v5, v6), S2=(v2, v3, v4, v2, v3, v4, v4, v3, v5, v6), S=(1, -1, 1, 3, 1, 1, 2, 2, 5, 4). where 1 denotes there is only one edge between two vertices, and the edge is a positive-directed edge; -1 denotes there is only one edge between two vertices, but the edge is a negative-directed edge; 2 denotes two parallel edges; 3 denotes self-loop; 4 denotes isolated vertex, and 5 denotes the self-loop of an isolated vertex. 3 Java Implementation The software was implemented based on JDK 1.1.8, in which several classes were included (http://www.iaees.org/publications/software/index.asp; In BioNetAnaly). The following are Java codes, netGenerator, re-invented from JDK and Zhang (2007), for generating a graph (Zhang, 2012): //Loading example: java netGenerator netgenerator //where netgenerator is the name of table in the database “dataBase” /*Graph is stored in Two Arrays Listing. s1[1-e]: from-vertex; s2[1-e]: to-vertex; tt[1-e]: 1 if it is a forward edge; -1 is for backward edge; 4 if s1[i]=s2[i], i.e., the vertex is an isolated vertex with no self-loop; 2: parallel edges; 3: self-loop for non-isolated vertex; 5: an isolated vertex with self-loop. */ public class netGenerator { public static void main(String[] args){ String tablename=args[0]; readDatabase readdata=new readDatabase("dataBase",tablename, 3); int mm=readdata.m; String s1[]=new String[mm+1]; String s2[]=new String[mm+1]; int s[]=new int[mm+1]; for (int i=1;i