Geophysical Research Letters RESEARCH LETTER 10.1002/2015GL065811 Key Points: • First seismic study of incipient Okavango rift crust • Symmetric crustal thinning of 4–5 km indicating pure shear • Rifting initiation by relative motion of cratonic blocks
Correspondence to: S. S. Gao,
[email protected]
Citation: Yu, Y., K. H. Liu, C. A. Reed, M. Moidaki, K. Mickus, E. A. Atekwana, and S. S. Gao (2015), A joint receiver function and gravity study of crustal structure beneath the incipient Okavango Rift, Botswana, Geophys. Res. Lett., 42, doi:10.1002/2015GL065811.
Received 16 AUG 2015 Accepted 4 OCT 2015 Accepted article online 8 OCT 2015
A joint receiver function and gravity study of crustal structure beneath the incipient Okavango Rift, Botswana Youqiang Yu1 , Kelly H. Liu1 , Cory A. Reed1 , Moikwathai Moidaki2 , Kevin Mickus3 , Estella A. Atekwana4 , and Stephen S. Gao1 1 Geology and Geophysics Program, Missouri University of Science and Technology, Rolla, Missouri, USA, 2 Department of
Physics, University of Botswana, Gaborone, Botswana, 3 Department of Geography, Geology, and Planning, Missouri State University, Springfield, Missouri, USA, 4 Boone Pickens School of Geology, Oklahoma State University of Agriculture and Applied Science, Stillwater, Oklahoma, USA
Abstract Rifting incorporates the fundamental processes concerning the breakup of continental lithosphere and plays a significant role in the formation and evolution of sedimentary basins. In order to decipher the characteristics of rifting at its earliest stage, we conduct the first teleseismic crustal study of one of the world’s youngest continental rifts, the Okavango Rift Zone (ORZ), where the magma has not yet breached the surface. Results from receiver function stacking and gravity modeling indicate that the crust/mantle boundary beneath the ORZ is uplifted by 4–5 km, and the initiation of the ORZ is closely related to lithospheric stretching. Possible decompression melting of the subcrustal lithosphere occurs beneath the ORZ, as evidenced by a relatively low upper mantle density based on the gravity modeling. 1. Introduction The Cenozoic Okavango Rift Zone (ORZ) is located at the southernmost extent of the southwest branch of the East African Rift System [Reeves, 1972; Modisi et al., 2000] and hosts the Okavango Delta which is the largest inland alluvial fan in the world. Based upon early studies of gravity anomalies and persistent seismicity [Reeves, 1972; Reeves and Hutchins, 1975; Scholz et al., 1976; Leseane et al., 2015] as well as sparse heat flow measurements in the vicinity of the rift zone [Ballard et al., 1987], the ORZ is believed to be a modern incipient rift forming in an intraorogenic environment along the margins of the Paleoproterozoic Magondi Belt, Paleo-Mesoproterozoic Rehoboth Province, and the Neoproterozoic Damara Belt (Figure 1) [Begg et al., 2009]. Toward the northwest and east lie the Archean Congo and Kalahari cratons, respectively. Convergence of these cratons throughout the Mesoproterozoic and the earliest Neoproterozoic (∼1 Ga) led to crustal shortening and uplift within the mobile belts situated along the cratonic margins [Weckmann, 2012]. Uplift-induced erosion synchronous with isostatic equilibration has contributed to the reduction of crustal thicknesses within the region of the ORZ since the final stages of Precambrian orogenic activity [Vauchez et al., 1997]. The onset of rifting in the ORZ possibly started in the Holocene around the time between 120 ka and 40 ka [Modisi et al., 2000; Moore and Larkin, 2001], and consequently, the ORZ is an ideal locale to investigate rifting mechanisms at the incipient stage. The surface expression of the ORZ is mostly obscured by unconsolidated Quaternary sediments, including Kalahari alluvium and lacustrine deposits [e.g., Cooke and Verstappen, 1984; Ringrose et al., 2005]. A half-graben similar in shape to what is observed within mature rift zones with a throw of ∼200–300 m along the major border faults (Figure 1) has developed within the ORZ [Modisi et al., 2000; Kinabo et al., 2008]. The localization and development of rift-associated faults were concluded to be primarily controlled by preexisting basement fabrics [Kinabo et al., 2008], and the initiation of rifting was proposed to be supported by hydrothermal metasomatism and strain weakening of the lithospheric mantle, based on a recent gravity/magnetic study [Leseane et al., 2015]. The absence of active involvement from a lower mantle plume is evidenced by a normal mantle transition zone thicknesses [Yu et al., 2015a] and by the NE-SW oriented seismic azimuthal anisotropy that is observed across much of Southern Africa [Yu et al., 2015b].
©2015. American Geophysical Union. All Rights Reserved.
YU ET AL.
The magnitude, lateral extent, geometry, and deformation style of crustal thinning beneath mature rifts have been investigated extensively using a variety of seismic and potential field techniques. Those investigations provided essential information regarding rifting mechanism (e.g., passive versus active rifting), extension style OKAVANGO CRUSTAL STRUCTURE
1
Geophysical Research Letters
10.1002/2015GL065811
Figure 1. Topography map showing the distribution of seismic stations and major tectonic units of the study area. SAFARI stations are represented by red triangles, and the white triangles indicate the SASE stations used in the study. Gray lines represent the boundaries of major tectonic units modified from McCourt et al. [2013]. The gray area with white boundaries is the Okavango Delta, in which the dashed lines show major faults and the thick dashed lines indicate main border faults (modified from Modisi et al. [2000] and Kinabo et al. [2008]). The dashed line along the profile indicates the cross sections shown in Figure 3, and the blue star marks the origin (zero distance) of the cross sections. The inset is a topographic map showing the East African Rift System. The blue lines in the inset represent the rift axes, and the black rectangle indicates the study area.
(e.g., pure shear versus simple shear), as well as the role that magmatic intrusions played in rift development [e.g., Thybo and Nielsen, 2009]. Teleseismic investigations of the crust beneath incipient rifts such as the ORZ, on the other hand, are rare. Here we present results from the first joint receiver function and gravity study of the ORZ and provide evidence for strain localization and accommodation in the crust by incorporating results from recent geological and geophysical investigations.
2. Data and Methods In the summer of 2012, we installed 17 broadband seismic stations traversing the ORZ along a NW-SE profile in the northern half of Botswana (Figure 1). This array, which recorded continuously over a 2 year period, is part of the Seismic Arrays for African Rift Initiation (SAFARI) experiment [Gao et al., 2013], which is a component of an interdisciplinary project funded by the United States National Science Foundation (NSF) Continental Dynamics Program. The seismic data set used in the study was expanded with the addition of data from three nearby seismic stations belonging to the Southern African Seismic Experiment (SASE) [Nair et al., 2006]. Data from teleseismic events with epicentral distances greater than 30∘ were used. The cutoff magnitude (Mc ) was defined as Mc = 5.2 + (Δ − 30.0)∕(180.0 − 30.0) − D∕700.0, where Δ is the epicentral distance in degrees and D is the focal depth in kilometers [Liu and Gao, 2010]. All the seismograms were windowed 20 s before and 300 s after the theoretical first arrival based on the IASP91 Earth model and prefiltered by a band-pass filter with corner frequencies of 0.04 and 0.8 Hz. 2.1. H-𝜿 Stacking The filtered seismograms with signal-to-noise ratio of 4.0 or greater on the radial component were selected to generate receiver functions (RFs) following the improved frequency domain water level deconvolution [Clayton and Wiggins, 1976] procedure of Ammon [1991] with a water level of 0.05. The resulting radial RFs for each of the stations were visually verified to reject those with weak first P arrivals or with anomalously large arrivals in the P wave coda. The remaining high-quality RFs were moveout corrected and stacked in a grid search procedure (hereafter referred to as H-𝜅 stacking) to determine the optimal pair of crustal thickness (H) and V p /V s (𝜅 ) corresponding to the maximum stacking amplitude [Zhu and Kanamori, 2000]. In order to conduct H-𝜅 stacking, an average crustal P wave velocity of 6.5 km/s is used based upon a previous seismic YU ET AL.
OKAVANGO CRUSTAL STRUCTURE
2
Geophysical Research Letters
10.1002/2015GL065811
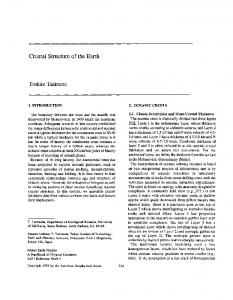
Figure 2. RFs from station B08TS. (a) Original reverberatory RFs plotted against back azimuth. The red line is the result of simple time domain stacking of all the receiver functions. (b) H-𝜅 plot based on the conventional H-𝜅 stacking using RFs in Figure 2a. The black dot shows the maximum stacking amplitude. (c) RFs after removing the reverberations using the approach of Yu et al. [2015c]. (d) H-𝜅 plot from H-𝜅 stacking using the filtered RFs in Figure 2c.
refraction study in the Kaapvaal Craton [Durrheim and Green, 1992]. The optimal pair of crustal thickness and velocity ratio correspond to the maximum stacking amplitude on the H-𝜅 plot (see Figure 2 for an example). The mean and standard deviation of the optimal crustal parameters for each station were estimated using the bootstrap resampling approach [Efron and Tibshirani, 1986] with 20 iterations. Some of the RFs from three stations located near the border faults demonstrate systematic azimuthal variations in the arrival time of the P-to-S conversions from the Moho. For those stations, we separate the observed RFs into two groups according to the back azimuth (BAZ) of the events. P waves from the first group of events traverse the Moho on the northwest side of the faults and thus sample the rift zone, while the second group samples the area to the SE of the ORZ. H-𝜅 stacking was applied separately to these two groups of RFs to identify possible lateral variations of crustal properties across the main faults [e.g., Liu and Gao, 2010]. Note that no reliable results were obtained at station B07DX for the SE group. Stations B08TS, B15MW, and B17CI situated in the interior of the Okavango Delta are underlain by a low-velocity unconsolidated sedimentary layer, which is indicated by strong reverberations in the resulting RFs (see Figure 2a for an example). Such reverberations are caused by P-to-S conversions (Ps), and their multiples associated with the strong impedance contrast across the bottom of the low-velocity sedimentary layer and can completely mask the Ps phases from the Moho [Yu et al., 2015c], making it impossible for the conventional H-𝜅 stacking approach to find the correct crustal parameters (Figure 2b). For such stations, we apply the recently developed reverberation-removal technique [Yu et al., 2015c] to isolate the Moho phases (Figure 2c) for the purpose of accurately determining the crustal thickness and V p /V s (Figure 2d). 2.2. Migration Profile In order to demonstrate the high quality of the RFs and the resulting robust Moho, as well as to identify potential intracrustal discontinuities, we convert the RFs into depth series traces by stacking moveout-corrected RFs for each station using the common-conversion point procedure [Dueker and Sheehan, 1998] in the depth range of 15–60 km with an interval of 0.5 km. This procedure requires P and S wave velocities as functions of depth in order to calculate the moveout times. For the crustal portion, crustal thicknesses and velocity ratios obtained from H-𝜅 stacking and a crustal P wave velocity of 6.5 km/s are used, while standard IASP91 velocities are applied for the mantle part of the depth series. YU ET AL.
OKAVANGO CRUSTAL STRUCTURE
3
Geophysical Research Letters
10.1002/2015GL065811
Figure 3. Cross sections of the results projected to the thick dashed line in Figure 1. (a) Elevation. (b) Observed (red crosses) and calculated (solid line) Bouguer gravity anomalies from two-dimensional forward modeling. (c) Results of gravity modeling. The triangles are the resulting Moho depths from H-𝜅 stacking, and the values are densities in g/cm3 . (d) Migrated and depth-converted RFs. The triangles represent the crustal thickness beneath the stations obtained from H-𝜅 stacking. (e) Station-averaged crustal V p /V s measurements.
2.3. Gravity Modeling The Bouguer gravity anomaly data were obtained from a variety of sources including the National Geospatial and Imaging Agency, the Botswana Geological Survey, and a detailed (2 km station spacing) survey in northern Botswana [Leseane et al., 2015]. The 1967 International Gravity Formula [Morelli, 1976] was employed to merge the data set of Bouguer gravity anomalies, which was further corrected using sea level as a datum and 2.67 gm/cm3 as a reduction density. Given the lack of significant topographic variations (Figure 3a), terrain corrections were not applied. The merged data set contains over 39,000 stations with a station spacing between 1 and 4 km over the entire country and is sufficient for regional gravity studies and modeling. Forward modeling of the observed Bouguer gravity (Figure 3c) anomaly was conducted by employing RF-determined H and 𝜅 values as constraints. The final gravity model was determined by varying the RF-determined crustal thicknesses by ∼10% and densities estimated from previous East African Rift gravity models [e.g., Simiyu and Keller, 2001] by ∼20%. During the modeling process it was determined that the gravity minimum over the ORZ could be caused by a low-density region in the lower crust or upper mantle where the densities should be at least 3% lower than the surrounding regions. The exact placement of the low-density region cannot be determined by gravity modeling alone. However, based on the elevated Curie isotherms under the ORZ [Leseane et al., 2015], this low-density body is most likely in the uppermost mantle. YU ET AL.
OKAVANGO CRUSTAL STRUCTURE
4
Geophysical Research Letters
10.1002/2015GL065811
Table 1. Observations of H and k for the 20 Stations Station
Latitude (deg)
H (km)
Longitude (deg)
k
N
Area A (Congo Craton) B12SS
−18.746
22.197
46.2 ± 0.5
1.77 ± 0.01
69
B13NX
−18.579
21.994
46.6 ± 0.4
1.75 ± 0.01
75
B14MH
−18.295
21.792
45.8 ± 0.3
1.80 ± 0.01
91
B06ORa
−19.901
23.527
43.6 ± 0.5
1.85 ± 0.02
36
B06ORb
−19.901
23.527
37.5 ± 0.3
1.88 ± 0.01
81
B07DXb
−20.549
22.649
40.5 ± 0.5
1.95 ± 0.02
47
Area B (Okavango Rift Zone)
B08TSc
−20.164
22.459
37.8 ± 1.0
1.78 ± 0.03
52
B09NK
−19.663
22.194
41.8 ± 0.2
1.71 ± 0.01
71
B10PP
−18.913
22.543
39.9 ± 0.5
1.89 ± 0.02
74
B11ETa
−19.016
22.316
39.3 ± 0.5
1.82 ± 0.01
34
B11ETb
−19.016
22.316
44.3 ± 0.5
1.72 ± 0.01
45
B15MWc
−19.631
23.827
34.0 ± 0.4
1.81 ± 0.01
61
B17CIc
−19.294
22.909
38.8 ± 0.5
1.77 ± 0.02
36
Area C (Rehoboth Province + Magondi Belt) B03SL
−21.121
24.764
40.8 ± 0.3
1.76 ± 0.01
92
B04KH
−20.474
24.514
42.6 ± 0.7
1.79 ± 0.02
86
B05MO
−20.218
24.132
40.7 ± 0.2
1.76 ± 0.01
85
Area D (Kalahari Craton) B01KR
−22.238
26.718
43.7 ± 0.2
1.81 ± 0.01
66
B02LT
−21.393
25.581
42.8 ± 0.3
1.73 ± 0.01
84
B1665
−22.825
27.229
42.6 ± 0.3
1.75 ± 0.01
88
SA64
−22.969
26.202
41.5 ± 0.4
1.73 ± 0.02
31
SA65
−22.818
27.222
42.7 ± 0.3
1.75 ± 0.01
36
SA66
−21.900
26.373
44.7 ± 0.4
1.81 ± 0.02
32
a Using RFs with back azimuth between 45 and 225∘ . b Using RFs with back azimuth of 0–45∘
and 225–360∘ .
c After applying the reverberation-removal technique.
3. Results The resulting crustal thicknesses range from 34.0 km beneath the SE border faults to 46.6 km beneath the northern end of the profile with a mean value of 41.7 ± 3.1 km, and the V p /V s ranges from 1.71 to 1.95 with an average of 1.79 ± 0.06 (Figure 3 and Table 1). As the crustal structure is closely related to the basement terranes, we divided the results into four groups based on the location of the geological boundaries [Hanson, 2003; Begg et al., 2009; McCourt et al., 2013] (Figure 3a). Area A belongs to the Archean Congo Craton and has an average H of 46.2 ± 0.4 km and 𝜅 of 1.78 ± 0.03. Area B is mainly superimposed by the Neoproterozoic Damara Belt where the ORZ is located. The resulting average crustal thickness of area B is 39.8 ± 3.0 km, while the 𝜅 measurements have a mean value of 1.82 ± 0.08. Area C is composed of the Paleoproterozoic to Mesoproterozoic Magondi Belt and Rehoboth Province and has an average H of 41.4 ± 1.0 km and 𝜅 of 1.77 ± 0.02. Area D is mainly in the Neoarchean Limpopo Belt comprising a major intracratonic mobile belt within the Kalahari Craton. H-𝜅 stacking from six stations in Area D results in a mean crustal thickness of 43.0 ± 1.1 km and V p /V s of 1.76 ± 0.04. An estimated 5 km difference of the crustal thickness across the main border faults of the ORZ is observed, indicating that the influence of the border faults may extend to the Moho. Relative to the immediate surrounding areas (Figure 3c), the crust beneath the ORZ is thinned by 4–5 km, which corresponds to a stretching factor of about 1.1 over an original ∼45 km crust. The low amount of thinning is consistent with the insignificant surface expression of the ORZ relative to mature rifts (Figure 3a). YU ET AL.
OKAVANGO CRUSTAL STRUCTURE
5
Geophysical Research Letters
10.1002/2015GL065811
The resulting gravity model shows a lower density (3.18 g/cm3 ) mantle (Figure 3c) underlying the region of thinned ORZ crust. High-density (2.80–2.85 g/cm3 ) bodies located near the surface, which may be fragments of an ancient Paleoproterozoic volcanic island arc or suites of metamorphic granulite complexes [Hanson, 2003], are required to explain local Bouguer gravity anomaly maxima. Regional low-density anomalies are modeled near the southern edge of the Congo Craton as Mesoproterozoic granite complexes [Hanson, 2003].
4. Discussion and Conclusions The resulting crustal thicknesses and V p /V s values are in general agreement with those obtained by previous RF studies, which mainly focused on the adjacent Kalahari Craton. Three of the SAFARI stations in area D reported results consistent with nearby SASE stations [e.g., Nair et al., 2006]. Recently, Kachingwe et al. [2015] investigated the crustal structure of Southern Africa using data from 39 stations by conducting H-𝜅 stacking and jointly inverting the RFs with Rayleigh wave phase and group velocities. One (station MAUN of the Congo Craton network) of the stations is cosited with SAFARI station B06OR. They obtained a crustal thickness of 44 km from the H-𝜅 stacking of five RFs and 38 km by jointly inverting P wave RFs with surface wave dispersion curves. Interestingly, the former value is similar to the crustal thickness that we obtained using 36 RFs from the southeast, while the latter is almost identical to that obtained using 81 RFs from the northwest (Table 1). The observations provide important information about crustal composition and possible modification by orogenic and rifting processes. Based on studies of crustal rocks, Holbrook et al. [1992] concluded that the V p /V s of common rock types varies from 1.63 to 2.08, wherein low (1.76), intermediate (1.76–1.81), and high V p /V s (>1.81) values are characteristic of felsic, intermediate, and mafic compositions, respectively. The resulting 𝜅 values observed in the study area generally fall within the range of 1.76–1.81, which corresponds to an intermediate crustal composition. Crust with an intermediate composition was observed beneath the Proterozoic orogenic provinces as well as the surrounding Archean terranes, implying that localized post-Precambrian orogenic and rifting episodes of Southern Africa [Hanson, 2003] did not significantly modify the bulk composition of the continental crust. The boundaries of the ORZ are characterized by relatively high 𝜅 values (Figure 3e). They may possibly be related to fluid-filled deep fractures, which reduce the S wave velocity more significantly than P wave and lead to an increased V p /V s . A potential intracrustal discontinuity is observed beneath the stations in the ORZ at the depth of about 25 km (Figure 3d). The positive polarity of this arrival suggests that it represents the upper boundary of a high-velocity body in the lower crust. This observation, if confirmed by additional study such as the active source seismic and magnetotelluric components of the interdisciplinary project, could indicate the existence of magmatic intrusions into the lower crust. Such an intrusion has been suggested beneath the Baikal rift to compensate for crustal thinning [Thybo and Nielsen, 2009]. The uplifted Moho along the profile is approximately symmetric and centered along the rift axis (Figure 3), satisfying a model invoking pure shear extension [McKenzie, 1978]. Similar models have been proposed to fit the observations beneath the Baikal [Gao et al., 2004], southern Kenya [Birt et al., 1997], and northern Rhine Graben [Brun et al., 1992; Thybo and Artemieva, 2013] rift zones. Finally, the low-density mantle lithosphere beneath the ORZ can be explained by the existence of partial melting induced by lithospheric stretching associated with the incipient rift, leading to shallow Curie isothermal depths, which are about 8–15 km based on three-dimensional inversion of aeromagnetic data [Leseane et al., 2015]. Further rifting can lead to the development of volcanism, similar to that observed in more developed continental rifts such as the Rio Grande [Perkins and Anthony, 2011] and Kenya rifts [Biggs et al., 2009]. In summary, for the first time, the crustal structure beneath the incipient Okavango Rift is imaged using RF stacking and gravity modeling. The resulting crustal thickness shows that the crust beneath the ORZ is thinned by 4–5 km and infilled by relative low-density mantle materials possibly caused by decompression melting. The low level of crustal stretching, when combined with the absence of an active mantle plume, elevated topography, as well as results from previous investigations of mantle anisotropy and mantle transition zone thermal structure, is consistent with a “passive rifting” model in which transtensional movements between Archean cratonic blocks along ancient orogenic belts drive the initiation and early-stage development of the Okavango Rift Zone. YU ET AL.
OKAVANGO CRUSTAL STRUCTURE
6
Geophysical Research Letters Acknowledgments We appreciate the equipment and logistical support from the Program for Array Seismic Studies of the Continental Lithosphere (PASSCAL) Instrument Center and thank the Incorporated Research Institutions for Seismology (IRIS) Data Management Center for archiving both the SAFARI and SASE seismic data sets used in the study. Constructive reviews by E.Y. Anthony, an anonymous reviewer, and Editor M.E. Wysession greatly improved the manuscript. Field assistance provided by Angela M. Reusch from PASSCAL and Keletso Kaisara from the University of Botswana is greatly appreciated. Y.Y. was partially funded by the China Scholarship Council under contract 2011645027. This study is supported by NSF grants 1009946 and 1321656 to S.G. and K.L. and 1255233 to E.A. BPSoG contribution 2015-28.
YU ET AL.
10.1002/2015GL065811
References Ammon, C. J. (1991), The isolation of receiver effects from teleseismic P waveforms, Bull. Seismol. Soc. Am., 81, 2504–2510. Ballard, S., H. N. Pollack, and N. J. Skinner (1987), Terrestrial heat flow in Botswana and Namibia, J. Geophys. Res., 92, 6291–6300, doi:10.1029/JB092iB07p06291. Begg, G. C., et al. (2009), The lithospheric architecture of Africa: Seismic tomography, mantle petrology, and tectonic evolution, Geosphere, 5, 23–50, doi:10.1130/GES00179.1. Biggs, J., E. Y. Anthony, and C. J. Ebinger (2009), Multiple inflation and deflation events at Kenyan volcanoes, East African Rift, Geology, 37, 979–982, doi:10.1130/G30133A.1. Birt, C. S., P. K. H. Maguire, M. A. Khan, H. Thybo, G. R. Keller, and J. Patel (1997), The influence of pre-existing structures on the evolution of the southern Kenya Rift Valley—Evidence from seismic and gravity studies, Tectonophysics, 278, 211–242, doi:10.1016/S0040-1951(97)00105-4. Brun, J. P., M.-A. Gutscher, R. Blum, and DEKORP-ECORS teams (1992), Deep crustal structure of the Rhine Graben from DEKORP-ECORS seismic-reflection data: A summary, Tectonophysics, 208, 139–147, doi:10.1016/0040-1951(92)90340-C. Clayton, R. W., and R. A. Wiggins (1976), Source shape estimation and deconvolution of teleseismic bodywaves, Geophys. J. Int., 47, 151–177, doi:10.1111/j.1365-246X.1976.tb01267.x. Cooke, H. J., and H. T. Verstappen (1984), The landforms of the western Makgadikgadi Basin in northern Botswana, with a consideration of the chronology of the evolution of Lake Palaeo-Makgadikgadi, Z. Geomorphol., 28, 1–19. Dueker, K. G., and A. F. Sheehan (1998), Mantle discontinuity structure beneath the Colorado Rocky Mountains and High Plains, J. Geophys. Res., 103(B4), 7153–7169, doi:10.1029/97JB03509. Durrheim, R. J., and R. W. Green (1992), A seismic refraction investigation of the Archaean Kaapvaal Craton, South Africa, using mine tremors as the energy source, Geophys. J. Int., 108, 812–832, doi:10.1111/j.1365-246X.1992.tb03472.x. Efron, B., and R. Tibshirani (1986), Bootstrap methods for standard errors, confidence intervals, and other measures of statistical accuracy, Stat. Sci., 1, 54–75. Gao, S. S., K. H. Liu, and C. Chen (2004), Significant crustal thinning beneath the Baikal rift zone: New constraints from receiver function analysis, Geophys. Res. Lett., 31, L20610, doi:10.1029/2004GL020813. Gao, S. S., et al. (2013), Seismic arrays to study African rift initiation, Eos Trans. AGU, 94(24), 213, doi:10.1002/2013EO240002. Hanson, R. E. (2003), Proterozoic geochronology and tectonic evolution of Southern Africa, Geol. Soc. Spec. Publ., 206, 427–463, doi:10.1144/GSL.SP.2003.206.01.20. Holbrook, W. S., W. D. Mooney, and N. I. Christensen (1992), The seismic velocity structure of the deep continental crust, in Continental Lower Crust, edited by D. M. Fountain, R. Arculus, and R. W. Kay, pp. 21–43, Elsevier, New York. Kachingwe, M., A. Nyblade, and J. Julia (2015), Crustal structure of Precambrian terranes in the Southern African subcontinent with implications for secular variation in crustal genesis, Geophys. J. Int., 202(1), 533–547, doi:10.1093/gji/ggv136. Kinabo, B. D., J. P. Hogan, E. A. Atekwana, M. G. Abdelsalam, and M. P. Modisi (2008), Fault growth and propagation during incipient continental rifting: Insights from a combined aeromagnetic and Shuttle Radar Topography Mission digital elevation model investigation of the Okavango Rift Zone, northwest Botswana, Tectonics, 27, TC3013, doi:10.1029/2007TC002154. Leseane, K., E. A. Atekwana, K. L. Mickus, M. G. Abdelsalam, E. M. Shemang, and E. A. Atekwana (2015), Thermal perturbations beneath the incipient Okavango Rift Zone, northwest Botswana, J. Geophys. Res. Solid Earth, 120, 1210–1228, doi:10.1002/2014JB011029. Liu, K. H., and S. S. Gao (2010), Spatial variations of crustal characteristics beneath the Hoggar swell, Algeria, revealed by systematic analyses of receiver functions from a single seismic station, Geochem. Geophys. Geosyst., 11, Q08011, doi:10.1029/2010GC003091. McCourt, S., R. A. Armstrong, H. Jelsma, and R. B. M. Mapeo (2013), New U-Pb SHRIMP ages from the Lubango region, SW Angola: Insights into the Palaeoproterozoic evolution of the Angolan Shield, southern Congo Craton, Africa, J. Geol. Soc. London, 170, 353–363, doi:10.1144/jgs2012-059. McKenzie, D. (1978), Some remarks on the development of sedimentary basins, Earth Planet. Sci. Lett., 40, 25–32, doi:10.1016/0012-821X(78)90071-7. Modisi, M. P., E. A. Atekwana, A. B. Kampunzu, and T. H. Ngwisanyi (2000), Rift kinematics during the incipient stages of continental extension: Evidence from the nascent Okavango rift basin, northwest Botswana, Geology, 102, 363–376. Moore, A. E., and P. Larkin (2001), Drainage evolution in south-central Africa since the breakup of Gondwana, S. Afr. J. Geol., 104, 47–68, doi:10.2113/104.1.47. Morelli, C. (1976), Modern standards for gravity surveys, Geophys. J. Int., 45, 198–199, doi:10.1111/j.1365-246X.1976.tb00322.x. Nair, S. K., S. S. Gao, K. H. Liu, and P. G. Silver (2006), Southern African crustal evolution and composition: Constraints from receiver function studies, J. Geophys. Res., 111, B02304, doi:10.1029/2005JB003802. Perkins, D., and E. Y. Anthony (2011), The evolution of spinel lherzolite xenoliths and the nature of the mantle at Kilbourne Hole, New Mexico, Contrib. Mineral. Petrol., 162, 1139–1157, doi:10.1007/s00410-011-0644-1. Reeves, C. V. (1972), Rifting in the Kalahari?, Nature, 237, 95–96, doi:10.1038/237095a0. Reeves, C. V., and D. G. Hutchins (1975), Crustal structures in central Southern Africa, Nature, 254, 408–410, doi:10.1038/254408a0. Ringrose, S., P. Huntsman-Mapila, A. B. Kampunzu, W. Matheson, W. Downey, B. Vink, C. Coetzee, and C. Vanderpost (2005), Sedimentological and geochemical evidence for palaeo-environmental change in the Makgadikgadi subbasin, in relation to the MOZ rift depression, Botswana, Palaeogeogr. Palaeoclimatol. Palaeoecol., 217, 265–287, doi:10.1016/j.palaeo.2004.11.024. Scholz, C. H., T. A. Koczynski, and D. G. Hutchins (1976), Evidence for incipient rifting in Southern Africa, Geophys. J. Int., 44(1), 135–144, doi:10.1111/j.1365-246X.1976.tb00278.x. Simiyu, S. M., and G. R. Keller (2001), An integrated geophysical analysis of the upper crust of the southern Kenya rift, Geophys. J. Int., 147, 543–561, doi:10.1046/j.0956-540x.2001.01542.x. Thybo, H., and I. M. Artemieva (2013), Moho and magmatic underplating in continental lithosphere, Tectonophysics, 609, 605–619, doi:10.1016/j.tecto.2013.05.032. Thybo, H., and C. A. Nielsen (2009), Magma-compensated crustal thinning in continental rift zones, Nature, 457, 873–876, doi:10.1038/nature07688. Vauchez, A., G. Barruol, and A. Tommasi (1997), Why do continents break-up parallel to ancient orogenic belts?, Terra Nova, 9, 62–66, doi:10.1111/j.1365-3121.1997.tb00003.x. Weckmann, U. (2012), Making and breaking of a continent: Following the scent of geodynamic imprints on the African continent using electromagnetics, Surv. Geophys., 33, 107–134, doi:10.1007/s10712-011-9147-x. Yu, Y., K. H. Liu, M. Moidaki, C. A. Reed, and S. S. Gao (2015a), No thermal anomalies in the mantle transition zone beneath an incipient continental rift: Evidence from the first receiver function study across the Okavango Rift Zone, Botswana, Geophys. J. Int., 202, 1407–1418, doi:10.1093/gji/ggv229.
OKAVANGO CRUSTAL STRUCTURE
7
Geophysical Research Letters
10.1002/2015GL065811
Yu, Y., S. S. Gao, M. Moidaki, C. A. Reed, and K. H. Liu (2015b), Seismic anisotropy beneath the incipient Okavango Rift: Implications for rifting initiation, Earth Planet. Sci. Lett., 430, 1–8, doi:10.1016/j.epsl.2015.08.009. Yu, Y., J. Song, K. H. Liu, and S. S. Gao (2015c), Determining crustal structure beneath seismic stations overlying a low-velocity sedimentary layer using receiver functions, J. Geophys. Res. Solid Earth, 120, 3208–3218, doi:10.1002/2014JB011610. Zhu, L., and H. Kanamori (2000), Moho depth variation in Southern California from teleseismic receiver functions, J. Geophys. Res., 105(B2), 2969–2980, doi:10.1029/1999JB900322.
YU ET AL.
OKAVANGO CRUSTAL STRUCTURE
8