Using Angler Characteristics and Attitudinal Data to Identify Environmental Preference Classes: A Latent-Class Model∗ Edward Morey
†
Department of Economics, University of Colorado-Boulder
Jennifer Thacher
‡
Department of Economics, University of New Mexico
William Breffle Stratus Consulting Inc.
October 7, 2004
1
Abstract A latent-class model of environmental preference groups is developed and estimated with only the answers to a set of attitudinal questions. Economists do not typically use this type of data in estimation. Group membership is latent/unobserved. The intent is to identify and characterize heterogeneity in the preferences for environmental amenities in terms of a small number of preference groups. The application is to preferences over the fishing characteristics of Green Bay. Anglers answered a number of attitudinal questions, including the importance of boat fees, species catch rates, and fish consumption advisories on site choice. The results suggest that Green Bay anglers separate into a small number of distinct classes with varying preferences and willingness to pay for a PCB-free Green Bay. The probability that an angler belongs to each class is estimated as function of observable characteristics of the individual. Estimation is with the E-M (expectation-maximization) algorithm, a technique new to environmental economics that can be used to do maximum-likelihood ∗
This paper has been developing quite a while and been improved in the process
by many people. We particularly want to thank Vic Adamowicz, J.R. DeShazo, Bill Provencher, Rebecca Moore, the referees, and Trudy Cameron for great comments on earlier versions. The paper has also benefited from comments of participants at the HERE conference, the CREE conference, and a seminar at the University of Arizona Department of Agricultural Economics. † Corresponding author:
[email protected]; Department of Economics, University of Colorado-Boulder, 256 UCB, Boulder CO 80309-0256. ‡ Edward Morey and Jennifer Thacher are equal authors and rotate authorship across articles.
2
estimation with incomplete information. As explained, a latent-class model estimated with attitudinal data can be melded with a latentclass choice model.
Key Words: attitudinal data, E-M algorithm, latent-class attitudinal model, latent-class joint model
Surveys often include a significant number of attitudinal questions. Consider an example Likert-scale attitudinal question from a survey of Green Bay anglers: On a scale from 1 to 5 where 1 means ”Not at all Bothersome” and 5 means ”Very Bothersome”, answer the following question. For the fish you would like to fish for in the waters of Green Bay, how much would it bother you, if at all, if PCBs resulted in the following fish consumption advisory: Do not eat. Environmental economists generally do not view answers to attitudinal questions as data one uses in an econometric model to estimate preferences. Instead, they often view these questions as a “warm-up” exercise or use the answers to support the econometric results. But, attitudinal data can provide significant information about the existence and composition of different preference groups. In this paper, we assume that the answers to attitudinal questions are expressions of exogenous well-behaved preferences, meaning that individuals can rank states of the world. Preferences are latent, or unobserved, and both 3
choices (actual and hypothetical) and answers to attitudinal questions are manifestations of those unobserved preferences. A latent-class model of preferences is developed and estimated with only attitudinal data. We denote this model the LCA (latent-class attitudinal) model. One goal of this paper is to demonstrate the type of information about preferences that can be obtained from just attitudinal data. We also explain how an LCA model can be melded with a latent-class model estimated with only choice data (LCC model) to achieve a joint model (LCJ model), where the estimated parameters are jointly determined by both the choice and attitudinal data. An LCA model allows the researcher to identify and characterize various preference groups. It can be used to identify ”strong environmentalists” and ”weak environmentalists”, ”avid fishers” and ”non-avid fishers”, or campers that care more about characteristic x and less about characteristic y. These results are easily explained to policy makers; they are also a type of information that a researcher would like to know early in a valuation study. The model can be used to identify a group of individuals who reject the scenario and possibly help explain why they reject it. It can also be used to determine if there is a segment of the population that does not value some environmental ”improvement”. If there is such a segment, the model can be used to estimate the size of this group. This type of information would be incredibly useful for researchers to have before collecting valuation data. Many of us equate estimating preferences with estimating the values of preference parameters in utility functions or, in discrete-choice models, the 4
parameters in conditional-indirect utility functions. The LCA model presented does not do this, and some might consider this a fatal flaw. We don’t for three reasons: (1) Non-economists do not think about preferences and preference heterogeneity in terms of conditional-indirect utility functions. The ability to describe these concepts using data that non-economists understand will have a direct influence on public and legal opinion. (2) Attitudinal information informs and directs how one should model and estimate utility parameters with choice data. (3) The LCA model can be estimated jointly with an LCC model. Latent-class models assume that each individual belongs to one and only one group but that group membership is latent. Different preference groups will answer attitudinal questions differently. Since the number of groups is estimated and no restrictions are placed on membership probabilities, latentclass models allow for a wider range of preference heterogeneity without imposing a restrictive functional form on the distribution of the preference parameters. For example, one does not have to assume the parameters are normally distributed or or vary only deterministically as a function of observable characteristics of the individual. Based on the answers to a set of attitudinal questions, the LCA model estimates the unconditional probability that a random individual belongs to group c. The unconditional probability can be a function of covariates such as gender. The model also estimates the conditional probability that an individual belongs to group c. This is the probability that an individual belongs to group c as a function of covariates and her answers to a set of 5
attitudinal questions. The conditional membership probabilities often place each respondent in a group with a high degree of certainty. Latent-class models are common in the social sciences but not in environmental economics. Standard references include Titterington et al. (1985), Bartholomew and Knott (1999), and Wedel and Kamakura (2000). A few researchers in other fields have estimated latent-class models with attitudinal data (Clogg and Goodman, 1984; McCutcheon, 1987; McCutcheon and Nawojcyzk, 1995; De Menezes and Bartholomew, 1996; Yamaguchi, 2000; Eid et al., 2003; Thacher et al., 2003). Applications of latent–class models in environmental economics are rare; examples include Boxall and Adamowicz (2002), Provencher et al. (2002), Scarpa et al. (2003), and Shonkwiler and Shaw (2003). Provencher et al. (2002) is a latent-class model of site choice estimated with only choice data, not attitudinal data. The Boxall and Adamowicz (2002) latent-class model is estimated with both attitudinal and choice data. It is to our knowledge the first environmental application of the latent-class approach for estimating preferences over environmental commodities that uses attitudinal data. The approach outlined in this paper assumes that what people do and say are manifestations of underlying stable preferences. That is, revealed preference data, stated preference data, stated-frequency responses, votes, and expressions of attitudes are manifest variables. These types of data each provide insights and information about underlying latent preferences. We assume that group membership is exogenous and that the probability of giving a particular level of response to an attitudinal question is a function 6
of one’s group. In contrast, Boxall and Adamowicz (2002) assume that the probability that an individual belongs to a particular preference group is a function of his answers to the attitudinal questions; that is, they make group membership a function of how one answers the questions. This is a subtle but important distinction between their work and ours. Given our assumption that expressed attitudes are a manifestation of latent, exogenous preferences, we believe that Boxall and Adamowicz (2002) has the causality arrow going in the wrong direction. Like us, causality from preferences to responses/choice is assumed by Provencher et al. (2002) and in a non-environmental application by Ben-Akiva et al. (2002). The application identifies and characterizes groups of anglers that differ in their preferences towards the characteristics of Green Bay. These fishing characteristics include the presence of species-specific fish consumption advisories (FCAs).1 Possible FCA levels are a ”do not eat”, a ”eat no more than once a month”, and a ”eat not more than once a week”. The data used for the study is a set of Likert-style attitudinal questions asked as part of a larger survey about Green Bay fishing. Anglers reported on a scale of one to five the importance of the following characteristics in their fishing choices: boat launch fees, species’ catch rates, and species’ FCAs. Respondents also answered questions on the degree to which they were bothered by different levels of FCAs, the degree to which they were willing to pay higher fees for 1
Between the late 1950s and the mid-1970s, local paper companies released PCBs into
the Lower Fox River of Wisconsin which were later redistributed into the Lower Fox River and Green Bay (Sullivan et al., 1983). PCBs bio-accumulate in fish and wildlife.
7
various site improvements, and how they felt Green Bay compared to other fishing sites. These questions asked anglers about the relative magnitudes of their preference parameters for these site characteristics. Our results indicate that Green Bay anglers divide into a small number of distinct groups with respect to preferences over the characteristics of Green Bay. The probability of belonging to a particular preference group varies significantly as a function of gender, boat ownership, retirement status, and income. The results allow us to broadly characterize each group in terms of their relative preferences over the fishing characteristics of Green Bay such as FCAs and catch rates by species. Looking ahead, our preferred model suggests anglers split into three groups: an FCA group that cares most about FCAs and least about monetary costs; a Perch/Walleye group that cares more about these species, both in terms of their FCAs and catch rates; and a Catch and Fee group that cares relatively little about the FCAs.
A latent-class attitudinal model
Assume the population consists of C different preference groups. An individual’s preference group is latent. The researcher observes (xi , zi ); xi is the set of individual i’s answers to the attitudinal questions (the individual’s response pattern), and zi is a vector of observed characteristics of the individual (covariates) such as gender and retirement status. 8
The model estimates four types of probabilities: Pr(c : zi ), Pr(c : zi |xi ), πqs|c , and Pr(xi : zi ). Pr(c : zi ) is the unconditional probability that individual i belongs to group c given his observable characteristics. For example, it represents the probability that a retired man belongs to a particular group. It is an unconditional probability because it does not depend on his specific answers to the attitudinal questions. All individuals with the same observed characteristics possess the same unconditional probability of belonging to group c. Once estimated, these unconditional membership probabilities allow the researcher to predict the probability that an individual belongs to each group on the basis of his observable characteristics. P r(c : zi |xi ) is the conditional membership probability. It represents the probability that individual i belongs to group c as a function of his characteristics and conditional on his answers to the attitudinal questions. Taking into account an individual’s answers to the attitudinal questions allows more accurate prediction of that individual’s group membership. Whether the conditional or the unconditional membership probabilities are most useful depends on the researcher’s goals and constraints and how the results will be utilized. πqs|c is the probability that an individual in group c answers level s to attitudinal question q. These response probabilities are the foundation of the latent-class model and a function of an individual’s preferences; one wants to estimate the response probabilities and number of preference groups that best explain the observed response patterns. As shown below, both the conditional and unconditional membership probabilities are functions of the 9
response probabilities. Pr(xi : zi ) is the probability that an individual with characteristics zi has the response pattern xi . These are functions of the response probabilities, πqs|c . Let xiqs = 1 if individual i’s answer to attitudinal question q is level s and 0 otherwise. The latency of group membership causes the response patterns of individuals from the same group to be more correlated with each other than with individuals in other groups; individuals of the same type answer similarly. Latent-class models assume that once you have controlled for group membership, attitudinal responses are independent. Given this, the probability of individual i0 s response pattern, Pr(xi : zi ), is a mixture of C multinomials. Pr(xi : zi ) =
C X
Pr (c : zi ) Pr(xi |c) =
c=1
where Pr(xi |c) =
C X c=1
QQ QS q=1
xiqs s=1 (πqs|c )
Pr(c : zi )
Q S Y Y
(πqs|c )xiqs ,
(1)
q=1 s=1
is the probability of the individual’s
response pattern conditional on being in group c. Weighting each by the unconditional probability of belonging to that group and summing gives the probability of observing an individual’s response pattern. The estimation goal is to find the parameter values that best explain the response patterns; that is, find the πqs|c and Pr(c : zi ) that maximize the log
10
likelihood function, ln L =
N X
ln [Pr(xi : zi )]
i
=
N X
" ln
C X
subject to
S P
πqs|c = 1 and
s=1
Pr(c : zi )
c=1
i C P c=1
Q S Y Y
# xiqs
(πqs|c )
,
(2)
q=1 s=1
Pr (c : zi ) = 1.
The πqs|c that maximize Equation 2 are: N P
πqs|c =
P r (c : zi |xi ) xiqs
i=1 N P
.
(3)
P r (c : zi |xi )
i=1
The denominator in Equation 3 estimates the number of individuals in group c. The numerator is the number of times sample respondents answer level s to question q, each weighted by the conditional membership probability that the individual is in group c. That is, the numerator estimates the number of individuals in group c that answered level s to question q. Therefore Equation 3 is an estimate of the proportion of times individuals in group c answered level s to question q. The elements of zi can either vary continuously or take a finite number of discrete values. Consider the discrete case.2 If zi has a finite number of elements and each element can take only a finite number of values, then there will be a finite number of characteristic types. Let M denote the number of characteristic types. For example, if gender is the only characteristic, there are two types (M = 2). In our application, M = 16. 2
The continuous case is discussed in the appendix.
11
If the elements of zi each take only a finite number of discrete values, the group membership probabilities, Pr(c : zi ), that maximize Equation 2 are: Nz 1 Xi Pr(c : zi |xi ), Pr(c : zi ) = Nzi i=1
(4)
where Nzi is the number of individuals in the sample with the same characteristics as individual i. The right-hand side of Equation 4 is simply the average conditional membership probability for group c for all individuals with the same characteristics as individual i. If no individual characteristics P are included, Pr(c) = N1 N i=1 P r(c|xi ). Note that in Equations 3 and 4, πqs|c and Pr(c : zi ) are both functions of the conditional membership probabilities, Pr(c : zi |xi ), which are not known. Given this there is not sufficient information in Equations 3 and 4 to obtain the maximum likelihood estimates of πqs|c and Pr(c : zi ). The E-M (expectation-maximization) algorithm is a technique that can be used to do maximum likelihood estimation in the case of incomplete information (Dempster et al., 1977; Bartholomew and Knott, 1999).3 The E-M algorithm is seeing increased use in economics (Arcidiacono and Jones, 2003). The basic idea of the E-M algorithm is that one replaces unobserved in3
Estimates can also be obtained using the Newton-Raphson method. Compared to
the Newton-Raphson method, the E-M algorithm converges more slowly. However, unlike the Newton-Raphson method, convergence to at least a local optimum is guaranteed. An additional strength of the E-M algorithm for this model is that closed form solutions exist. The E-M algorithm is typically used more frequently than the Newton-Raphson method (Wedel and Kamakura, 2000).
12
formation with its expected value and then conducts maximum likelihood estimation as if these expectations were correct. The maximum likelihood estimates can be then used to update the original expectations. The E-M algorithm consists of two steps: an expectation step and a maximization step. In the expectation step, one calculates the expected value of the unobserved information. In the maximization step, one conducts maximum likelihood estimation as if the true value of the unobserved information was the expected value of the unobserved information. Based on the results of the maximization step, one then updates the expected value of the unobserved information. The process continues until the change in the log-likelihood function becomes very small. One can see from looking at Equations 3 and 4 that the unobserved information is the conditional membership probabilities, the Pr(c : zi |xi ). Therefore, in the maximization step, the E-M algorithm finds the values of the response probabilities, πqs|c , and the unconditional group membership probabilities, Pr(c : zi ), that maximize the expected likelihood function. It is an expected likelihood function because one treated the expected values of the conditional membership probabilities as if they were the true values. Note that by Bayes theorem the conditional membership probabilities are: Q QS xiqs Pr(c : zi ) Q q=1 s=1 (πqs|c ) . (5) Pr(c : zi |xi ) = Pr(xi : zi ) One can use Equation 5 to update the conditional membership probabilities, Pr(c : zi |xi ). One would again maximize the log-likelihood function assuming the expected conditional membership probabilities are correct. The 13
process continues iteratively until the value of the likelihood function changes by less than a small, predetermined percentage.4 In more detail, the estimation proceeds as follows. Begin with a guess of the N values of Pr(c : zi |xi ) on the first iteration. Then using Equations 3 and 4, calculate Pr(c : zi ) and πqs|c . Utilize Equation 5 to calculate the new Pr(c : zi |xi ). Repeat the process using the new Pr(c : zi |xi ). At each iteration, calculate the ln L using Equation 2. One typically follows this process with numerous initial starting values of Pr(c : zi |xi ) so as to guard against mistakenly identifying a local maximum (Bartholomew and Knott, 1999).5 Note that for discrete covariates the maximum likelihood estimates are derived without using simulation or any numerical optimization techniques.6 4
For example, we used 1e − 7. We used 100 random starts. 6 The results for this paper were programmed in Gauss. Code and the data for this 5
application is available at http://www.unm.edu/˜jthacher. A number of packages are also available for latent-class analysis, including MLLSA, LEM, SPSS, and Latent Gold.
14
The LCA model versus other latent group methods
There are other methods for characterizing or grouping individuals on the basis of their answers to a set of attitudinal questions. The most common are factor analysis and cluster analysis.7 . For introductions to cluster analysis, or ”market segmentation” as it is commonly called, see Everitt (1993) and Kaufman and Rousseeuw (1990). In our context, factor analysis would statistically analyze interrelationships between the responses to numerous attitudinal questions and explain a significant proportion of the variation in these responses in terms of a number of latent factors. The subsequent factor variables are often expressed as having a standard normal distribution. In our application one might expect resultant factors related to concern over PCBs and importance of catch. Each individual’s factor scores are then estimated. Using factor analysis, individuals are thereby characterized in terms of a small number of continuous variables. Recent applications in environmental economics include Connelly et al. (2001), Falconer (2001), McClelland (2001), and Boxall and Adamowicz (2002). When attitudinal questions naturally fall into distinct groups (such as questions about FCAs or questions about catch), factor analysis often does 7
For introductions to factor analysis, see Kim and Mueller (1978a), Kim and Mueller
(1978b), and Hatcher (1994)
15
not add much additional insight about the latent categories; it is merely a solution for multicollinearity. Furthermore, the final values of the factor variables can be sensitive to the method used to compute them (e.g., orthogonal versus oblique rotations of factor ”scores”). Factor analysis assumes a continuous standard normal distribution for the factors. LCA can provide a discrete approximation to any distribution so it does not impose a distribution per se. Cluster analysis, like latent-class analysis, allocates respondents into a finite number of groups on the basis of their answers to the set of questions. The objective is to sort individuals such that they are ”significantly” alike within groups, but dissimilar across groups. Most cluster analysis is ”hierarchical”, which is also similar to our latent-class approach: the resultant classification has an increasing number of nested groups. A popular type of cluster analysis is ”agglomerative”, which starts with single-element clusters (i.e., individual observations) and gradually fuses them together into larger clusters. As clusters are combined, the researcher looks for large jumps between values in the ”agglomeration schedule” (see (Connelly et al., 2001)). Large jumps between clusters combined with sufficient sample size within each cluster (e.g., n > 30) are often used as a basis to justify a clustering scheme. This approach can be arbitrary. Unlike the latent-class approach, group membership in conventional cluster analysis is deterministic in the sense that individuals are allocated to groups as if the researcher knows with 100% certainty to which group the individual belongs.8 This is a strong 8
Certain methods, such as fuzzy cluster analysis, do allow for membership in multiple
16
assumption and is probably the weakest characteristic of cluster analysis. Finally, different clustering techniques may result in the identification of different clusters. Applications of cluster analysis in environmental economics include Chipman and Helfrich (1988), Holland and R.B. (1992), and Connelly et al. (2000). See Aldrich et al. (2004) for a comparison of the latent-class, cluster analysis, and canonical correlation techniques for identifying latent groups.
Application: preferences of Green Bay anglers
The LCA model is used to learn about the preferences of anglers over Green Bay site characteristics. The site characteristics examined are catch rates by species, FCA levels by species, and launch fees. Up to four preference groups are allowed (C = 4). The target population is active Green Bay anglers who purchase Wisconsin fishing licenses in eight Wisconsin counties near Green Bay; most Green Bay fishing days are by these anglers. A three-step procedure was used to collect data from a random sample of individuals in the target population. First, a random sample of anglers was drawn from lists of 1997 license holders in the eight counties. Second, a telephone survey was completed in late 1998 and early 1999; telephone contact was attempted with 4, 597 anglers; 3, 190 groups (Wedel and Kamakura, 2000).
17
anglers completed the telephone survey for a 69% response rate. Anglers who had participated in open-water fishing in the Wisconsin waters of Green Bay in 1998 (the target population) were recruited for a follow-up mail survey: 92% of the open-water Green Bay anglers agreed to participate in the mail survey (the third and final survey wave). Of the 820 anglers who were mailed the survey, 647 (79%) completed and returned the survey. Seven individuals who did not answer any of the attitudinal questions were dropped, leaving a sample size of 640. In terms of the socioeconomic information collected during the phone survey, the Green Bay anglers who completed the mail survey do not differ significantly from those who did not. The answers to 15 attitudinal questions are used in the estimation.9 Table I shows the attitudinal question topics. The four species examined were perch, walleye, bass, and trout/salmon. The actual questions are included in the appendix. [Table I] Following Bandeen-Roche et al. (1997), the appropriate number of preference groups is determined before covariates are included. This model is subsequently expanded to include individual covariates. The log-likelihood function for a C-class model for the data in this sample is:10 9
Two attitudinal questions about FCAs and catch rates were eliminated because they
were very similar to two of the other questions. 10 Fourteen of the questions were five-scale questions; one was a seven-scale question. Missing answers, which constituted 2% of all responses, were coded by a separate dummy.
18
ln L =
640 X i=1
ln
" C X c=1
Pr(c : zi )
14 Y 6 Y
(πqs|c )xiqs
q=1 s=1
8 Y
# (πs|c )xis .
(6)
s=1
Characterizing the latent groups
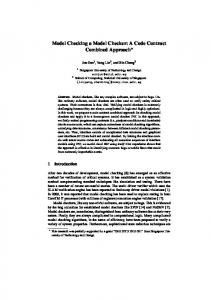
In this section we examine estimated group composition assuming two, three, and four groups. A question of interest is how the types of groups identified change as the number of groups change. Groups can be characterized by examining the predicted response probabilities, ranking the importance of characteristics within a group, and comparing average responses across groups. [Figure 1] Figure 1 reports the average responses to the attitudinal questions for the anglers most likely to belong to each group for the two, three, and four group models.11 Unless otherwise noted, group averages within a model are significantly different at the five percent level. Figure 1 emphasizes differences across groups. For example, in the two group model, the FCA group considers all the FCAs significantly more important than does the Perch/Walleye group. 11
For this purpose, individuals were assigned to the class to which they had the highest
conditional probability of belonging. The rankings are the same if the predicted average importance scores, rather than the actual responses, are used.
19
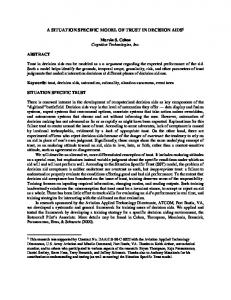
Figure 2 uses the data from Figure 1 to show how the groups disaggregate as the number of groups increases from two to four, and reports the unconditional probability that an angler belongs to each group, Pr(c : zi ). It emphasizes difference among attribute importance within a group. Each box shows the ranking by group of the average importance of Green Bay attributes. Items on different lines represent significantly different average responses. For example, assuming two groups, there is a 29% probability that an angler belongs to the FCA group. The FCA group ranks the FCAs for all species as significantly more important than catch rates and the boat fee as relatively unimportant. Although the FCAs are most important to this group, it particularly cares about those associated with walleye and then perch. The Perch/Walleye group primarily cares about catch rates and FCAs for perch and walleye; members of this group care relatively little about FCAs and catch rates for other species. [Figure 2] As more preference groups are allowed, groups split out from the Perch/Walleye class, but retain an emphasis on perch and walleye. For example, with three groups a Catch and Fee group emerges; anglers in this group care primarily about the catch rates for perch and walleye and the boat fee. They care significantly less about the FCAs for these species. The FCA group remains relatively intact. The Perch/Walleye group also persists but decreases in size from 71% to 23% as the number of groups increases. Allowing four groups results in a group that cares about trout and a group that cares primarily about the fee. 20
Regardless of the number of groups, commonalities exist across the groups. Most anglers primarily care about fishing for walleye and perch. As expected, every group considers the ”Do Not Eat” FCA the worst type of FCA. All groups except the Catch and Fee and Fee, Low Interest are significantly more willing to pay a higher fee in return for PCB-free fish than in return for a higher catch rate.
Choosing the number of groups A number of criteria are used to assess the degree of fit of the model. Definitively determining the correct number of preference groups requires a statistical test of whether one model provides a better fit than a competing model with a different number of groups. Unfortunately, no statistical test exists; one can examine test statistics but their distributions are unknown. For example, one can calculate the likelihood ratio statistic for C versus C + 1 groups but the regularity conditions used to prove that this statistic has a χ2 distribution are violated (Wedel and Kamakura, 2000). Previous research has used a number of indicators for picking the optimal number of groups, recognizing that these indicators are only suggestive (Wedel and Kamakura, 2000). One type of indicator is an information criterion. Information criteria compare the improvement in the degree of fit with the number of extra parameters. The best fitting model minimizes the information criteria. One possible test is the consistent Akaike information criterion, CAICJ = −2 ln L + PJ ln(N + 1), where N is the sample
21
size Bozdogan (1987).12 Two more conservative information criteria are the corrected Akaike information criterion, AICC , and the Bayesian information criterion, BIC, each of which has a more stringent penalty for the number of extra parameters (Hurvich and Tsai, 1989; Schwarz, 1978). The formula for these criteria are: AICC = AIC + 2(PJ + 1)(PJ + 2)/(N − PJ − 2) and BIC = − ln L + 0.5PJ ln N, where N is the number of respondents. If the number of groups fits the data well, the estimated conditional membership probabilities should be close to 1 or 0; individuals should be assigned to one of the groups with high probability. The degree to which the model successfully separates individuals into groups can be measured using the entropy statistic, PN PC Es = 1 −
i=1
c=1
− Pr(c : zi |xi ) ln [Pr(c : zi |xi )] , N ln (C)
(7)
This measure is bounded by 0 and 1. A value close to 1 indicates the model successfully separates individuals into groups (Wedel and Kamakura, 2000). Researchers also investigate bootstrapping techniques to determine the number of groups (Collins et al., 1993; von Davier, 1997).13 In this analysis, the entropy statistic, CAIC, BIC, and AICC scores are presented. It is expected that the best model will have a high entropy score and low CAIC, BIC, and AICC scores relative to other models. 12
Although the AIC score is often used, it does not adequately penalize for the large
number of parameters involved in increasing the number of classes. 13 With this approach, one examines the fit of the expected versus observed response frequencies and then uses a bootstrap method to calculate the distribution of the fit statistic.
22
[Table II] Table II shows the log likelihood, information criteria, and entropy scores for the one-, two-, three-, and four-group models. The one-group model provides the worst fit. It does, however, perform significantly better than a random allocation model where only one group is assumed and individuals are assumed to have an equal probability of giving any response. As noted earlier, no definitive test for the number of groups exists. However, the extremely large differences in the log likelihood scores between the one- and multigroup models suggest that the assumption of preference homogeneity can be rejected. In the case of Green Bay fishing preferences it is inappropriate to assume strict preference homogeneity; individuals have different preferences for fishing attributes. Based on both the BIC and the CAIC criteria, the three-group model performs the best. This model also scores relatively high on the entropy measure, indicating that it successfully separates individuals into groups. Since both the BIC and the CAIC measures favor the three-group model and provide intuitive results, we selected the three-group model for discussion. Recall, however, the similar interpretations for the two, three, and four-group models; this suggests that the model is fairly robust. Table III shows some example predicted response probabilities for the three-group model. The FCA group is much more likely than other groups to consider a monthly FCA bothersome or very bothersome. FCA group members are also much more likely to consider FCAs for any of the species very important in choosing a fishing site. For example, with 91% probability 23
a member of the FCA group would say that the perch FCA is very important; the equivalent probabilities for the Perch/Walleye and Catch and Fee groups are 58% and 36%. [Table III]
A model with covariates Adding information on observable characteristics significantly improves the ability to predict an individual’s preference group. The lnL score for a nocovariate model is −13976.37; the lnL score for a model that includes retirement status, boat ownership, gender, and income level is −13962.80. Based on a likelihood ratio test, a model that includes information on these four covariates statistically dominates models that do not include all these covariates.14 [Table IV] Table IV reports the unconditional probabilities of group membership on the basis of the covariates. For example, a retired male who earns in excess of $50, 000 and owns a boat has a 39% probability of belonging to the FCA group, a 31% probability of belonging to the Catch and Fee group, and a 30% probability of belonging to the Perch/Walleye group. In contrast, if all else is equal and this individual earns less than $50, 000, the estimated probabilities are 50%, 20%, and 30%. All else equal, being retired increases the unconditional probability of 14
These tests are distributed χ2 since they are within a particular class.
24
belonging to the FCA group. Women are more likely than men to be in the FCA group. Earning less than $50, 000 increases the probability of belonging to the FCA group. Owning a boat decreases the probability of belonging to the Perch/Walleye group.
Discussion
What was learned from this application and what does it tell us about the use of the LCA? Perch and walleye are more important to anglers than the other species. Everyone would prefer a reduction in PCBs, but there is a lot of variation in the magnitude of that preference. The FCA group cares more about FCAs, independent of species, than they do about catch rates or fees, but this group is less than a third of the population of Green Bay anglers. The FCA group will most likely have the highest WTP for the elimination of FCA and would require the largest increase in catch rates to be made whole if PCBs are not removed. A Catch and Fee group, almost as large as the FCA group, is likely to have a much lower WTP for PCB removal, and would require a much smaller increase in perch and walleye catch rates to be made whole. Between these two groups is the largest group, more than half of the population. The Green Bay survey effort collected both attitudinal data and choice data. The types of choice data collected included the expected number of 25
fishing days to Green Bay under current conditions, and questions that asked, ”Would you prefer to fish Green Bay under conditions A or B”, where the alternatives varied in terms of FCAs, catch rates, and launch fees. Attitudinal data were collected both in the general telephone recruiting survey and in the mail survey sent only to Green Bay anglers. All of the stated-preference Green Bay choice questions were asked in the mail survey. The goal of the initial effort was to estimate defensible willingness-to-pay estimates for the absence of PCBs in Green Bay. In the assessment, no effort was made to use the answers to the attitudinal questions to estimate preferences. Rather, they were used to support the estimates of preference parameters generated solely with the choice data.
An LCA model was not estimated with the
attitudinal data from just the telephone survey. In the Green Bay case, with a few more attitudinal questions in the phone screener, we could have estimated an LCA model before the choice data were collected. Groups like those above would have emerged, but also groups of anglers who did not fish at Green Bay. Three things would have been accomplished: (1) Knowing the different attitudes and sizes of classes of nonGreen Bay anglers would provide an indication of how many of those anglers would be Green Bay anglers in the absence of FCAs for Green Bay. In other words, this information could help indicate how many non-current Green Bay anglers would be made better off by PCB removal. In the assessment, we estimated damages for only current Green Bay anglers. (2) It is likely that covariates would have been identified that helped explain who was a Green Bay angler. More detailed questions about these covariates could then be 26
asked in the second stage when the choice questions are asked. (3) The information obtained about preferences and how they differ could have been used to design more efficient Green Bay choice pairs. Consider an alternative outcome. While the LCA model reported above indicates that no group would be worse off by an absence of PCBs, one can imagine the case where LCA analysis shows that certain groups have concerns about PCB removal. Possible reasons for this include that they believe the proposed cleanup plan will not work, they truly do not care whether the fish are PCB contaminated, or they think there will be negative side-effects from conducting the removal. Armed with this information from an LCA model, one would ask different choice questions than if you knew that all groups approvied of the proposal for PCB removal. Little information about preferences is going to be obtained from those individuals who have concerns about cleanup if the choice questions asked assume proposed cleanup is a good and do not address these confounding factors. As another example of how the LCA model can be helpful in valuation work, consider a study on the value for U.S. monuments (Morey and Rossmann, 2003). This study found a good deal of strong but indirect evidence that preservation of monuments would make some individuals worse off: these individuals don’t like the ideas, events, or individuals the monuments represent. This possibility was not adequately anticipated when the choice questions were designed. Such a latent-class would have likely emerged if attitudinal data had been collected first and used to estimate an LCA model. Many environmental policies will have a group of individuals who 27
gain from policy, a group that loses, and an indifferent group, particularly when all of the general-equilibirum implications of the policy are taken into account. It is important to have an estimate of the size and nature of each group and a LCA model can provide it before any choice data is collected. LCA models also have the potential to be a tool in the search for individuals who reject the scenario and why. For example, one could ask perception questions about how successful the respondent feels the proposal will be in achieving its stated goal and then use an LCA model to identify likely protesters. Either individuals identified as protestors could be excluded from the model or this information could be incorporated into the estimated model itself.15 The answers to attitudinal questions play a large role in the defense of WTP estimates because they are easily understood by non-economists. The LCA model provides a systematic way of distilling the information in that data. Characterizing different groups and providing estimates of group size and predicted response probabilities is much more informative and compelling than simply pointing out how the answers to the attitudinal questions corroborate the parameter estimates obtained with the choice data. Most importantly attitudinal data are, in our opinion, data about preferences and should therefore be used in the estimation of preferences. The 15
For example, Flachaire et al. (2003) identify ”compliant” and ”non-compliant” respon-
dents through the use of open-ended attitudinal questions and incorporate these estimates into their valuation model. A similar model could be estimated using latent-class analysis to identify protestors.
28
LCA model presented is a first step in doing this. The next section explains how our LCA model can be melded with an LCC model to jointly estimate class probabilities, the probability of a particular response to a Likert-style attitudinal question, and the parameters in the conditional-indirect utility functions.
Combining a latent-class attitudinal model with traditional choice models Before presenting the joint model, we first review the LCC model.
The latent-class choice model A latent-class model estimated with only choice data assumes that the probability that individual i chooses alternative j in choice set k is a function of the individual’s group membership, c. Denote this group membership Pijkc . This probability is a function of the conditional indirect-utility functions for the alternatives in the choice set. The parameters in the conditional indirect functions are allowed to vary by group. Denote the parameters in the conditional indirect utility function for group c, βc . The LCC model estimates the number of groups and the βc . For the LCC model the likelihood function is: Lchoice =
" C Y X i
Pr(c : zi )
c=1
K Y
# rijk Pijkc
,
(8)
k=1
where zi are covariates and rijk is an indicator variable that takes a value of 1 if individual i chooses alternative j in choice set k and 0 otherwise. Pijkc is 29
typically a logit or probit probability. Provencher et al. (2002) is an extended application of this model. The LCC model incorporates heterogeneity and generates welfare estimates that vary by group for changes in the characteristics of the alternatives. However, if one accepts our assumption that attitudinal data provide information about preferences, estimates based solely on the choice data are not efficient. In our opinion, both stated attitudes and observed choices (either revealed or stated) are pieces of data that can be used to learn about preferences. For example, if we observe that a person fishes a great deal and this person tells you, ”I love to fish at this site because it is contaminant free”, we have two pieces of data that can be used to better understand this person’s preferences. Preferences and group membership are exogenous and determine how one answers the attitudinal questions. Given these assumptions, if one wants to learn the most about preferences, one should use all the manifest preference data, including choices and answers to attitudinal questions.
The LCJ model It is possible to specify a latent-class model that is estimated with attitudinal data and either stated preference choice data and revealed preference trip data or both. There are two main ways in which this could be accomplished: (1) simultaneously estimate both the attribute parameters and the latent-class probability parameters or (2) treat the estimated latent-class probabilities as given and incorporate into a typical choice model. 30
The intuition of the joint model is that the latent preference group to which an individual belongs will affect both his answers to the attitudinal questions and his choices. In a joint model, one estimates the parameters in the conditional indirect-utility function and the probability of an individual’s response pattern, both conditional on being a member of group c. The goal of a joint model is to estimate the parameters most likely to result in the observed attitudinal and choice data. The likelihood function is: L=
Y
f (xi , yi , c : zi ) ,
(9)
i
where xi represents attitudinal data, and yi represents stated preference or revealed preference data; f () is the joint density function over choices, response patterns, and group membership. Since group membership is unobserved, the best one can do is to model: " C # Y X L= Pr(c : zi ) Pr (xi , yi |c) . i
(10)
c=1
Assume, as is standard, that conditional on group membership, answers to the stated (revealed) preference and attitudinal questions are independent. The likelihood function is: " C # Y X L= Pr(c : zi ) Pr (xi |c) Pr (yi |c) . i
(11)
c=1
Using the previous notation and substituting in for each of the above probabilities, the likelihood function becomes: " C # Q S K Y X Y Y Y r ijk L= Pr(c : zi ) (πqs|c )xiqs Pijkc . i
c=1
q=1 s=1
31
k=1
(12)
The LCJ model allows an individual’s answers to the choice questions and attitudinal questions to all be correlated, as one would expect. But since the correlation is induced by the individual’s group membership (she belongs to the same group for every question), the responses become independent once one conditions on group. This joint model could be estimated in a number of ways. The simplest way would be to estimate the parameters sequentially; in other words, estimate the LCA model and then impose the estimated Pr(c : zi ) as fixed parameters in Equation 12. Both the attitudinal and the choice data are used, but not simultaneously, so the resulting parameter estimates are consistent but not efficient. This method of estimation is akin to sequentially estimated nested-logit models. The LCJ parameters could also be estimated simultaneously. Validity of the LCJ model can be investigated by comparing its results with a separate LCA model and a separate LCC model, all estimated with the same data set. For example, one could examine whether the number of groups and their makeups varied significantly depending on whether estimation was with attitudinal data alone or choice data alone.16
Making group membership deterministic in the choice model One benefit of latent-class models is that one is not forced to assume one knows the group to which an individual belongs. He or she belongs to 16
Thanks to Bill Provencher and Rebecca Moore for this suggestion.
32
one and only one group, but which group is unknown to the researcher.17 Instead, the researcher just knows the probability that an individual belongs to a particular group. However, if one is willing to use the results of an LCA model to deterministically allocate each individual to one group, modeling choices becomes much simpler. For example, estimation could be done using canned software rather than having to write specialized programs. Using the results from the LCA, each individual would be allocated to the group for which he had the largest conditional group membership probability. Given that in practice an individual’s conditional class probabilities are often in excess of 90%, this practice will often not be that distasteful. Once each respondent is assigned to a group, a number of different randomutility models can be estimated with only the choice data. One could separate the choice data by group and estimate a different random-utility model for each group. Alternatively, one could keep the data together and let the preference parameters, but not the error structure, vary by group. This second approach is akin to making a preference parameter a function of an observable characteristic such as gender. 17
In contrast, models with classic heterogeneity (making preference parameters deter-
minisitc functions of observed characteristics of the individual) put people in deterministic groups as a function of things like gender.
33
Summary
The primary goal of this paper was to demonstrate how attitudinal data, by itself, can be used in a latent-class framework to inform the researcher about a population’s preferences for an environmental commodity and how those preferences differ by groups. Using only the answers anglers provided to 15 attitudinal questions about the characteristics of Green Bay (catch rates by species, fish consumption advisories by species, and boat launch fees), a latent-class attitudinal model was estimated. The results indicate that all anglers would prefer that Green Bay had fewer PCBs but beyond that significant differences emerge. The probability of belonging to a particular preference group varies significantly as a function of gender, boat ownership, retirement status, and income. The results allow us to broadly characterize each group in terms of their relative preferences over the fishing characteristics of Green Bay. Our preferred model suggests anglers split into three groups: an FCA group that cares most about FCAs and least about monetary costs; a Perch/Walleye group that cares more about these species, both in terms of their FCAs and catch rates; and a Catch and Fee group that cares relatively little about the FCAs. The emphasis of the paper is on how the attitudinal data, rather than choice data, can be used in a latent-class framework. The underlying premises of this paper are that individuals have well-defined preferences, preferences
34
are latent, and both choices and answers to attitudinal questions are manifestations of those preferences. If this is true, it makes sense to use both the attitudinal data and the choice data to estimate preferences. Different methods for doing this were laid out in the paper. One method presented was a joint latent-class model that simultaneously estimated all the parameters using both choice data and attitudinal data. Another method used output from a latent-class attitudinal model to deterministically allocate individuals into groups and then used the choice data to estimate different preference parameters for each group.
A
Continuous covariates
Estimation is slightly more complicated when some of the elements of z vary continuously. In this case, rather than estimating the Pr(c : zi ) directly, one specifies Pr(c : zi ) as a function of some vector of class-specific parameters βc such P that 0 ≤ Pr(c : zi ) ≤ 1 and c Pr(c : zi ) = 1. A logit specification: eβc zi Pr(c : zi ) = PC , c = 1, ..., C/, βk zi e k=1
(13)
is convenient. In this case, one estimates the elements of β. Closed-form solutions for the β do not exist so a numerical optimization routine must be embedded in an E-M algorithm. Estimation proceeds as follows. Assume initial values for the (πqs|c ), denoted (πqs|c ){0} . Substitute these and Equation 13 into Equation 1 and then Equation
35
2 to obtain the conditional ln L: Q Y S N C β z X X Y c i e {0} (πqs|c )xiqs ln Lβ = ln PC β z i k k=1 e q=1 s=1 c=1 i=1
(14)
It is a function of only the data and the β. Using a numerical search method, find the β {0} that maximizes this conditional likelihood function. Use the β {0} and Equation 13 to calculate the Pr(c : zi ), denoted Pr(c : zi ){0} . Using these, the (πqs|c ){0} and Equation 5 calculate the Pr(c : zi |xi ){0} . Substitute the Pr(c : {1}
zi |xi ){0} into Equation 3 to calculate new πqs|c , denoted πqs|c . Substitute these {0}
for the (πqs|c ) in Equation 14 and find the β {1} that maximizes the updated ln LB . At each round, calculate ln L. As before, stop the iterations when the percentage change in ln L converges to some small, pre-specified number.
B
Attitudinal questions
1. On a scale from 1 to 7 where 1 means ”Much Worse” and 7 means ”Much Better”, how do you rate the quality of fishing on the water of Green Bay compared to other places you fish? 2. On a scale from 1 to 5 where 1 means ”Not at all Bothersome” and 5 means ”Very Bothersome”, answer the following question. For the fish you would like to fish for in the waters of Green Bay, how much would it bother you, if at all, if PCBs resulted in the following fish consumption advisories: (a) Eat not more than one meal a week.
36
(b) Eat not more than one meal a month. (c) Do not eat. 3. On a scale from 1 to 5 where 1 means ”Strongly Disagree” and 5 means ”Strongly Agree”, how do you feel about each of the following statements about boat launch fees? If you don’t fish from a boat, please think of the daily boat launch fee as a fee you would have to pay to fish the waters of Green Bay. (a) I would be willing to pay higher boat launch fees if catch rates were higher on the waters of Green Bay. (b) I would be willing to pay higher boat launch fees if the fish had no PCB contamination. 4. On a scale from 1 to 5 where 1 is ”Not at all important” and 5 is ”Very Important”, when you were making your choices in Q15 through Q34, how important were each of the following? (a) The average catch rate for yellow perch (b) The fish consumption advisory for yellow perch (c) The average catch rate for trout/salmon (d) The fish consumption advisory for trout/salmon (e) The average catch rate for walleye (f) The fish consumption advisory for walleye (g) The average catch rate for smallmouth bass
37
(h) The fish consumption advisory for smallmouth bass (i) Your share of the boat launch fee (or daily access fee if not fishing from a boat)
References
Aldrich, G., K. Grimsrud, and J. Thacher (2004). ‘Comparison of Methods to Identify Latent Groups: An Application to Environmental Ethics’. UNM Working Paper. Arcidiacono, P. and J. Jones (2003). ‘Finite mixture distributions, sequential likelihood, and the EM algorithm’. Econometrica, 71(3), 933–946. Bandeen-Roche, K., D. L. Miglioretti, S. L. Zeger, and P. J. Rathouz (1997). ‘Latent variable regression for multiple discrete outcomes’. Journal of the American Statistical Association, 92(440), 1375–1386. Bartholomew, D. and M. Knott (1999). Latent Class Models and Factor Analysis. Oxford University Press Inc., New York, second edition. Ben-Akiva, M., M. Walker, A. Bernardino, D. Gopinath, T. Morikawa, and A. Polydoropoulos (2002). ‘Integration of choice and latent variable models’. In H. Mahmassani, editor, In Perpetual Motion: Travel Behavior Re-
38
search Opportunities and Application Challenges. Pergamon, Amsterdam: New York. Boxall, P. and W. Adamowicz (2002). ‘Understanding heterogeneous preferences in random utility models: a latent class approach’. Envrionmental and Resource Economics 2002, 23(4), 421–446. Bozdogan, H. (1987). ‘Model selection and Akaike’s Information criterion (AIC): the general theory and its analytical extensions.’ Psychometrika, 52, 345–370. Chipman, B. and L. Helfrich (1988). ‘Recreational specializations and motivations of Virginia anglers’. North American Journal of Fisheries Management, 8, 390–398. Clogg, C. and L. Goodman (1984). ‘Latent structure analysis of a set of multidimensional contingency tables’. Journal of the American Statistical Association, 79(388), 762–771. Collins, L., P. Fidler, S. Wugalter, and J. Long (1993). ‘Goodness-of-fit testing for latent class models’. Multivariate Behavioral Research, 28, 375– 389. Connelly, N., T. Brown, and B. Knuth (2000). ‘A multiple market segmentation of Great Lakes anglers in New York’. North American Journal of Fisheries Management, 20, 399–407.
39
Connelly, N., B. Knuth, and T. Brown (2001). ‘An angler typology based on angler fishing preferences’. Transactions of the American Fisheries Society, 130, 130–137. De Menezes, L. and D. Bartholomew (1996). ‘New developments in latent structure analysis applied to social attitudes’. Journal of the Royal Statistical Society: Series A, 159(2), 213–224. Dempster, A., N. Laird, and D. Rubin (1977). ‘Maximum likelihood from incomplete observations’. Journal of the Royal Statistical Society: Series B, 39, 1–38. Eid, M., R. Langeheine, and E. Diener (2003). ‘Comparing typological structures across cultures by multigroup latent class analysis - a primer’. Journal of Cross-Cultural Psychology, 34(2), 195–210. Everitt, B. (1993). Cluster Analysis. Edward Arnold, London. Falconer, K. (2001). Investigation of arable production and pesticide usage using factor analysis. University of Cambridge, Department of Land Economy, Environmental Series Number 1. Flachaire, E., G. Hollard, and S. Luchini (2003). ‘A new approach to anchoring: theory and evidence from a contingent valuation survey’. GREQAM working paper. Hatcher, L. (1994). A step-by-step approach to using the SAS system for
40
factor analysis and structural equation modeling. SAS Institute, Inc., Cary, NC. Holland, S. and D. R.B. (1992). ‘Fishing trip satisfaction: a typology of anglers’. North American Journal of Fisheries Management, 12, 28–33. Hurvich, M. and C. Tsai (1989). ‘Regression and Time Series Model Selection in Small Samples’. Biometrika, 76(2), 297–307. Kaufman, L. and P. Rousseeuw (1990). Finding groups in data: an introduction to cluster analysis. John Wiley and Sons, Inc., New York. Kim, J. and C. Mueller (1978a). Factor analysis: statistical methods and practical issues. Sage Publications, Beverly Hills, CA. Kim, J. and C. Mueller (1978b). Introduction to factor analysis: what it is and how to do it. Sage Publications, Beverly Hills, CA. McClelland, E. (2001). Measurement issues and validity tests for using attitude indicators for contingent valuation research. National Center for Environmental Economics, U.S. Environmental Protection Agency, Working Paper 2001-01. McCutcheon, A. (1987). ‘Sexual morality, pro-life values, and attitudes toward abortion - a simultaneous latent structure analysis for 1978-1983’. Sociological Methods and Research, 16(2), 256–275. McCutcheon, A. and M. Nawojcyzk (1995). ‘Making the break - Popular
41
sentiment toward legalized abortion among American and Polish Catholic laities’. International Journal of Public Opinion Research, 7(3), 232–252. Morey, E. and K. Rossmann (2003). ‘Using Stated-Preference Questions to Investigate Variations in Willingness to Pay for Preserving Marble Monuments: Classic Heterogeneity, Random Parameters, and Mixture Models’. Journal of Cultural Economics, 27(3/4), 215–229. Provencher, B., K. Baerenklau, and R. Bishop (2002). ‘A finite mixture logit model of recreational angling with serially correlated random utility’. American Journal of Agricultural Economics, 84(4), 1066–1075. Scarpa, R., A. Drucker, S. Anderson, N. Ferraes-Ehuan, V. Gomez, C. Risopatron, and O. Rubio-Leonel (2003). ‘Valuing animal genetic resources in peasant economies: the case of the Box Keken creole pig in Yucatan’. Ecological Economics, 45(3), 427–443. Schwarz, G. (1978). ‘Estimating the dimension of a model’. The Annals of Statistics, 6, 461–464. Shonkwiler, J. and W. Shaw (2003). ‘A finite mixture approach to analyzing income effects in random utility models: reservoir recreation along the Columbia River’. In N. Hanley, D. Shaw, and R. Wright, editors, The New Economics of Outdoor Recreation, pages 242–268. Edward Elgar. Sullivan, J., J. Delfino, C. Buelow, and T. Sheffy (1983). ‘Polychlorinated biphenyls in the fish and sediment of the Lower Fox River, Wisconsin’. Bulletin of Environmental Contamination and Toxicology, 30, 58–64. 42
Thacher, J., E. Morey, and E. Craighead (2003). ‘Using patient characteristics and attitudinal data to identify treatment preference groups: a latent-class model’. UNM Working Paper. Titterington, D., A. Smith, and U. Makov (1985). Statistical Analysis of Finite Mixture Distribution. John Wiley & Sons, New York, first edition. von Davier, M. (1997). ‘Bootstrapping goodness of fit statistics for sparse categorical data: Results of a Monte Carlo study’. Methods of Psychological Research Online, 2, 29–48. Wedel, M. and W. Kamakura (2000). Market Segmentation: Conceptual and Methodological Foundations. Kluwer Academic Publishers, Boston, MA, second edition. Yamaguchi, K. (2000). ‘Multinomial logit latent-class regression models: an analysis of the predictors of gender-role attitudes among Japanese women’. American Journal of Sociology, 105(6), 1702–1740.
43
Table I: Attitudinal Question Topics
Comparision of Green Bay to other fishing sites Bothered by FCAs? (weekly, monthly, do not eat) Willingness to pay higher fees for improved catch rates or less severe FCAs Importance of four species-specific catch rates Importance of four species-specific FCAs Fee importance
44
Table II: Goodness of Fit Measures Suggest Heterogeneous Fishing Site Preferences Model
lnL
CAIC
AICC
BIC
Entropy
1 group
−14799
29999
29736
14999
n/a
2 groups
−14314
29451
28956
14725
0.94
3 groups
−13976
29168
28488
14584
0.84
4 groups
−13782
29186
28395
14593
0.81
45
46 a
2.85 3.20 2.76 3.64
c
b
Not a significant difference (5%) between FCA & Perch/Walleye Not a significant difference (5%) between FCA and Catch & Fee Not a significant difference (5%) between Walleye/Trout and Fee/Low Interest d Not a significant difference (5%) between Walleye/Trout and Perch/Walleye e Not a significant difference (5%) between FCA and Fee/Low Interest f Not a significant difference (5%) between Perch/Walleye and Fee/Low Interest
a
Comparison to Other Sites (7=Green Bay Much Better) b 3.92 Green Bay Quality 3.93 4.10
a
2.82 3.68
2.71 3.49 4.33
Amount Bothered (5=Very Bothersome) FCA: 1/week 4.02 FCA: 1/month 4.47 4.82 FCA: Don't eat
Agreement (5=Strongly Agree) WTP Higher Fees: Higher Catch WTP Higher Fees: No PCBs
3.52 3.68a 3.22 3.00 4.50 4.68 4.41 4.88 b 3.25
3.00 3.54a 2.60 3.40 2.39 3.35 2.61 3.29 a 3.07
4.04 4.47 4.83
FCA
FCA Attribute Importance (5=Very Important) Catch:Bass 3.49 a 3.63 Catch:Perch Catch:Trout/Salmon 3.25 Catch:Walleye 3.82 FCA:Bass 4.47 4.69 FCA:Perch FCA:Trout/Salmon 4.43 FCA:Walleye 4.87 a 3.2 Fee
b
3.89
2.52 2.66
2.60 3.29 4.07
2.51 3.37 2.22 3.18 1.62 2.81 2.04 2.74 b 3.14
4.19
3.01 3.45
2.78 3.60 4.45
3.19 a 3.58 2.79 3.50 2.72 3.60 2.89 3.53 3.02
Catch Perch/ and Fee Walleye
Three Groups
Perch/ Walleye
Two Groups
e
3.97
2.73 3.6
4.06 4.46 4.82
3.54 3.69 3.32 a 3.83 4.58 4.73 4.60 4.91 3.33
FCA
4.03
e
2.68 2.8
2.47 3.01 3.74
2.62 2.88 2.32 2.88 1.69 2.39 2.16 2.40 cf 2.95
4.27
d
2.99 d 3.43
2.78 3.5 4.27
3.12 3.38 3.46 3.49 2.77 3.47 3.52 d 3.58 c 2.98
3.83
d
2.82 d 3.23
2.89 3.92 4.83
3.07 4.14 1.45 a 3.63 2.37 3.88 1.55 d 3.55 f 3.16
Fee, Low Walleye Perch/ Interest /Trout Walleye
Four Groups
Figure 1: Average Response to Attitudinal Questions by Group
47 Fee, Low Interest 15% Fee Catch:Walleye, Perch, Bass FCA: Walleye, Perch, & Trout/S; Trout/S Catch FCA:Bass
Catch and Fee 22% Perch & Walleye Catch; Fee Other Catch; Non-Bass FCA FCA: Bass
Perch=Yellow Perch; Trout/S=Trout/Salmon; Bass=Small Mouthed Bass; Catch=Average Catch Rate; FCA=Fish Consumption Advisory
FCA 25% FCA:Walleye Four FCA: Perch & Trout/S Group FCA: Bass Model Catch: All Species & Fee
FCA 27% FCA:Walleye Three FCA:Perch Group Other FCA Model Catch: Walleye, Bass, Perch Fee; Trout/Salmon Catch
FCA 29% Two FCA:Walleye Group FCA:Perch Model Other FCA Catch: Walleye, Bass, Perch Fee; Trout/S Catch
Walleye/Trout 37% FCA:Walleye FCA:Trout/S & Perch; Catch:Trout/S & Perch Fee; Bass Catch FCA: Bass
Perch/Walleye 52% Catch & FCA: Perch & Walleye Catch: Bass Fee FCA:Trout/S Catch:Trout/S FCA: Bass
Perch/Walleye 71% Catch:Perch Walleye Catch & FCA; Perch FCA Fee; Bass Catch Trout/S: FCA & Catch FCA: Bass
Perch/Walleye 23% Catch:Perch Perch FCA; Walleye Catch Walleye FCA; Fee; Bass Catch FCA: Bass FCA: Trout/Salmon Catch:Trout/Salmon
Figure 2: Groups Ranked by Average Importance of Green Bay Attributes
Table III: Example Predicted Response Probabilities for Three-Group Model
FCA
Catch &
Perch/
Group
Fee
Walleye
Group
Group
Monthly FCA bothersome/very bothersome
83%
49%
55%
Perch FCA very important
91%
36%
58%
Trout FCA very important
93%
23%
36%
48
Table IV: Unconditional Probabilities of Group Membership
FCA Group Male
Female
Boat No Boat
Boat No Boat
Retired; Earn $50K+
39%
37%
47%
47%
Retired; Earn less than $50K
50%
47%
59%
57%
Not Retired; Earn $50K+
21%
19%
28%
26%
Not Retired; Earn less than $50K
28%
25%
37%
34%
Catch and Fee Group Male
Female
Boat No Boat
Boat No Boat
Retired; Earn $50K+
31%
24%
31%
25%
Retired; Earn less than $50K
20%
15%
19%
15%
Not Retired; Earn $50K+
27%
20%
30%
22%
Not Retired; Earn less than $50K
18%
13%
19%
14%
Perch/Walleye Group Male
Female
Boat No Boat
Boat No Boat
Retired; Earn $50K+
30%
38%
22%
29%
Retired; Earn less than $50K
30%
38%
22%
28%
Not Retired; Earn $50K+
52%
62%
42%
52%
Not Retired; Earn less than $50K 49 54%
63%
43%
52%