There exist many performance monitoring tools such as LTT [1], Kprobes [2], [3], .... instrumentation in Linux is too heavy to be tolerated in an embedded system.
A Lightweight Dynamic Performance Monitoring Framework for Embedded Systems Yao Guo, Ziwen Chen, Xiangqun Chen Key Laboratory of High-Confidence Software Technologies (Ministry of Education) Institute of Software, School of EECS, Peking University Beijing, 100871, PR China {yaoguo, chenzw06, cherry}@sei.pku.edu.cn
Abstract Traditional monitoring techniques are not suitable for embedded systems because they could incur significant overhead. This paper proposes a lightweight dynamic performance monitoring framework for embedded systems focusing on reducing the dynamic monitoring overhead. With the introduction of a target-host separation and cooperation model, the target (embedded) system only needs to perform minimal low-overhead tasks while most of the high-overhead tasks were migrated to the host machine. The overhead in the target embedded system is further reduced through a low-cost dynamic instrumentation mechanism with direct jump instructions. Keywords: performance monitoring, embedded systems, dynamic instrumentation
1. Introduction An embedded system is a special-purpose computer system designed to perform one or a few dedicated functions, often with resource-constrained hardware. Because of its characteristic of specialization in usage and limitation in hardware resources, embedded system designs are normally optimized from various perspectives, including reducing the size and cost of the product, or increasing the reliability and performance. Therefore, a monitoring tool that attempts to collect enough data needs to not only answer the simple question“does the embedded system perform well?” but also to a more complicated question “where is the bottleneck?”. However, monitoring always introduces significant costs with high frequency events. To facilitate optimization of system performance and diagnosis of system faults and anomalies, performance monitoring on embedded systems requires special techniques to reduce its overhead. There exist many performance monitoring tools such as LTT [1], Kprobes [2], [3], Djprobe[4], SystemTap [5], Gprof [6], and Oprofile [7]. The techniques used by these
tools can be divided into two main categories: instrumentation [8] and statistical sampling [9], [10]. Generally speaking, statistical sampling tools collect program counter information and other runtime data when specific event happens, such as timer interrupt or performance monitor counter (PMC) overflow events. But the main limitation of statistical sampling is that events with small and medium-sized populations would ”fly under the radar” and cannot be detected. The more popularly accepted technique is instrumentation, which can be classified into two types: static instrumentation and dynamic instrumentation. Static instrumentation typically requires modification to source code or binaries and also demands multiple rebuilds and reboots. The instrumented code still resides in memory after the monitoring task accomplishes. Consequently, the main disadvantage of static instrumentation is its lack of flexibility. Dynamic instrumentation allows program modification, debugging and extension all at runtime. However, dynamic instrumentation by trap instructions and then looking up handlers will incur enormous overhead, which is especially unacceptable when applied to embedded systems. In this paper, we present a lightweight dynamic performance monitoring framework for the embedded system. To achieve flexibility and performance simultaneously, we propose a target/host separation and cooperation model. In this model, most of the high-cost calculation tasks can be moved to the host machine that does not have the constraints of limited computing resources. We also implement a low-cost dynamic instrumentation mechanism in the target embedded system based on directly jump instructions, which is referred as embedded system probe (esprobe for short). The host machine and the target system communicate between each other through NFS over high-speed Ethernet. Monitoring commands are issued from the host machine and then collected profiling data can be copied from the target system back to the host machine. All other complicated computing-related operations could run solely on the host machine, relieving the target system from performing highoverhead tasks with its limited resources. We implement the framework and perform case studies
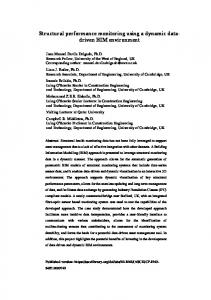
Kernel
Addr Context save
Probe handler
Context restore
Original instruction
Figure 1. the execution flow in kernel after dynamic instrumentation
to demonstrate its feasibility and performance. Experimental results show that we achieve two key goals with the proposed framework: (1) Reduce the cost/overhead of dynamic instrumentation with a low-cost probing technique esprobe; (2) Efficiently support system monitoring (tracing and probing) through target/host separation and cooperation. The remainder of the paper is organized as follows. Section 2 describes the proposed light-weight probing technique. In section 3 we discuss our dynamic performance monitoring framework. Section 4 describes the implementation of a prototype . Section 5 shows a case study and section 6 concludes this paper.
2. Lightweight Dynamic Probing To perform monitoring in an embedded system, we first present a low-cost dynamic probing mechanism in the target system to gather runtime information. Tools such as Dtrace [11], SystemTap and Kprobes allow developers to dynamically insert probes into the kernel. However, one of the key problems with these tools is their cost. For example, in Kprobes, an original instruction at a probe point is copied to an out-of-line buffer and a breakpoint instruction is inserted at the probe point. The breakpoint instruction triggers a break-point exception and invokes pre handler() of the kprobes from the break-point exception handler. After that, it executes the out-of-line buffer in single-step mode. Then, it triggers a single-step exception and invokes post handler(). Finally, it returns to the instruction following the probe point [4]. Thus one execution of each probe includes at least two exceptions and four full context switches. The performance overhead
introduced is normally unacceptable for embedded system monitoring. We propose esprobe, a low-cost dynamic probing tool using direct jump instructions. It can be applied to most embedded system that uses a RISC architecture processor, whose instruction length is fixed. Replacement of original instructions through jumps will not cause unanticipated crashes because the length of each instruction is always the same. The probe handler is invoked in a prepared code patch after a probe is triggered at runtime. The overall execution process of esprobe is shown in Figure 1. We will describe the details of the key steps next.
2.1. Esprobe Module Initialization During the initialization phase, esprobe requests several pages of kernel executable memory to hold probes through vmalloc(). Each page would be divided into several slots that can be allocated as code patches. Because the size of a code patch is set, the number of slots at each page can also be determined. These memory slots will be reserved till the esprobe module finishes execution.
2.2. Esprobe Object Registration The registration phrase of an esprobe object can be divided into two steps: preparing code patch and inserting it into the desired kernel code location. At first, it selects a free slot in the instruction pages; if there is no free slot, it will return an error message (such as T OO M AN Y P ROBES in our case). The code in Figure 2, which will be used as the template while preparing code patch, is already compiled into the kernel. The right column in the figure lists the machine code corresponding to the instruction on the left. The first four instructions perform context saving, while the last four instructions perform context restoring. The other three instructions in the middle prepare two parameters and jump to the unique entry of the probe handler. After the code template is copied to the corresponding slot, it will be modified accordingly. In the first underlined instruction, the shift operand of the “MOV” instruction should be changed to the slot ID. Thus register r0 holds the ID of the slot and r1 holds the address of stack that points to a pt regs structure 1 . The second underlined instruction is a function call instruction. Here we change the destination address of the branch to invoke the esprobe handler function (i.e., esprobe handler(intid, pt regs∗regs)). In this entry we will look up the esprobe object with the slot ID and call the pre-handler specified in the object. In the end, an instruction that will jump back to kernel is inserted into the slot. 1. pt regs is a C struct mapping to all register values, which is specific to the underlying machine architecture
.global code_patch_entry SUB sp, sp, #72 STMIA sp, {r0-lr} MRS r0, cpsr STR r0, [sp, #64]
e24dd048 e88d7fff e10f0000 e58d0040
MOV MOV BL
r1, sp r0, #0 code_patch_entry
e1a0100d e3a00000 ebfffffe
LDR MSR LDMIA ADD
r0, [sp, #64] cpsr, r0 sp, {r0-lr} sp, sp, #72
e59d0040 e129f000 e89d7fff E28dd048
he only needs to write his own script and our framework can perform all the remaining work automatically, without requiring rebuilding or rebooting the target system.
3.1. Operations in the Host Side
Figure 2. The code template used in dynamic probe. After the above steps, a code patch extending the kernel that is able to collect running profiling information has been prepared. The only remaining work is to replace the specified kernel instruction with a jump instruction that splices the kernel and code patch.
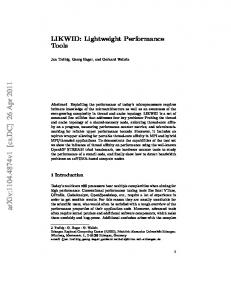
3. The Monitoring Framework In this section, we present a lightweight dynamic performance monitoring framework to reduce the monitoring overhead on an embedded system. The overall architecture of the proposed framework is shown in Figure 3. The key idea in the proposed framework is to separate the whole monitoring task into two collaborating subtasks, which can be run on the target embedded system and a high-performance host machine separately. We also utilize the low-cost dynamic instrumentation mechanism proposed in the last section in the target embedded system to gather system profiling information. The result of this separation/cooperation model is that most calculation (including tasks such as visualization if necessary) work will be done in the host machine that does not have strict performance/resource constraints. In the target embedded system, the added overhead comes only from the probe module and the daemon module, which can be implemented pretty efficiently. Our work is kind of similar to Noji’s work on SystemTap [12]. However, the key difference is that our framework doe not use SystemTap and Kprobes in the infrastructure in order to minimize the performance overhead due to monitoring. To trace an embedded system, we can describe the instrumentation points and data fields to be collected in an easy-to-write script. In our prototype implementation, XML is used as our script language. We provide some predefined trace hooks that is essential and important to understand the whole embedded system. These scripts can also be used by other users as templates to implement their own hooks. If a user needs to insert hooks to some additional spots,
To simplify the tasks on the target embedded system, the proposed monitoring framework utilizes a compilation process to generate instrumentation code. However, we could use XML as the script language to write the specification that contains probes and handlers. The runtime address of local variables and function parameters should also be calculated at the host machine based on the symbol table and procedure call standards of its underlying architecture (ARM in our case). The generated kernel module code will be crosscompiled to a binary and then copied to a directory that is mounted to the target system. We will provide predefined events in a script library, which can be used easily by users to generate their desired scripts of monitoring events. In our framework, we support the addition and removal of events according to user preference without rebuilding the target embedded operating system.
3.2. Operations in the Target Side There are two main components in the target side. One is the dynamic instrumentation component “esprobe”, and the other is a daemon running in the user space whose main task is to collect data. As mentioned in section 2, the overhead of the dynamic instrumentation in Linux is too heavy to be tolerated in an embedded system. The esprobe probing on embedded systems has similar features as kprobes, except that we implement esprobe using direct jump instructions in order to reduce its overhead. Esprobe is enlightened by Djprobe, which itself is also an improvement of kprobes using direct jump instruction in an x86 architecture. The main task of the probing daemon is to collect tracing data generated in a variety of probe handlers. We adopt a swap buffer model to transmit data from memory to permanent storage. The swap buffer model requires two buffers that can will be used alternatively. When a buffer is full, the kernel wakes the daemon up and uses the other buffer as the current writing buffer. The old writing buffer will be marked as the reading buffer, and can be transmitted to the host machine as a whole directly through NFS.
3.3. Communication With the monitoring task divided into two distributed subtasks, how to communicate between the host machine and the target system becomes an important issue.
Host(X86) Scripts lib
Scripts Parse & Translate
Target Kernel Debug Info
reference
C Source Code Cross Compile NFS
Kernel Module insmod
Results output
Target Kernel esprobe swap buffer
Target Target(ARM) (ARM)
daemon
Figure 3. The architecture of the proposed dynamic performance monitoring framework.
After the kernel module binary has been created in the host machine, the framework sends a message containing the file name to the target system through sockets. The daemon receives the message and then executes “insmod” to dynamically load the kernel module. The daemon in the target system transmits the running information data from memory to the host machine’s disk through NFS until the tracing task finishes. 3.3.1. Communication between kernel and user space. First, to transfer data between kernel and user space, the data was filled into a buffer resided in the kernel space. To boost the efficiency of data relay, we adopt a swap buffer model as discussed previously. In Linux, the address space of every process is divided into kernel space and user space. The user program should not be allowed to process the data or code directly except through system calls. The addresses in the user space therefore are all virtual addresses. To relay data to the disk, the daemon should have the knowledge about the data address. One typical implementation is to copy data from kernel to user space through the /proc file system. In our design, we use S3C44B0X as the target system that does not possess memory management units (MMUs). All processes share the same address space and the kernel data segment can be accessed without protection. We create a /proc entry in the directory through which the user daemon can get the address of swap buffers and notify its process ID (PID) to the kernel. Then the daemon goes to sleep till it receives a signal. When one buffer is full, the kernel notifies the daemon and uses the other empty buffer to write tracing
data. If the daemon resumes running, it will check the last buffer ID it uses and select another buffer to write to. 3.3.2. Communication between host machine and target system. There are many choices of communication methods between the host and target, including Ethernet or serial ports. After parsing and translating the XML scripts and cross-compiling the target kernel module, the process in the host machine should notify the daemon in the target to insert the kernel module dynamically. Then the daemon should relay collected data from the buffer to a permanent storage medium. After that, the data could be analyzed and visualized in the host machine. We handle the communication through Ethernet. When the kernel module is prepared in the host, the host process puts the module into a directory shared through NFS over Ethernet and sends a message containing the module name to the daemon in the target system. The daemon then receives this message and inserts the module. The pseudo code is shown in Figure 4.
4. A Case Study To demonstrate its feasibility and performance, we implemented a prototype of the proposed monitoring framework. As already mentioned, we use the S3C44B0X board to implement the target side, which is running uClinux/ARM7. We use a Dell Optiplex GX280 desktop as the host machine to process data collected from the embedded board. We developed a case study to utilize the proposed probing tool in our experimental environment. In the example, we
host program: parse and translate scripts; cross-compile the module; put the binary into NFS shared directory; send(module_name); …
target daemon: receive(module_name); system(“insmod module_name”); … put trace date into NFS shared directory;
Figure 4. Pseudo code of communication between host and target. uint32_t get_physical_addr(const char *func_name *func_name); func_name); static struct esprobe esp; esp; int handler_pre(struct esprobe *esp, esp, struct pt_regs *regs) regs ) { static int exec_cnt = 0; printk("handler execution, %d times\ times\n", ++exec_cnt ++ exec_cnt); exec_cnt ); printk("The command is: %s %s \n", regsregs ->ARM_r0); return 1; } static int probe_init(void) probe_init(void) { int ret; esp.pre_handler = handler_pre; handler_pre; //probe is registered here esp.addr = (esprobe_opcode_t (esprobe_opcode_t *) get_physical_addr("do_execve"); get_physical_addr("do_execve"); if((ret = esprobe_register(&esp)) esprobe_register(&esp)) < 0) //register failed return -1; return 0; //success } static void probe_exit(void) probe_exit(void) { esprobe_unregister(&esp); esprobe_unregister(&esp); }
handler execution, 36 times The command is: /proc/self/exe handler execution, 37 times The command is: busybox handler execution, 38 times The command is: /usr/sbin/lsmod /usr/sbin/lsmod handler execution, 39 times The command is: /bin/lsmod /bin/lsmod handler execution, 40 times The command is: /usr/bin/lsmod /usr/bin/lsmod handler execution, 41 times The command is: /sbin/lsmod /sbin/lsmod handler execution, 42 times The command is: ./hello esprobe esprobe unregistered
(a)
(b)
Figure 5. An example monitoring all commands executed from the shell. (a) Example code. (b) Running results.
use the code shown in Figure 5(a) to monitor all commands executed from shell. The shell will first fork a child and then load the desired program using execve(). The corresponding kernel function is sys execve that calls do execve(). We could thus accomplish instrumenting the function dynamically without rebooting and recompiling. First, we look up the physical address of do execve() in System.map, which is a kernel symbol table generated with each kernel compile. For instance, the entry address of do execve() is 0x0c04029c. The following code episode is the template of generated C source code after parsing and translating. Its running results are shown in figure 5(b), which shows the commands running and the total times of handler execution. We run busybox in uClinux. BusyBox combines tiny versions of many common UNIX utilities into a single small executable [13]. As shown from the resulting output, if the command is a busybox command, such as lsmod, /proc/self /exe, busybox and four other paths will be used as the parameters of do execve(); when executing a nonbusybox command, such as user programs, do execve()
will be invoked only once. Through do execve() dynamic instrumentation as we discussed previously, we can log what is being executed with both flexibility and low overhead.
4.1. Performance Analysis Because it is difficult to collect fine-grained performance details on the target system (the S3C44B0X board in out experiment), we will try to show the performance advantages of the proposed framework through performance analysis. As explained before, one traditional probe in Kprobes would require at least two exceptions and four full context switches, while the proposed esprobe needs only the jump instruction and two context switches. This shows that the proposed techniques completely removes the requirement of exception handling and also reduces half of the context switches needed compared to Kprobes. This demonstrates that the proposed framework is more suitable in an embedded environment. Much more calculations might be needed in a monitoring framework after the tracing data is acquired. That is when data analysis and possibly more complicated tasks such as
visualization will be performed to sift through the huge amount of collected data, trying to identify all kinds of potential points of interest, and present the analysis results from different angles. It is impossible to decide the complexity of the analysis phase because it completely depends on the purpose and specific implementation of each monitoring task. However, all these are irrelevant to the target embedded system in our proposed framework since all these analysis tasks could be performed in a host machine, which does not have strict performance constraints and will not affect the performance efficiency of the target embedded system. This indicates that the proposed techniques could also be applied to a non-embedded system and reduce the monitoring overhead by moving computing intensive tasks to another machine not on the critical path if necessary.
5. Related Work There has been a lot of existing effort in Linux monitoring. For example, Linux Trace Toolkit(LTT) [1], LTTng [14] and Linux Kernel State Tracer(LKST) [15] are static event tracers that should modify the source code and then rebuild the system. LTT records the running kernel data by inserting function calls into kernel source code. The developers should maintain patches for each release version of Linux kernel. LKST is another kernel tracing tool that needs patches to kernel that contains many hook check points. These hooks can be checked and the handler associated with the point can be changed. It is hard for these static instrumentation tools to add probes at runtime, if not impossible. Another disadvantage is that the code footprint will remain in the kernel even after the tracer turns off. SystemTap [5] use the kprobes [2] infrastructure to dynamically instrument the kernel and user applications. Kprobes is a dynamic kernel instrumentation tool. The main issue of SystemTap is its overhead. Like debugging tools, kprobes instruments the kernel through trap instruction and hash table lookup. As mentioned earlier, one execution of each probe requires two exceptions and four full context switches. This will cause significant performance degradation on embedded system. We tried to improve dynamic instrumentation in the proposed monitoring framework by introducing a jump instruction (B in ARM instruction set) instead of a trap instruction. This idea is borrowed from djprobe [4] which is also an enhancement to kprobe. To avoid the overhead of dynamic instrumentation tools, it is also common to use static instrumentation in the embedded system monitoring. For example, WindView in VxWorks [16] and LTT in embedded Linux. However, static instrumentation tools on embedded systems still have the disadvantages mentioned above. Profiling is another effective technique used for performance analysis. Event tracer can be used to figure out where
the bottleneck is, while profiler will help us to find out why the bottleneck happens. The commonly used profiling tools are DCPI [9], oprofile [7] and kernprof [17], etc. However, profiling does not work well for the situation that precise sequences of events need to be observed.
6. Concluding Remarks To perform successful dynamic monitoring on embedded systems with relatively low overhead, this paper presents a lightweight dynamic performance monitoring framework. The proposed framework could reduce the monitoring overhead by introducing a host/target separation and cooperation model, as well as a low-cost dynamic instrumentation tool suitable for an embedded environment. With all computing intensive tasks moved to the host machine, we are able to perform much more complicated data processing for the embedded system tracing data. Our future work include detailed performance study of the proposed framework, and how to apply various data analyzing techniques such as data mining to analyze the collected data, in order to identify anomalies or threats to the system.
Acknowledgment This work has been supported by the National High Technology Research and Development Program (863) of China under Grant No. 2007AA010304 and 2007AA01Z133, the National Basic Research Program of China (973) under Grant No. 2009CB320703, and the Science Fund for Creative Research Groups of China under Grant No. 60821003. Y. Guo is also supported by the National High Technology Research and Development Program (863) of China under Grant No. 2008AA01Z133.
References [1] K. Yaghmour and M. R. Dagenais, “Measuring and characterizing system behavior using kernel-level event logging,” in ATEC ’00: Proceedings of the annual conference on USENIX Annual Technical Conference. Berkeley, CA, USA: USENIX Association, 2000, pp. 2–2. [2] A. Mavinakayanahalli, P. Panchamukhi, J. Keniston, A. Keshavamurthy, and M. Hiramatsu, “probing the guts of kprobes,” in OLS (Ottawa Linux Symposium), 2006, pp. 101– 115. [3] P. Panchamukhi, “Kernel debugging with kprobes: Insert printk’s into the linux kernel on the fly,” http://www.ibm.com/developerworks/library/l-kprobes.html. [4] M. Hiramatsu and S. Oshima, “Djprobe-kernel probing with the smallest overhead,” in OLS (Ottawa Linux Symposium), 2007, pp. 189–1995.
[5] V. Prasad, W. Cohen, F. C. Eigler, M. Hunt, J. Keniston, and B. Chen, “Locating system problems using dynamic instrumentation,” in OLS (Ottawa Linux Symposium), 2005, pp. 49–64. [6] S. L. Graham, P. B. Kessler, and M. K. McKusick, “gprof: A call graph execution profiler,” in Proceedings of the SIGPLAN ’82 Symposium on Compiler Construction, ACM. ACM, 1982, pp. 120–126. [7] J. Levon, “Oprofile - a system profiler for linux,” http://oprofile.sourceforge.net/doc/index.html. [8] A. Tamches and B. P. Miller, “Fine-grained dynamic instrumentation of commodity operating system kernels,” in Proceedings of the 3rd Symposium on Operating Systans Design and Implementation (OSDI-99). Berkeley, CA: Usenix Association, Feb. 22–25 1999, pp. 117–130. [9] J. Anderson, L. M. Berc, J. Dean, S. Ghemawat, M. R. Henzinger, S.-T. Leung, R. L. Sites, M. T. Vandevoorde, C. A. Waldspurger, and W. E. Weihl, “Continuous profiling: Where have all the cycles gone?” ACM Transactions on Computer Systems, vol. 15, no. 11, pp. 357–390, Nov. 1997. [10] S. Bhatia, A. Kumar, M. Fiuczynski, and L. Peterson, “Lightweight, high-resolution monitoring for troubleshooting production systems,” in Eighth Symposium on Operating Systems Design and Implementation (OSDI), 2008, pp. 103– 116. [11] B. Cantrill, M. W. Shapiro, and A. H. Leventhal, “Dynamic instrumentation of production systems,” in USENIX Annual Technical Conference, General Track. USENIX, 2004, pp. 15–28. [12] T. Nojiri, “SystemTAP implementation for embedded system developments running on SH-4 (RTS7751R2D),” in Embedded Linux Conference 2007 Technical Showcase, 2007. [13] D. Vlasenko, “Busybox: The swiss army knife of embedded linux,” http://www.busybox.net/about.html. [14] M. Desnoyers and M. R.Dagenais, “The LTTng tracer: A low impact performance and behavior monitor for GNU Linux,” in OLS (Ottawa Linux Symposium), 2006, pp. 209–223. [15] “Linux kernel state http://lkst.sourceforge.net/.
tracer
web
site,”
[16] D. Wilner, “Windview: A tool for understanding real-time embedded software through system visualization,” in Workshop on Languages, Compilers, & Tools for Real-Time Systems, 1995, pp. 117–123. [17] SGI, “Kernprof (kernel http://oss.sgi.com/projects/kernprof/.
profiling),”