Jun 7, 2018 - market return, its volatility as well as its absolute return using spectral regres- sion. Findings are supportive of the absence of long memory in ...
Theoretical Economics Letters, 2018, 8, 1493-1509 http://www.scirp.org/journal/tel ISSN Online: 2162-2086 ISSN Print: 2162-2078
The Comparative Dynamics of Developed and Emerging Stock Markets: A Long Memory Perspective Sharad Nath Bhattacharya1*, Mousumi Bhattacharya1, Kousik Guhathakurta2 Indian Institute of Management, Shillong, India Indian Institute of Management, Indore, India
1 2
How to cite this paper: Bhattacharya, S.N., Bhattacharya, M. and Guhathakurta, K. (2018) The Comparative Dynamics of Developed and Emerging Stock Markets: A Long Memory Perspective. Theoretical Economics Letters, 8, 1493-1509. https://doi.org/10.4236/tel.2018.88096 Received: April 23, 2018 Accepted: June 4, 2018 Published: June 7, 2018 Copyright © 2018 by authors and Scientific Research Publishing Inc. This work is licensed under the Creative Commons Attribution International License (CC BY 4.0). http://creativecommons.org/licenses/by/4.0/ Open Access
Abstract The paper explores the difference in efficiency between developed and emerging stock market from a long memory perspective for the period 2000 to 2015. Ten developed, and ten emerging countries were selected for the study based on Morgan Stanley Capital International’s classification. We used both rescaled range and detrended fluctuation analysis and supplemented the findings with estimates of the fractionally integrated parameter for stock market return, its volatility as well as its absolute return using spectral regression. Findings are supportive of the absence of long memory in returns but support presence of long memory in absolute returns and volatility. We conclude that co-movement and spillover between stock markets have affected the market efficiencies and the efficiency of the emerging stock markets is no longer very different from that of the developed stock markets.
Keywords Long Memory, Rescaled Range, Detrended Fluctuation Analysis, Fractional Integration, Spectral Regression
1. Introduction Emerging market finance has attracted the attention of researchers and practitioners since the early nineties. Authors have argued that the emerging markets bring issues that challenge the framework of the neoclassical finance, needing special attention [1]. Comparative analyses of emerging and developed markets highlight the difference in efficiency of the markets [2]. On the other hand, [3] showed that with the rise of global integrations, stock markets exhibited greater DOI: 10.4236/tel.2018.88096
Jun. 7, 2018
1493
Theoretical Economics Letters
S. N. Bhattacharya et al.
co-movement, particularly during the IT bubble. While they found the phenomenon to be temporary and not an indication of permanent global integration of stock markets, [4] found evidence that the correlations across global financial markets had been permanently affected by the financial crisis. In spite of the voluminous literature on the comparative analysis of emerging and developed markets, it is necessary to vouch and authenticate the existing research findings, and we continue to look into the relative market characteristics from different perspectives to understand the effect of global integration. Long memory in stock returns is a direct comment on the efficiency of the stock market. The debate on stock market returns displaying long memory properties still continues since this fact has important consequences on the capital market theories even though evidence on the topic reported in empirical studies are not strong enough. Long range dependence generally suggests nonlinear structure in asset returns. Such long-range dependence structure indicates that returns can be predicted, the efficient market hypothesis is violated, and applicability of random walk in stock prices is challenged. It would also raise concern regarding linear modelling, forecasting, statistical testing of pricing models based on standard statistical methods, and theoretical and econometric modelling of asset pricing. We hypothesize that long memory statistics of the emerging and the developed market should reveal how different the markets are. Taking data from stock market indices of ten developed and ten emerging markets we run tests for long memory and find out the comparative scenario. Our findings indicate that while the volatility of returns in both developed and emerging markets exhibit long memory, there is no significant difference in the long memory characteristics of the two sets of markets. The article augments the existing literature by examining the efficiencies of the developed and emerging markets from a different perspective and is one of the early studies to evidence that no significant difference in terms of efficiency exists between the two classes of markets. In this article, we start in Section 2 with a brief literature review on Long Memory tests of financial markets. The issues and concerns with same are highlighted therein. In Section 3 we give the details of the data and methodology adopted. In the next section, we familiarize the readers with the theoretical background of the methods used to test the long-range dependence of the returns in the financial markets. In Section 5 we discuss the results of our empirical findings. Finally, we present our conclusions in Section 6.2.
2. Studies in Long Memory Initial works on long memory for stock returns are by [5] and [6]. [7] reported that the rescaled range statistic used by them is less powerful and often fails to distinguish between long and short memory. He proposed a modified rescaled range test using a statistic popularly called Lo statistic and concluded that daily stock returns do not display long-memory properties. [8] criticised the Lo statisDOI: 10.4236/tel.2018.88096
1494
Theoretical Economics Letters
S. N. Bhattacharya et al.
tic on the ground that it failed to detect a low level of long-range persistence or memory and challenged the inferences drawn from the evidence of long memory when long memory is identified using Lo statistic. There exists a general consensus among finance community that long-memory is an imperative characteristic of asset price volatility while asset returns, in agreement with the efficient markets hypothesis, contain insignificant serial correlation. [9] provides a decent survey of existing literature on the issue. Early evidence of long-range dependence in currencies is available in [10] while similar evidence in stock prices was provided by [11] and others. [12] provides evidence that international stock markets like Korean, Malaysian, Singapore and New Zealand stock market returns have long memory and therefore are not efficient while Japan, USA and Australia were found to be efficient. The divergent findings on the topic spawned research to include memory characteristics in volatility models and development of popular models like the inclusion of fractionally integrated component in GARCH family of models. More recent studies include [13] [14], and [15] provide assorted results. [13] reported the evidence of long memory in volatility of Chinese stock market. While [14] observed long memory in volatility of returns but not in mean returns for Indian stock market, contrary evidence was reported by [15] where they claimed for the presence of long memory in mean returns for medium and small stocks in India. [16] suggested that portfolios with higher long memory parameter possess higher expected return with lower risk. Absence of long memory in returns was reported by [17] in emerging markets and in developed markets by [18] but both [17] and [18] evidenced presence of long memory in volatility and absolute returns. An excellent review of the literature on long memory beginning from [19] is reported by [20].
3. Theoretical Background of Long Memory Long memory is a measure of persistence and can be explained both in the time domain and frequency domain. In the time domain, it is generally described as an exhibition of persistent autocorrelations with very slow decay at a hyperbolic rate. For a zero-mean covariance stationary process
{ xt , t = , −1, 0, +1,}
with auto covariance function γ u = E ( xt xt + u ) , the time domain explanation of long memory says that
∞
∑
u = −∞
γ u = ∞ . In the frequency domain, the long memory
is described in terms of rates of explosions of low frequency spectra. The pres-
( xt )t
makes it variable. When xt has an absolutely continuous spectral distribution with a spectral density func-
ence of explosions in the spectrum of a process
tion f(λ); according to the frequency domain definition of long memory, the spectral density function is unbounded at some frequency λ in the interval
[ 0, π ] , i.e.,
f ( λ ) → ∞ as
λ → λ * , where λ * ∈ [ 0, π ] . Empirical studies gen-
erally consider the case when the singularity or pole in the spectrum occurs at the zero frequency. This basically represents the general fractionally integrated DOI: 10.4236/tel.2018.88096
1495
Theoretical Economics Letters
S. N. Bhattacharya et al.
I(d) models of the form: (1 − L ) xt = ut , t = 0, ±1, , where xt = 0 for t ≤ 0 , and d > 0 , where L is the lag operator and ut is a covariance stationary process d
with a spectral density function that is positive and finite at any frequency. When the spectral power concentration is at very low frequencies near zero and has an exponential decline with an increase in frequency, it is indicative of the existence of long memory.
4. Data & Methodology We explored the existence of long memory using ten indices from both emerging and developed markets at a daily frequency. For emerging market category, we selected Hungary (BUX), China (SHCOMP), Brazil (IBOVESPA), Chile (IPSA), India (NIFTY), Korea (KOSPI), Malaysia (KLSE), Mexico (MXX-IPC), MICEX (Russia), and TWII (Taiwan). For developed market category we considered Australia (ALL ORDINARIES), Canada (TSX), France (FCHI), Germany (DAX), Hongkong (HANGSENG), Japan (NIKKEI), Netherlands (AEX), Singapore (STRAITS TIMES), United Kingdom (FTSE 100) and United States of America (DJA). We adopted Morgan Stanley Capital International (MSCI) classification for segregating stock markets into emerging and developed which takes into account market accessibility, its size and liquidity and economic development. The daily closing values of the selected indices from January 2000 to September 2015 were considered based on availability, and non-availability of more recent data from all the markets is a limitation of the study. Stock market returns ( rt ) are obtained as the natural logarithm of the ratio of the current value of the stock index to the previous price. We considered three forms of return viz., return ( rt ), absolute return (modulus value) and return squared series from each index. We used Detrended Fluctuation Analysis, Rescaled range analysis and an estimate of the fractional differencing parameter to explore long memory characteristics as discussed in subsequent sections. We first investigate the descriptive statistics of all the data series and follow it up with stationarity tests using standard unit root tests. For Hurst exponent estimation, we adopt Detrended Fluctuation Analysis (DFA), Lo (1991) statistic and also estimated the long-memory parameter using the semiparametric log-periodogram regression estimator applying [21] modifications. We discuss the above-referred methods below.
4.1. Detrended Fluctuation Analysis Detrended fluctuation analysis (DFA) of [22] quantifies fractal-like correlation properties of the time series to investigate long-range power-law Correlations. It is done by detrending the sub-periods and using squared fluctuations around the trend of the signal, measured within observation windows of various sizes and
then plotted against window size on a log-log scale log σ DFA ∞H log ( n ) . The scaling exponent H (Hurst exponent) indicates the slope of this line, which relates log(fluctuation) to log(window size). The linear relationship supports the DOI: 10.4236/tel.2018.88096
1496
Theoretical Economics Letters
S. N. Bhattacharya et al.
presence of power-law (fractals) scaling which indicates that there is self-similarity in the series indicating that the fluctuations over small time scales are related to fluctuations over larger time scales. This H is used to identify the long memory properties of the time series. While H = 0.5 is indicative of random walk, its value 0 and 0.5 is indicative of anti-persistent behaviour and between 0.5 and 1.0 indicates persistent behaviour.
4.2. Estimation of Lo Statistic The rescaled range provides a powerful alternative to autocorrelation, the variance analysis and spectral analysis while dealing with long-range persistence. For rescaled range statistic we find the ratio of the range of the sum of the deviations from the local mean divided by the standard deviation from the mean. Lo’s (1991) statistic is a stable estimate of the long-range dependence of the time series which avoids sensibility of the general rescaled range statistic to short-term correlations by performing a Newey-West correction. Hence, if “n” is the time span, rn represents the mean return and Lo’s modified R/S statistic, denoted by
Qn is defined as: n
rn = ∑ r ( t ) n
(1)
t =1
k k Qn max ∑ ( r ( t ) − rn ) − min ∑ ( r ( t ) − rn ) σ n ( q ) = 1≤ k ≤ n 1≤ k ≤ n t 1 =t 1 =
q 2 1 n r ( t ) − rn ) + 2∑ ω j ( q ) γ j ( ∑ n t 1 =j 1 =
σ n2= (q)
(2) with (3)
where γ j represents the sample auto covariance of order j, and ω j (q) = 1 − ( j q + 1) represents the weights applied to the auto covariance at jth lag. The term
q
∑ω j (q)γ j j =1
is useful in understanding the short-term dynamics.
The statistic is sensitive to heteroscedasticity and autocorrelation corrected standard deviation which in itself is sensitive to the lag length q. We applied [23] procedure for obtaining optimal q.
4.3. Estimation of Fractionally Integrated Parameter Here we use the standard spectral density function f ( λ ) which takes the form −2 d as λ → 0 with d ≠ 0 where c ≠ 0 , d ∈ ( 0, 0.5 ) is the f ( λ ) : c 1 − e − iλ fractionally integrated parameter that indicates memory. [24] proposed a least-squares estimator of d to understand the slope of the spectral density and is based on the regression equation:
{
}
log I ( λ ) = β 0 − d log 4sin 2 ( λ j 2 ) + υ j , j = 1, , M ,
(4)
where I ( λ ) is the jth periodogram point, λ j is the jth Fourier frequency and M g= υ j is an identically distributed error term.= (T ) T µ with 0 < µ < 1 is DOI: 10.4236/tel.2018.88096
1497
Theoretical Economics Letters
S. N. Bhattacharya et al.
the number of Fourier frequencies included in the spectral regression and is an increasing function of T. The estimator is known as a semi-parametric estimator since it does not require the AR and MA parameters a priori. We estimated long memory parameter here using [21] innovations that allow for a larger fraction of the ordinates of the empirical periodogram of the series with averaging of the periodogram over adjacent frequencies. On the choice of the number of harmonic ordinates to be included in the spectral regression, we consider M = T0.50;
T0.55; T0.70.
5. Empirical Analysis Table 1 displays the descriptions of all forms of return from all the indices selected for the study. We observed that all emerging nations except Taiwan have positive average return during the period while four developed countries like Japan, UK, France and Netherlands have negative average return during a similar period. Except for two developed European nation like Germany and France and two Latin American emerging nations like Chile and Mexico, all other return series are negatively skewed while all the return series from both developed and emerging nation are leptokurtic. The normality assumption for the logarithmic return was clearly rejected based on Jarque-Bera statistic. Normality is also rejected for absolute return series and volatility series of all developed and emerging indices using Jarque-Bera statistic which display of positive skewness and leptokurtic behaviour. While testing for time series stationarity using unit root tests, the findings of ADF and PP unit root tests reject the hypothesis of a unit root in all forms of return series for all the markets as presented in Table 2. The primary inference from this is that the data series is stationary.
5.1. Detrended Fluctuation Analysis The values of Hurst component are displayed in Annexure 1. The minimum and maximum Hurst exponent value for return series for developed markets are 0.476 and 0.557 respectively whereas for emerging nations it is 0.506 and 0.609 respectively. In the case of squared return series, the min-max values are 1.05 and 0.96 respectively for developed markets and 1.00 and 0.87 for emerging markets respectively. For absolute return series, the min-max values are 1.00 and 0.89 for developed markets and 0.95 and 0.83 for emerging markets. While applying t-test for the null hypothesis that means of each series is 0.5 we get the following observations: The findings as reported in Table 3 indicate that the hypothesis of Hurst exponent equaling 0.5 is rejected for all the return series and long memory is weak for return series while squared, and absolute return series shows strong, persistent behaviour. For developed markets squared and absolute return series shows strong, persistent behaviour while the possibility of returns following random walk cannot be ruled out. DOI: 10.4236/tel.2018.88096
1498
Theoretical Economics Letters
S. N. Bhattacharya et al. Table 1. Data Summary: Return, |Return|, Return Squared. Indices
Data
Maximum Minimum
Std. Dev.
Mean
Median
Skewness Kurtosis
RET
0.00013
0.00048
0.05360
−0.08554 0.0097
−0.591
9.248
SQR
0.00010
0.00002
0.00732
0.00000
0.0002
11.372
211.28
ABS
0.00685
0.00492
0.08554
0.00000
0.0069
2.8322
17.712
RET −0.00011 0.00043
0.10028
−0.09590 0.0147
−0.085
9.210
SQR
0.00022
0.00005
0.01006
0.00000
0.0006
7.9556
89.015
ABS
0.01001
0.00680
0.10028
0.00000
0.0108
2.8196
15.219
RET
0.00010
0.00075
0.10798
−0.07434 0.0154
0.0104
7.130
SQR
0.00024
0.00006
0.01166
0.00000
0.0005
7.8794
104.66
ABS
0.01085
0.00758
0.10798
0.00000
0.0110
2.3277
11.796
RET
0.00009
0.00044
0.10508
−0.08201 0.0119
−0.064
10.934
SQR
0.00014
0.00003
0.01104
0.00000
0.0004
11.972
220.09
ABS
0.00804
0.00546
0.10508
0.00000
0.0087
3.0700
19.986
RET −0.00007 0.00033
0.10595
−0.09472 0.0150
0.0055
7.661
SQR
0.00023
0.00006
0.01123
0.00000
0.0005
8.3195
105.22
ABS
0.01061
0.00752
0.10595
0.00000
0.0104
2.5061
13.517
RET −0.00003 0.00000
0.09384
−0.09265 0.0124
−0.164
9.401
SQR
0.00015
0.00003
0.00881
0.00000
0.0004
9.910
147.78
ABS
0.00827
0.00569
0.09384
0.00000
0.0088
2.788
16.406
RET
0.00006
0.00037
0.13407
−0.13582 0.0154
−0.078
10.868
HANGSENG SQR
0.00024
0.00005
0.01845
0.00000
0.0007
12.889
243.82
ABS
0.01060
0.00735
0.13582
0.00000
0.0112
3.061
21.121
RET −0.00001 0.00032
0.13235
−0.12111 0.0154
−0.395
9.197
SQR
0.00024
0.00007
0.01752
0.00000
0.0006
12.442
229.14
ABS
0.01108
0.00826
0.13235
0.00001
0.0108
2.846
19.544
RET
0.00003
0.00022
0.07531
−0.09095 0.0117
−0.349
8.986
SQR
0.00014
0.00003
0.00827
0.00000
0.0003
9.474
136.92
ABS
0.00810
0.00558
0.09095
0.00000
0.0085
2.751
15.831
RET
0.00013
0.00070
0.09370
−0.09788 0.0115
−0.653
12.136
SQR
0.00013
0.00003
0.00958
0.00000
0.0004
11.625
188.18
ABS
0.00780
0.00549
0.09788
0.00000
0.0085
3.367
22.868
Developed Nations
^AORD
AEX
DAX
DJA
FCHI
FTSE 100
NIKKEI
STRAITS TIMES
TSX
Emerging Nations
BUX
DOI: 10.4236/tel.2018.88096
RET
0.00023
0.00031
0.13178
−0.12649 0.0157
−0.079
8.865
SQR
0.00025
0.00007
0.01737
0.00000
0.0007
11.971
219.58
ABS
0.01130
0.00851
0.13178
0.00001
0.0109
2.808
18.55
1499
Theoretical Economics Letters
S. N. Bhattacharya et al. Continued IBOVESPA
IPSA
KLSE
KOSPI
MICEX
MXXIPC
NIFTY
SHCOMP
TWII
RET
0.00026
0.00048
0.13677
−0.12096 0.0182
−0.070
6.722
SQR
0.00033
0.00011
0.01871
0.00000
0.0008
10.042
165.41
ABS
0.01348
0.01051
0.13677
0.00000
0.0123
2.31
13.634
RET
0.00031
0.00047
0.11803
−0.07173 0.0100
0.030
11.780
SQR
0.00010
0.00003
0.01393
0.00000
0.0003
22.050
803.198
ABS
0.00714
0.00538
0.11803
0.00000
0.0070
3.225
27.584
RET
0.00018
0.00040
0.16020
−0.15568 0.0096
−0.509
60.637
SQR
0.00009
0.00002
0.02567
0.00000
0.0007
27.99
874.75
ABS
0.00594
0.00402
0.16020
0.00000
0.0076
7.977
127.10
RET
0.00016
0.00071
0.11284
−0.12805 0.0161
−0.565
8.941
SQR
0.00026
0.00006
0.01640
0.00000
0.0007
10.269
167.85
ABS
0.01105
0.00758
0.12805
0.00000
0.0117
2.671
15.47
RET
0.00059
0.00118
0.25226
−0.20657 0.0219
−0.217
16.540
SQR
0.00048
0.00011
0.06364
0.00000
0.0019
17.843
454.25
ABS
0.01472
0.01057
0.25226
0.00000
0.0163
3.963
34.41
RET
0.00046
0.00080
0.10441
−0.08267 0.0135
0.027
7.882
SQR
0.00018
0.00005
0.01090
0.00000
0.0004
8.782
131.78
ABS
0.00949
0.00671
0.10441
0.00000
0.0096
2.543
13.650
RET
0.00041
0.00104
0.16334
−0.13054 0.0155
−0.297
11.10
SQR
0.00024
0.00006
0.02668
0.00000
0.0007
17.80
499.24
ABS
0.01086
0.00791
0.16334
0.00000
0.0110
3.085
23.80
RET
0.00021
0.00058
0.09401
−0.09256 0.0164
−0.274
7.38
SQR
0.00027
0.00006
0.00884
0.00000
0.0006
6.532
59.34
ABS
0.01141
0.00787
0.09401
0.00000
0.0118
2.397
11.60
RET −0.00001 0.00035
0.06525
−0.09936 0.0144
−0.23
6.065
SQR
0.00021
0.00005
0.00987
0.00000
0.0004
6.13
71.806
ABS
0.01011
0.00694
0.09936
0.00000
0.0102
2.02
8.784
RET—Return Series, SQR—Squared Return Series, ABS—Absolute Return Series (Source: Author).
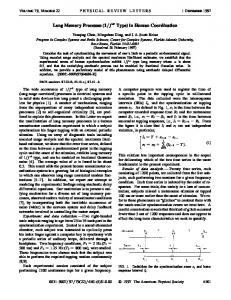
The box plot figures (Figures 1-3) for all the series for both the markets further supports the findings that squared and absolute return series show persistent behaviour. Additionally, returns from emerging markets show weak persistence while evidence for returns from developed markets is inconclusive and ranges between random walk and weak persistence. However the possibility that these findings being influenced by the presence of short memory cannot be ruled out, and we use rescaled range analysis for the same.
5.2. Rescaled-Range (R/S) Analysis Rescaled Analysis is based on the premise that range as a measure of dispersion DOI: 10.4236/tel.2018.88096
1500
Theoretical Economics Letters
S. N. Bhattacharya et al. Table 2. Findings from the Unit Root Tests. Indices
^AORD
AEX
DAX
DJA
FCHI
FTSE 100
HANGSENG
NIKKEI
STRAITS TIMES
TSX
Data
Unit Root Tests ADF
PP
RET
−64.32
−64.37
SQR
−8.28
−82.39
ABS
−9.28
RET
Indices
Unit Root Tests ADF
PP
−30.43
−59.48
−7.61
−68.27
−85.50
−12.26
−75.93
−30.39
−64.02
−61.78
−61.86
SQR
−6.19
−89.96
−6.93
−89.84
ABS
−6.76
−92.77
−9.70
−85.36
RET
−64.26
−64.37
−52.86
−52.51
SQR
−6.86
−89.10
−11.66
−65.62
ABS
−8.33
−92.86
−11.52
−70.61
RET
−48.56
−68.15
−61.87
−61.96
SQR
−7.96
−93.82
−24.93
−36.55
ABS
−7.02
−92.85
−23.77
−55.35
RET
−31.31
−66.24
−60.65
−60.69
SQR
−7.07
−85.67
−11.05
−76.97
ABS
−8.76
−90.84
−8.28
−87.61
RET
−30.87
−67.17
−60.39
−60.37
SQR
−6.32
−85.51
−5.93
−83.97
ABS
−8.18
−85.96
−6.13
−84.75
RET
−62.59
−62.64
−44.65
−56.62
SQR
−8.66
−65.36
−6.70
−86.23
ABS
−7.11
−87.09
−9.68
−84.77
RET
−64.25
−64.38
−44.70
−57.85
SQR
−10.31
−75.16
−12.85
−65.38
ABS
−11.23
−82.43
−10.77
−75.43
RET
−61.53
−61.59
−59.71
−59.75
SQR
−8.21
−84.72
−12.46
−70.16
ABS
−7.03
−88.62
−10.61
−78.57
RET
−63.77
−64.06
−59.52
−59.51
SQR
−5.05
−78.36
−9.36
−79.99
ABS
−7.60
−86.41
−7.41
−89.24
BUX
IBOVESPA
IPSA
KLSE
KOSPI
MICEX
MXXIPC
NIFTY
SHCOMP
TWII
The null hypothesis of unit root is rejected for mean return, absolute return and squared return for all markets. (Source: Author Calculations).
of the series, follows a scaling law. We estimated Lo statistic for all the series and is reported in Annexure 1. We did not find evidence to reject the null hypothesis of absence of long memory in return. Contrary findings are evidenced using DOI: 10.4236/tel.2018.88096
1501
Theoretical Economics Letters
S. N. Bhattacharya et al. Table 3. Estimates of t statistic (Ho: Mean of each series = 0.5). For Developed Markets RET
SQR
ABS
Test statistic
2.004
45.5486
42.5659
Two-tailed p-value
0.075
5.928e−012
1.088e−011
One-tailed p-value
0.037
2.964e−012
5.438e−012
For Emerging Markets Test statistic
3.85108
33.0184
27.5554
Two-tailed p-value
0.0039
1.056e−010
5.298e−010
One-tailed p-value
0.00195
5.278e−011
2.649e−010
Null hypothesis is rejected for all the data series. (Source: Author Calculation).
Figure 1. Hurst exponent for returns. Source: Author.
Figure 2. Hurst exponent for absolute returns. Source: Author. DOI: 10.4236/tel.2018.88096
1502
Theoretical Economics Letters
S. N. Bhattacharya et al.
Figure 3. Hurst exponent for volatility. Source: Author.
volatility and absolute return series where the existence of long memory is rejected except for Malaysia, where the null of no long-range dependence could not be rejected at acceptable levels of significance.
5.3. The Spectral Regression Method (Robinson’s Estimates) The estimates of the fractional differencing parameter (d) are reported in Annexure 2. The hypothesis of short memory (d = 0) is rejected for absolute return and volatility indicating that fractionally integrated models would be required for modelling these series and similar findings are observed for developed and emerging markets with the exception of Malaysia where the presence of long memory in volatility could not be evidenced. However consistent with earlier findings, the null hypothesis for return series could not be rejected for all the emerging and developed market indices.
6. Conclusions The comparative dynamics of emerging and developed financial markets is an important area of study, especially to understand the increasing impact of global integration. One aspect that distinguishes a mature market and a young market is the difference in market efficiency. The comparative studies thus focus on the efficiency of emerging and developed stock markets. However, [25] showed that the commonly used measures of weak and semi-strong efficiency have limitations in capturing the efficiency. An alternative way to gauge market efficiency is the use of long memory statistics. In this article, we have extended the literature on the comparative dynamics of emerging and developed stock markets using long memory statistics. Overall findings did not suggest any significant difference in returns from developed markets and emerging markets in terms of memory as the presence of DOI: 10.4236/tel.2018.88096
1503
Theoretical Economics Letters
S. N. Bhattacharya et al.
long memory could not be established in return series of both the groups. This possibly lends support to the view that modern technology-driven equity markets, whether developed or emerging, are either efficient with arbitrage-free pricing or they are similarly immune to information asymmetry. The distinction between emerging and developed markets regarding efficiency needs a relook as we do not find any significant difference between them in terms of persistence. The findings are supportive of the argument that returns of stock markets follow a random walk and have important implications for equity and portfolio investors. The assertion of random walk seemed indisputable not only on empirical justifications but also consistent with the efficient market paradigm. In the case of Malaysia, significant R/S statistic with insignificant Lo statistic for squared return series indicates evidence of short memory in volatility in line with the observations of [26] and [27]. We argue that evidence against long memory in KLSE needs further research considering the market microstructure and the dynamic nature of market movements in Malaysia. Findings also indicate possibilities of speculation in derivatives market as the presence of memory in volatility leaves room for impaired price discovery. In line with [28], the findings support the presence of non-linearity in emerging and developed markets. We did not find any significant difference in the long memory statistics of the two market groups. We can conjecture that due to global integration the efficiency of the emerging stock markets is no longer very different from that of the developed stock markets. This study has important implications for global investment decisions. For policymakers in emerging market, the lesson from this article is that liberalisation of markets has resulted in improving the efficiency of the markets. The greater the integration with global markets the more is the benefit for the emerging markets. The future research scope would be in finding and establishing the range of the fractional differencing parameter (d) for each of emerging and developed markets.
References [1]
Bekaert, G. and Harvey, C.R. (2003) Emerging Markets Finance. Journal of Empirical Finance, 10, 3-55. https://doi.org/10.1016/S0927-5398(02)00054-3
[2]
Bekaert, G. and Harvey, C.R. (2002) Research in Emerging Markets Finance: Looking to the Future. Emerging Markets Review, 3, 429-448. https://doi.org/10.1016/S1566-0141(02)00045-6
[3]
Brooks, R. and Del Negro, M. (2004) The Rise in Comovement across National Stock Markets: Market Integration or IT Bubble? Journal of Empirical Finance, 11, 659-680.
[4]
Zhang, B., Li, X. and Yu, H. (2013) Has Recent Financial Crisis Changed Permanently the Correlations between BRICS and Developed Stock Markets? The North American Journal of Economics and Finance, 26, 725-738.
[5] [6]
DOI: 10.4236/tel.2018.88096
Mandelbrot, B.B. (1971) A Fast Fractional Gaussian Noise Generator. Water Re-
sources Research, 7, 543-553. https://doi.org/10.1029/WR007i003p00543
Greene, M.T. and Fielitz, B.D. (1977) Long-Term Dependence in Common Stock Returns. Journal of Financial Economics, 4, 339-349. 1504
Theoretical Economics Letters
S. N. Bhattacharya et al. https://doi.org/10.1016/0304-405X(77)90006-X [7]
Lo, A.W. (1991) Long-Term Memory in Stock Market Prices. Econometrica, 59, 1279-1313. https://doi.org/10.2307/2938368
[8]
Willinger, W., Taqqu, M.S. and Teverovsky, V. (1999) Stock Market Prices and Long-Range Dependence. Finance and Stochastics, 3, 1-13. https://doi.org/10.1007/s007800050049
[9]
Baillie, R.T. (1996) Long Memory Processes and Fractional Integration in Econometrics. Journal of Econometrics, 73, 5-60. https://doi.org/10.1016/0304-4076(95)01732-1
[10] Harvey, A.C. (1993) Long Memory in Stochastic Volatility. Working Paper 10, School of Economics, London. [11] Andersen, T.G. and Bollerslev, T. (1997) Heterogeneous Information Arrivals and Return Volatility Dynamics: Uncovering the Long-Run in High Frequency Returns. Journal of Finance, 52, 975-1005. https://doi.org/10.1111/j.1540-6261.1997.tb02722.x [12] Sadique, S. and Silvapulle, P. (2001) Long-Term Memory in Stock Market Returns: International Evidence. International Journal of Finance & Economics, 6, 59-67. https://doi.org/10.1002/ijfe.143 [13] Kang, S.H., Cheong, C. and Yoon, S.M. (2010) Long Memory Volatility in Chinese Stock Markets. Physica A, 389, 1425-1433. https://doi.org/10.1016/j.physa.2009.12.004 [14] Maheshchandra, J.P. (2012) Long Memory Property in Return and Volatility: Evidence from the Indian Stock Markets. Asian Journal of Finance & Accounting, 4, 218-230. https://doi.org/10.5296/ajfa.v4i2.2027 [15] Hiremath, G.S. and Kumari, J. (2015) Is There Long Memory in Indian Stock Market Returns? An Empirical Search. Journal of Asia-Pacific Business, 16, 128-145. https://doi.org/10.1080/10599231.2015.1028306 [16] He, J., Wang, J. and Jiang, X. (2016) The Effects of Long Memory in Price Volatility of Inventories Pledged on Portfolio Optimization of Supply Chain Finance. Journal of Mathematical Finance, 6, 134-155. [17] Bhattacharya, S.N. and Bhattacharya, M. (2012) Long Memory in Stock Returns: A Study of Emerging Markets. Iranian Journal of Management Studies, 5, 67-88. [18] Bhattacharya, S.N. and Bhattacharya, M. (2013) Long Memory in Return Structures from Developed Markets. Cuadernos de Gestión, 13, 127-143. [19] Hurst, H.E. (1951) Long-Term Storage of Reservoirs: An Experimental Study. Transactions of the American Society of Civil Engineers, 116, 770-799. [20] Graves, T., Gramacy, R., Watkins, N. and Franzke, C. (2017) Brief History of Long Memory: Hurst, Mandelbrot and the Road to Arfima, 1951-1980. Entropy, 19, 437. https://doi.org/10.3390/e19090437 [21] Robinson, P. (1995) Log-Periodogram Regression of Time Series with Long Range Dependence. The Annals of Statistics, 23, 1048-1072. https://doi.org/10.1214/aos/1176324636 [22] Peng, C.-K., Buldyrev, S.V., Havlin, S., Simons, M., Stanley, H.E. and Goldberger, A.L. (1994) Mosaic Organization of DNA Nucleotides. Physical Review E, 49, 1685-1689. [23] Andrews, D.W.K. (1991) Heteroscedasticity and Autocorrelation Consistent Covariance Matrix Estimation. Econometrica, 59, 817-858. DOI: 10.4236/tel.2018.88096
1505
Theoretical Economics Letters
S. N. Bhattacharya et al. [24] Geweke, J. and Porter-Hudak, S. (1983) The Estimation and Application of Long-Memory Time Series Models. Journal of Time Series Analysis, 4, 221-238. [25] Griffin, J.M., Kelly, P.J. and Nardari, F. (2010) Do Market Efficiency Measures Yield Correct Inferences? A Comparison of Developed and Emerging Markets. Review of Financial Studies, 23, 3225-3277. https://doi.org/10.1093/rfs/hhq044 [26] Beran, J. and Ocker, D. (2001) Volatility of Stock Market Indices—An Analysis Based on SEMIFAR Models. Journal of Business and Economic Statistics, 19, 103-116. [27] Cajueiro, D.O. and Tabak, B.M. (2004) The Hurst’s Exponent over Time: Testing the Assertion that Emerging Markets Are Becoming More Efficient. Physica A, 336, 521-537. [28] Guhathakurta, K., Bhattacharya, S.N., Banerjee, S. and Bhattacharya, B. (2013) Nonlinear Correlation of Stock and Commodity Indices in Emerging and Developed Market. In: Banerjee, S., Ed., Chaos and Complexity Theory for Management: Nonlinear Dynamics, IGI Global, Hershey, 63-87.
DOI: 10.4236/tel.2018.88096
1506
Theoretical Economics Letters
S. N. Bhattacharya et al.
Annexure 1 HURST Exponent Developed Markets
Emerging Markets
Indices
RET
SQR
ABS
Indices
RET
SQR
ABS
AORD
0.5278
0.9123
0.9705
BUX
0.5391
0.8535
0.9256
AEX
0.5275
1.002
1.056
IBOVESPA
0.5059
0.8532
0.938
DAX
0.5199
0.9674
1.015
IPSA
0.5355
0.8354
0.9047
DJA
0.4824
0.9675
1.033
KLSE
0.5735
0.8443
0.8754
FCHI
0.4947
0.9512
1.002
KOSPI
0.5068
0.9428
0.969
FTSE 100
0.476
0.9489
1.016
MICEX
0.5262
0.9326
1.009
HANGSENG
0.5145
0.939
0.9788
MXXIPC
0.5103
0.8958
0.9492
NIKKEI
0.5238
0.8902
0.9656
NIFTY
0.537
0.893
0.9269
STRAITS TIMES
0.5577
0.9242
0.9634
SHCOMP
0.6087
0.8612
0.8717
TSX
0.5335
0.9802
1.053
TWII
0.5476
0.9579
0.9397
Lo Statistic AORD
1.35
3.44
4.41
BUX
1.36
2.56
3.36
AEX
1.28
2.19
2.78
IBOVESPA
1.58
2.66
3.68
DAX
1.46
2.65
3.48
IPSA
1.59
2.3
2.75
DJA
1.19
2.68
2.69
KLSE
1.18
1.64
3.04
FCHI
1.07
2.61
3.5
KOSPI
1.22
3.27
4.36
FTSE 100
1.12
2.38
2.81
MICEX
1.23
2.83
3.45
HANGSENG
1.31
2.68
3.76
MXXIPC
1.41
2.95
3.56
NIKKEI
1.15
2.01
2.52
NIFTY
1.43
2.92
3.16
STRAITS TIMES
1.49
3.38
3.57
SHCOMP
1.64
3.58
4.09
TSX
1.09
2.49
3.03
TWII
1.16
3.74
4.42
The values of Hurst component and Lo statistic. Note: Critical values: The critical values of the statistic are obtained from Lo (Table II, 1991). 90% [0.861, 1.747]. 95% [0.809, 1.862]. 99% [0.721, 2.098].
DOI: 10.4236/tel.2018.88096
1507
Theoretical Economics Letters
S. N. Bhattacharya et al.
Annexure 2 The estimates of the fractional differencing parameter (d) Indices
Data
M = T0. 50
M = T0. 55
M = T0.60
M = T0.65
M = T0.70
Developed Markets ^AORD
RET
0.1075
0.1352
0.0768
0.0145
0.0196
^AORD
SQR
0.4394***
0.5112***
0.4784***
0.4439***
0.4416***
^AORD
ABS
0.5437***
0.5347***
0.5199***
0.4787***
0.4732***
AEX
RET
0.0534
0.0587
0.0845
0.0664
0.0462
AEX
SQR
0.3976***
0.5022***
0.5479***
0.6041***
0.4885***
AEX
ABS
0.4480***
0.5352***
0.5844***
0.6039***
0.5236***
DAX
RET
0.0452
0.1057
0.0589
0.0461
0.0188
DAX
SQR
0.4379***
0.4687***
0.4733***
0.5163***
0.4409***
DAX
ABS
0.5092***
0.5557***
0.5075***
0.5206***
0.4617***
DJA
RET
0.0335
−0.0010
−0.0094
−0.0083
−0.0378
DJA
SQR
0.4956***
0.6507***
0.5962***
0.6217***
0.5795***
DJA
ABS
0.5296***
0.5444***
0.5752***
0.5685***
0.5432***
FCHI
RET
−0.0508
−0.0125
−0.0107
−0.0279
−0.0665
FCHI
SQR
0.4471***
0.5002***
0.4672***
0.4760***
0.4020***
FCHI
ABS
0.4772***
0.5456***
0.5104***
0.4913***
0.4583***
FTSE 100
RET
0.0419
0.0181
0.0097
−0.0341
−0.0070
FTSE 100
SQR
0.4772***
0.5546***
0.5040***
0.5209***
0.4349***
FTSE 100
ABS
0.4560***
0.5086***
0.4824***
0.4883***
0.4748***
HANGSENG
RET
0.0305
0.1449
0.0930
0.0497
−0.0007
HANGSENG
SQR
0.3434***
0.4237***
0.4435***
0.4970***
0.3406***
HANGSENG
ABS
0.5276***
0.5577***
0.5535***
0.5292***
0.4257***
NIKKEI
RET
0.0038
−0.0009
−0.0356
0.0009
−0.0398
NIKKEI
SQR
0.2670***
0.3203***
0.4461***
0.5505***
0.4445***
NIKKEI
ABS
0.3399***
0.3556***
0.4705***
0.5189***
0.4235***
STRAITS TIMES STRAITS TIMES STRAITS TIMES
RET
0.1409
0.2116***
0.1364***
0.1302***
0.0772
SQR
0.3807***
0.4238***
0.4586***
0.5016***
0.4531***
ABS
0.5001***
0.5068***
0.4954***
0.4840***
0.4357***
TSX
RET
0.1109
0.1539
0.0760
0.0293
−0.0069
TSX
SQR
0.6009***
0.7026***
0.5343***
0.6165***
0.6340***
TSX
ABS
0.6258***
0.6424***
0.5020***
0.5189***
0.5284***
Emerging Markets
DOI: 10.4236/tel.2018.88096
BUX
RET
0.0717
0.1361**
0.1306**
0.0481
0.0442
BUX
SQR
0.2938***
0.3622***
0.4588***
0.5523***
0.5145***
1508
Theoretical Economics Letters
S. N. Bhattacharya et al. Continued BUX
ABS
0.3498***
0.3818***
0.4330***
0.4484***
0.4022***
IBOVESPA
RET
0.0596
0.1052
0.1079**
0.1229***
0.0363
IBOVESPA
SQR
0.3728***
0.6161***
0.6610***
0.5883***
0.5486***
IBOVESPA
ABS
0.4539***
0.5401***
0.5225***
0.4638***
0.4152***
IPSA
RET
0.1293
0.0435
0.0150
0.0403
−0.0081
IPSA
SQR
0.2108***
0.2418***
0.2984***
0.3637***
0.4395***
IPSA
ABS
0.3669***
0.4634***
0.4440***
0.4343***
0.4109***
KLSE
RET
−0.0127
0.0619
0.0056
−0.0025
0.0440
KLSE
SQR
0.0849
0.0054
0.0661
0.0327
0.0084
KLSE
ABS
0.2483**
0.2081**
0.2026***
0.1687***
0.1398***
KOSPI
RET
0.0205
0.1119
0.0366
−0.0414
−0.0365
KOSPI
SQR
0.4226***
0.4773***
0.3778***
0.4072***
0.3728***
KOSPI
ABS
0.6117***
0.6416***
0.4991***
0.4807***
0.4423***
MICEX
RET
0.1642
0.1364
0.0794
0.0360
0.0103
MICEX
SQR
0.4601***
0.6681***
0.6894***
0.6371***
0.2798***
MICEX
ABS
0.5151***
0.5597***
0.6022***
0.5355***
0.3344***
MXXIPC
RET
0.0138
0.0454
0.0538
0.0478
0.0131
MXXIPC
SQR
0.3047***
0.4762***
0.5066***
0.5062***
0.4480***
MXXIPC
ABS
0.4557***
0.5045***
0.4866***
0.4558***
0.4736***
NIFTY
RET
0.0517
0.0998
0.1291
0.1049**
0.0549
NIFTY
SQR
0.2939***
0.3607***
0.3664***
0.3309***
0.2869***
NIFTY
ABS
0.4027***
0.4669***
0.4886***
0.4293***
0.3957***
SHCOMP
RET
0.2145
0.1144
0.0966
0.0355
−0.0136
SHCOMP
SQR
0.5849***
0.4347***
0.3642***
0.2915***
0.3152***
SHCOMP
ABS
0.6049***
0.4882***
0.4515***
0.3825***
0.3666***
TWII
RET
0.1026
0.0505
0.0366
0.0733
0.0250
TWII
SQR
0.5643***
0.4872***
0.3933***
0.3210***
0.2881***
TWII
ABS
0.5742***
0.5030***
0.4609***
0.4233***
0.3413***
*** & ** denotes significance at 1% and 5% level respectively (Source: Author Calculation).
DOI: 10.4236/tel.2018.88096
1509
Theoretical Economics Letters