Human Molecular Genetics, 2016, Vol. 25, No. 8
1648–1662
doi: 10.1093/hmg/ddw042 Advance Access Publication Date: 16 February 2016 Original Article
ORIGINAL ARTICLE
A low absolute number of expanded transcripts is involved in myotonic dystrophy type 1 manifestation in muscle Anke E. E. G. Gudde, Anchel González-Barriga†, Walther J. A. A. van den Broek†, Bé Wieringa‡ and Derick G. Wansink*,‡ Department of Cell Biology, Radboud Institute for Molecular Life Sciences, Radboud University Medical Center, Geert Grooteplein 28, 6525 GA Nijmegen, The Netherlands *To whom correspondence should be addressed. Tel: +31 243610566; Email:
[email protected]
Abstract Muscular manifestation of myotonic dystrophy type 1 (DM1), a common inheritable degenerative multisystem disorder, is mainly caused by expression of RNA from a (CTG·CAG)n-expanded DM1 locus. Here, we report on comparative profiling of expression of normal and expanded endogenous or transgenic transcripts in skeletal muscle cells and biopsies from DM1 mouse models and patients in order to help us in understanding the role of this RNA-mediated toxicity. In tissue of HSA LR mice, the most intensely used ‘muscle-only’ model in the DM1 field, RNA from the α-actin (CTG)250 transgene was at least 1000-fold more abundant than that from the Dmpk gene, or the DMPK gene in humans. Conversely, the DMPK transgene in another line, DM500/DMSXL mice, was expressed ∼10-fold lower than the endogenous gene. Temporal regulation of expanded RNA expression differed between models. Onset of expression occurred remarkably late in HSA LR myoblasts during in vitro myogenesis whereas Dmpk or DMPK (trans)genes were expressed throughout proliferation and differentiation phases. Importantly, quantification of absolute transcript numbers revealed that normal and expanded Dmpk/DMPK transcripts in mouse models and DM1 patients are low-abundance RNA species. Northern blotting, reverse transcriptase–quantitative polymerase chain reaction, RNA-sequencing and fluorescent in situ hybridization analyses showed that they occur at an absolute number between one and a few dozen molecules per cell. Our findings refine the current RNA dominance theory for DM1 pathophysiology, as anomalous factor binding to expanded transcripts and formation of soluble or insoluble ribonucleoprotein aggregates must be nucleated by only few expanded DMPK transcripts and therefore be a small numbers game.
Introduction Myotonic dystrophy type 1 (DM1, OMIM no. 160900) is an autosomal dominant repeat expansion disorder, affecting skeletal and smooth muscle as well as the heart, the endocrine system, the eye and the central nervous system (1). The multisystemic
manifestation and progression of DM1 are caused by expansion of a (CTG·CAG)n repeat, located in the 3′-untranslated region (3′ UTR) of the dystrophia myotonica protein kinase (DMPK) gene (2) and in an overlapping antisense transcription unit in the DM1 locus (3). In DM1 families the expanded repeat is unstable, both
†
A.G.B and W.J.A.A.v.d.B. contributed equally to this work. B.W. and D.G.W jointly supervised this work. Received: November 26, 2015. Revised and Accepted: February 9, 2016
‡
© The Author 2016. Published by Oxford University Press. This is an Open Access article distributed under the terms of the Creative Commons Attribution Non-Commercial License (http://creativecommons.org/ licenses/by-nc/4.0/), which permits non-commercial re-use, distribution, and reproduction in any medium, provided the original work is properly cited. For commercial re-use, please contact
[email protected]
1648
Human Molecular Genetics, 2016, Vol. 25, No. 8
| 1649
Table 1. Characteristics of DM1 mouse models used in this study. Transgene copy number
Promoter
Expression
(CTG)n
Genetic background
References
Human DM1 locus (43 kb transgene)
1
>90% C57BL/6
(23)
1
∼1300
>90% C57BL/6
(24)
Human DMPK gene (14 kb transgene)
∼25
All DM1-related tissues (e.g. skeletal muscle, heart and CNS) All DM1-related tissues (e.g. skeletal muscle, heart and CNS) All DM1-related tissues (e.g. skeletal muscle, heart and CNS) Skeletal muscle only
500–600
Human DM1 locus (43 kb transgene)
Human DMPK (∼11.5 kb region upstream of main TSS) Human DMPK (∼11.5 kb region upstream of main TSS) Human DMPK (∼1.9 kb region upstream of main TSS) Human α-actin (∼2.1 kb region upstream of TSS)
11
FVB/n
(25)
220–250
FVB/n
(27)
n.a.
n.a.
n.a.
>90% C57BL/6
n.a.
Mouse model Transgene
DM500 (DM300328 line) DMSXL (DM300328 line) Tg26
HSA LR (LR20b Human α-actin gene; line) CTG repeat inserted in 3′ UTR (7.1 kb transgene) WT No transgene
2
n.a.
TSS, transcription start site; n.a., not applicable.
somatically and intergenerationally, with a bias toward expansion, causing progression of disease symptoms during ageing and over successive generations (4). Several mechanisms may contribute to the molecular pathogenesis of DM1 (5). Expanded DMPK transcripts are retained in the nucleus, where they form focal complexes in insoluble or diffusesoluble state by abnormal association with transcription factors and RNA-binding proteins, like members of the muscleblindlike family (MBNL1–3), DEAD-box helicases and hnRNP proteins (1,6,7). In turn, abnormal phase transitions in RNP complexes lead to sequestering of factors needed for processing of other transcripts with in trans consequences for faithful alternative splicing and polyadenylation and expression of miRNAs (7,8). Production of proteins by ribosomes that decode the normally untranslated (CUG)n repeat tract in DMPK mRNA by a newly discovered process, coined repeat-associated non-ATG (RAN) translation, is also possible (9,10). Similar toxic events may occur with antisense transcripts originating from the complementary strand of the DM1 locus, overlapping the 3′ end of the DMPK gene. Abnormal RNAs are thus formed with an expanded (CAG)n repeat, potentially leading to the production of homopolymeric peptides by RAN translation of the (CAG)n repeat, which may evoke an imbalance in proteostasis (9,10). Finally, it cannot be excluded that problems with DNA replication across the repeat tract or abnormal epigenetic modification of the chromatin region containing the DM1 locus also contribute to pathology (3,11). Together, alterations in the transcriptome, proteome and replisome may compromise the physiological integrity of cells and tissues in which the mutant DMPK and the DM1-antisense gene are expressed. Throughout development, growth and adulthood this imbalance may lead to the loss of function and ultimately to cell degeneration, causing the muscle wasting and CNS white matter loss in patients (4,12). For study of biological mechanisms underlying DM1 pathology and for testing of possible therapeutic strategies in preclinical studies, several animal models are available, including Drosophila, zebra fish and mouse (13,14). Predominant focus is thereby oriented toward mechanisms involved in RNA-based disease etiology. Notably, DM1 animal models differ profoundly in nature, structural organization and chromatin context of their transgenic insert and in the length of the (CTG·CAG)n segment
therein. Comparison of pathobiological findings between models and extrapolation to the situation in patients remain therefore difficult. Work of others has already demonstrated that the timing of DMPK expression, i.e. the onset of potential RNA toxicity, influences phenotypic severity (15). Expression of RNA with an abnormal repeat tract in satellite cells or neuronal progenitor cells may affect proper muscle and brain development (16–19) and have serious consequences for tissue regenerative capacity in adulthood. The absolute number of expanded RNAs and their structure at any given moment may also be crucial, as these ultimately will influence the extent of toxicity caused by abnormal RNP binding or abnormal properties of RAN translation products (20–22). The type of gene promoters, whether from endogenous or ectopic origin, that drive transcription during development and ageing, and the structure of the transcripts that entail the repeat segment are therefore critical parameters in animal models and patients. Here, we report on comparison of expression and measurement of absolute numbers of (CUG)n-repeat containing RNAs in muscle cells and tissues of four commonly used mouse DM1 models and in cells and biopsies from patients. DM1 mouse models express transgenes with different promoters, different structural organization and different repeat lengths: DM500, DMSXL, Tg26 and HSA LR (Table 1). DM500 and DMSXL mice are both descendants of the DM300-328 line, which was subject to intergenerational repeat expansion. These mice carry a complete human DM1 locus (23,24). The DMPK transgene in Tg26 mice carries a tandem insert of ∼25 copies of the complete human DMPK gene, with a normal-sized (CTG)11 repeat (25,26). In HSA LR mice, the transgene is under control of the ACTA1 promoter and the repeat is embedded in the context of the ACTA1 gene (27). The rationale for quantification of repeat RNA expression in these models is that knowledge about toxic RNA concentration will provide us with more insight in pathophysiological cascades per se, especially as more and more anatomical, physiological and behavioral phenotype data become available, enabling relatively easy cross comparisons. Furthermore, some of the DM1 models have already been extensively used for preclinical translational studies in the past decade, but translation of findings in these models has been difficult. We demonstrate that, in comparison with expression of normal and mutant DMPK transcripts in patient cells, considerable
1650
| Human Molecular Genetics, 2016, Vol. 25, No. 8
variation exists in level and developmental timing of transgene expression in DM1 cell and animal models. A remarkable low level of expression with absolute numbers of, at most, a few dozen RNA molecules per cell was observed for DMPK transcripts in human samples. Our findings highlight the hitherto unrecognized involvement of low-abundance RNA molecules in DM1 pathophysiology, altering our current view on the RNA gainof-function theory, which explains the role of repeat RNA in DM1 manifestation. We discuss the possible implications of our findings for future interpretation of data from fundamental and translational studies in which these DM1 models and patient cells will be used.
Results Derivation of myogenic cell lines from DM1 mouse models Characteristics of mouse models included in this study are listed in Table 1. For profiling of transgene expression at the cellular level, we established conditionally immortalized myoblast populations from each model by pooling clones of individual cells derived from the calf muscle complex from double hemizygous mice carrying one transgenic DM1 allele and one H-2Kb-tsA58
allele (28). As there is strong evidence that satellite cells from different inbred mice behave intrinsically differently (29,30), it is important to note that crossings included different genetic backgrounds to generate the double hemizygous animals. The cell populations have therefore distinct mixed genetic backgrounds with contributions of C57BL6, FVB/n, CBA/Ca and C57BL/10. We do believe, however, that these differences have no major impact on transcriptome composition and therefore should not overtly confound our comparison. An important feature of the immortalized myoblasts is that during prolonged passaging in culture under permissive conditions cells have the tendency to undergo polyploidization, as an effect of the presence of the temperature-sensitive SV40 large T-antigen (31). This leads to a mix of 2N and 4N cells in populations of the different lineages and to variation in the absolute abundance of individual transcripts per cell (Supplementary Material, Fig. S1A). Hence, all possible care was taken to compare myoblasts from similar passage numbers. DM500, DMSXL, HSA LR and WT myoblast populations had normal morphological appearance and showed apparently normal proliferative capacity and terminal differentiation features upon shift to myogenesis-promoting conditions (Fig. 1). Multinuclear contractile myotubes appeared after 3–5 days of differentiation. The Tg26 cell population had normal morphological
Figure 1. Morphology of myoblasts derived from DM1 and control mouse models. Conditionally immortalized myoblasts were derived from the GPS muscle complex of DM1 mouse models. Myoblasts differentiated into contractile myotubes under low-serum conditions. Representative images of cultures during proliferation (Day -2), confluency (Day 0) and differentiation (Days 1, 3 and 7) are shown. Bar 100 µm.
Human Molecular Genetics, 2016, Vol. 25, No. 8
| 1651
Figure 2. Expression profile of proliferating and differentiating myoblasts derived from DM1 and control mouse models. Analysis of endogenous Acta1 (A), transgene (B) and endogenous Dmpk (C) mRNA levels by northern blotting. Each hybridization signal was normalized to that of 18S rRNA and then compared with the normalized value measured for the same (trans)gene in the GPS muscle from that particular DM1 mouse model. Data were obtained from two independent culture series per cell line, for which triplicate cultures per series were pooled and analyzed; bars represent mean + SEM. For profiling of endogenous Dmpk (C) in Tg26 samples RT-qPCR was used, because signals of transgenic DMPK and endogenous Dmpk overlapped on northern blot. Bars represent mean + SEM. Timing of differentiation on the x-axis refers to Figure 1.
appearance, but showed slightly disordered cell alignment and diminished fusion capacity upon induction of differentiation. This may be due to overproduction of certain DMPK protein isoforms (26,32,33). To quantify gene expression during proliferation and differentiation of the myoblast populations, RNA was isolated at various time points and analyzed by northern blotting and reverse transcriptase–quantitative polymerase chain reaction (RT-qPCR). Progression of myogenic differentiation in vitro was accompanied by a clear increase in skeletal muscle α-actin (Acta1) mRNA (Fig. 2A), a well-known differentiation marker encoding a major constituent of the contractile apparatus (34–36). The increase was less profound in Tg26 cultures, in accordance with their diminished fusion capacity. Whereas Acta1 was induced, β-actin (Actb) expression decreased during the 7-day differentiation period (Supplementary Material, Fig. S2) (37). For reference, primary human muscle cells obtained from a healthy individual and two DM1 patients were also included in our study. Myoblasts with healthy (CTG)5/(CTG)5 or diseasespecific (CTG)21/(CTG)200 or (CTG)11/(CTG)760 repeat combinations appeared morphologically diverse, which can be explained by their different origin and culture history (Fig. 3). Multinucleated myotubes were formed during differentiation, but spontaneous contractions were never observed (Fig. 3, data not shown). RNA expression analysis corroborated this observation by showing that ACTA1 expression was minimal at all time points measured and remained low in comparison with Acta1 levels in DM500 GPS tissue (Fig. 4A). We, therefore, conclude that human cultures did not attain the same endpoint of terminal differentiation as mouse myoblasts under our in vitro conditions.
Transgene expression differs between DM1 myoblast models Transgene expression was assayed in the myoblast populations during proliferation and differentiation (Fig. 2B and Supplementary Material, Fig. S3). DMPK transgene expression in differentiating DM500 and DMSXL cells transiently increased 3- to 10-fold and then returned to basal levels in proliferating myoblasts. A modest increase in transgene expression was also observed in differentiating Tg26 myoblasts, but this change appeared to be more permanent. In contrast, transcript levels from the Dmpk gene hardly varied with differentiation state in any of the five myoblast populations (Fig. 2C). The observed differential regulation of endogenous/transgenic Dmpk/DMPK expression may be caused by (i) species differences between the structure and function of Dmpk/DMPK promoters, (ii) differences in the length of the region upstream of the TSS in the human transgenes used (Table 1), (iii) differences between chromosomal insert sites and the endogenous Dmpk locus or (iv) different epigenetic alterations across the transgenic loci. Influence of the (CUG)n-repeat length on RNA stability is unlikely, because temporal profiles of transgenic RNA expression in DM500 and DMSXL cells during myogenic differentiation levels were highly similar. For DMPK expression in human myoblasts, we performed separate quantitative analysis of healthy and expanded transcripts, which migrate differentially on northern gels. Steady-state levels of normal and expanded DMPK RNA molecules were approximately similar for both the 21/200 and the 11/760 patient cell cultures (Fig. 4B). Comparison of total DMPK expression levels between healthy 5/5 and patient cell cultures showed variation.
1652
| Human Molecular Genetics, 2016, Vol. 25, No. 8
Figure 3. Morphology of primary human DM1 and healthy myogenic cells. Human primary myoblasts aligned and fused under low-serum conditions. Representative images at different time points during proliferation (Day -2), confluency (Day 0), and differentiation (Days 1, 3 and 7) are shown. The number of CTG triplets for the two DMPK alleles are indicated for the one healthy (5/5) and two DM1 (21/200 and 11/760) cultures. Bar 100 µm.
Figure 4. Expression profile of proliferating and differentiating primary human DM1 myogenic cells. Assessment of ACTA1 (A) and DMPK (B) transcript levels by northern blot analysis. Signal strength in each sample was normalized to that of 18S rRNA, as outlined in the legend of Figure 2. To facilitate direct comparison with DM1 mouse model-derived myoblasts, ratios were related to Acta1 and Dmpk levels in DM500 GPS muscle. Data were obtained from two independent culture series per cell line, for which triplicate cultures per series were pooled and analyzed; bars represent mean + SEM. Stacked bar graphs show levels of normal-sized DMPK (black part) and expanded DMPK (white part) in patient-derived cultures. On average, the ratio expanded versus normal-sized DMPK transcripts was 0.63 for 21/200 and 0.84 for 11/760. Timing of differentiation on the x-axis refers to Figure 3.
However, temporal profiles had a similar shape with a peak in expression during early differentiation, alike expression behavior of DMPK transcripts from the DMPK transgene in mouse myoblasts. This supports our idea that species-specific differences in the DMPK/Dmpk promoter explain the differential expression pattern of DMPK and Dmpk transcripts. For better interpretation of in vitro and in vivo findings, we compared DMPK transgene expression in myogenic cultures to that in parental GPS muscle in the DM1 models. Transgene expression
was ∼0.6- to 6-fold higher, 6- to 18-fold higher and 3- to 11-fold lower for DM500, DMSXL and Tg26 myoblast/myotube cultures, respectively (Fig. 2B). Of particular, interest was the expression profile of the expanded ACTA1 transgene in differentiating myoblasts from the HSA LR model, showing that transcripts were expressed only late in differentiation (Fig. 2B). Even in fully differentiated hemizygous HSALR myotubes in vitro, expanded ACTA1 transgene expression remained ∼200-fold lower than in GPS muscle from homozygous HSALR mice.
Human Molecular Genetics, 2016, Vol. 25, No. 8
| 1653
Figure 5. Transgene expression in DM1 mouse skeletal muscle. Expression of Acta1, Dmpk and transgenes was determined in GPS muscle of each DM1 mouse model. Transcripts were quantified by northern blotting using 18S rRNA for normalization (n ≥ 4). Endogenous Dmpk RNA levels in DM500 GPS muscle were used as reference (set to one). Mean + SEM are shown. a.u., arbitrary units; n.d., not determined (Dmpk and transgenic signals overlap); n.a., not applicable.
Transgene expression in distinct DM1 mouse models differs over a 1000-fold range By extending our analysis to mouse muscle in vivo, using the GPS complex as RNA source and 18S rRNA for normalization, our comparison revealed that Acta1 expression was remarkably similar between models (Fig. 5 and Supplementary Material, Fig. S4A), despite differences in their genetic background (Table 1). Also Dmpk expression showed only minor fluctuations. Whereas Acta1 and Dmpk expression did not vary >2- to 4-fold between mouse models, the mean level of Acta1 RNA was ∼2,500-fold higher than that of Dmpk RNA. We next compared transgene expression in GPS muscles from DM500, DMSXL and Tg26 mice. Quantification was straightforward, since all models expressed differentially expanded, but otherwise similar and intact DMPK transgenes. Transgenic DMPK RNA accumulated in muscle from hemizygous DM500 and DMSXL mice to a 10-fold lower level than RNA from the endogenous Dmpk genes (Fig. 5). In contrast, hemizygous Tg26 GPS muscle expressed 20- to 25-fold more DMPK mRNA than Dmpk mRNA [assuming that Dmpk expression in Tg26 mice (FVB background) was similar to that in DM500 mice (C57BL/6 background)]. Determination of relative levels of transgenic RNA in HSA LR muscle appeared more challenging. Use of a (CAG)9 probe to detect (CUG)n segments, the only sequence shared between transgenic products, proved unreliable to compare RNAs with different repeat lengths (data not shown). Therefore, a balanced mix of ACTA1 and DMPK probes, generated by random-primed labeling on cDNA templates of equal size was used instead (see the Materials and Methods’ section). With this approach we found ACTA1 (CUG)n RNA over 1000-fold higher expressed than Dmpk mRNA in homozygous HSA LR mice (Fig. 5). This means that the concentration of expanded transcripts in HSA LR muscle is extraordinarily high and similar to that of Acta1 mRNA. This finding is perhaps not too surprising as both promoter and backbone of the human transgene and the Acta1 gene share strong homology.
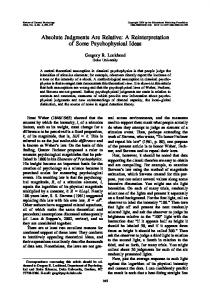
Analysis of DMPK RNA levels in human muscle allows direct interpretation of transgene dosage Skeletal muscle samples from healthy humans and DM1 patients were included in our study to extend our comparisons. DMPK mRNA expression in the samples varied, but was not >3-fold higher than the level of Dmpk mRNA in mouse GPS tissue (Fig. 6). Expression of normal-sized and of expanded DMPK alleles were about equal in each of the patient samples. Since DMPK levels in human muscles and Dmpk levels in mouse muscle show high similarity, observations about transgene expression dosage
effects in DM1 mice may be directly translated to relevance for DM1 patients. Any difference in DMPK mRNA content between human samples probably represents variation in fiber type and muscle origin or must be caused by differentiation or disease state. Note that, effects of ageing on repeat length heterogeneity were clearly visible on northern blot: in samples from adult DM1 patients a smear was observed for RNA from the expanded allele, whereas in congenital DM (CDM) patient material a defined signal was apparent (Fig. 6) (38).
Multi-pronged analysis reveals low copy number of expanded DMPK transcripts For further stoichiometric and pathomechanistic considerations, we decided to determine the absolute number of DMPK mRNA copies per cell. Quantification on northern blot, after normalization for signal strength and correction for probe length, revealed that DMPK/Dmpk expression was 400- to 2000-fold lower than that of ACTB/Actb in proliferating human/mouse myoblasts (Fig. 7A and Supplementary Material, Fig. S4B). Based on known values for the copy number of ACTB/Actb mRNA, which ranges from 350 to 8000 per cell (39–42) (Supplementary Material, Table S1), we inferred that the absolute number of DMPK transcripts must be in the range of 1–20 per cell. In patient myoblasts, this population consists of approximately equal numbers of normal-sized and expanded DMPK transcript molecules (Figs. 4 and 7A). To validate this rough estimate, DMPK RNA copy number was quantified using two in vitro transcribed DMPK RNAs as standard references in RT-qPCR (Supplementary Material, Fig. S5). We found 20–25 DMPK transcripts per proliferating 11/760 myoblast and 45–50 DMPK molecules in myoblasts just prior to the onset of myogenic differentiation (Fig. 7B). This number includes both healthy and expanded DMPK transcripts. On average about four expanded DMPK transcripts per cell were detected in DM500 myoblasts. Thirdly, we used RNA-sequencing data of healthy and DM1 skeletal muscle (available via www.dmseq.org) to estimate DMPK transcript copy number. We calculated the DMPK:GAPDH ratio based on RNA-sequencing signal and found that DMPK mRNA molecules were 60- to 160-fold less abundant than GAPDH mRNA (Fig. 7C). Based on current estimates for the prevalence of GAPDH RNA, which is in the order of 250–2900 molecules per cell (39,42– 45) (Supplementary Material, Table S2), DMPK transcript copy number must be between 2 and 50 per cell. Finally, we determined the number of fluorescent in situ hybridization (FISH)-detectable RNP complexes in mouse and human myoblasts using a Cy3-labeled (CAG)7 probe. Initial
1654
| Human Molecular Genetics, 2016, Vol. 25, No. 8
Figure 6. DMPK expression in human control and DM1 patient tissue. Northern blot (left) of human control and DM1 muscle tissue using a DMPK and a (CAG)9 repeat probe. Healthy DMPK mRNA appeared as a defined band in all tissues. Expanded DMPK mRNA appeared as a defined band in congenital DM1 tissue (CDM-e and -f ), but as a smear (representing somatic mosaicism of repeat size) in adult DM1 tissue (DM1-c and -d). As size markers, we indicated the location of DMPK (CUG)700 and (CUG)1300 transcripts. DMPK transcript levels, normalized to those of 18S rRNA, were plotted relative to Dmpk transcript levels in DM500 GPS muscle to allow for comparison with DM1 mouse models (right). Stacked bar graphs show levels of normal-sized DMPK (black part) and expanded DMPK (white part) in patient-derived samples. The ratio expanded versus normal-sized DMPK transcripts was 0.33 in DM1-c; 0.92 in DM1-d; 0.84 in CDM-e and 1.79 in CDM-f.
analyses demonstrated that the number of FISH signals slightly varied between myoblast pools and experiments and was influenced by culture conditions, such as cell density, feeding regime or changes in the culture medium (data not shown). This variation in foci number appeared suppressible by maintaining a very strict scheme for cell culture. On average, 5–9 foci per cell were detected in DM500 myoblasts (Fig. 8A and B). The number of foci differed between diploid and tetraploid DM500 myoblasts, with averages of ∼5 and ∼9 foci per cell, respectively (Supplementary Material, Fig. S1B). For reasons unknown, we also consistently observed signals in WT mouse myoblasts (Fig. 8A and B). These signals could not be distinguished from expanded DMPK (CUG)n mRNA signals and may also be present in other cell types from mouse. In cells from human origin, we did not observe overt background signals, so the problem may be species specific. To deal with this issue, we decided to apply a correction by defining a background interval in Figure 8. After this correction, an average of two transgenic expanded (CUG)n-specific foci per cell remained in DM500 myoblasts. Foci counts in Tg26 and HSA LR myoblasts were within the background range, as expected, based on the idea that the (CTG)11 repeat in Tg26 RNA cannot yield sufficient signal and our finding that the HSA LR transgene is barely expressed in proliferating myoblasts. In 11/760 patient myoblasts 3–4 foci per nucleus were detected, whereas no signal was observed in 21/200 and 5/5 myoblasts (Fig. 8C and D), obviously caused by lack of FISH-signal strengths by the limited length of the repeat target. All data combined, we conclude that mouse and human myoblasts each contain up to half a dozen foci. We have to keep in mind that FISH protocols may detect transcripts with an efficiency of only 30–50% (41), for example, due to inaccessibility of the transcripts to the probe or loss of RNA molecules from the fixed cells during washing. Thus, the actual number of RNP complexes that appear as foci may be 2- to 3-fold higher. Given our estimates for the absolute number of expanded transcripts, our data suggest
that every RNP complex that forms a FISH-visible aggregate is nucleated by one or only few expanded (CUG)n transcripts.
Discussion DM1 is considered a prototypical RNA-dominant disorder, because its neurodegenerative and myopathic manifestation is thought to be based on processes wherein repeat-containing RNAs play a crucial role. Much of our current knowledge on the presumed toxic role of RNA in DM1 pathophysiology originates from direct comparison of findings in mutation carriers with findings in transgenic animals or genome edited cells. This is often done with simple bypassing of the fact that models may differ profoundly in nature, structural organization and chromatin context of the transgene and in length of the contained (CTG·CAG)n repeat (13,14). A major unsolved aspect of DM1 etiology is how repeat length and dose and nature of abnormally expanded RNA transcripts affect onset and complexity of disease manifestation and its rate of progression and severity. Quantitative studies of transcript production could thus help to explain differential experimental findings with distinct DM1 models and add to conceptual progress. Here, we used gene expression profiling to compare relative abundance and absolute copy number of expanded repeat RNAs between muscle cells from patients and mouse models that are among the most commonly used in the DM1 field. Our analyses unveiled differences in timing of production during myogenic differentiation as well as in the abundance of (CUG)n transcripts between DM1 mouse model and patient muscle cells. Expression of DMPK transgenes in DM500, DMSXL and Tg26 mice is at a basal level in proliferating myoblasts and peaks early in differentiation in a manner similar to the profile of endogenous DMPK expression in human myoblasts. Increase in DMPK expression at the start of myogenic differentiation was earlier reported for human cells (46) and also seen for C2C12
Human Molecular Genetics, 2016, Vol. 25, No. 8
| 1655
Figure 7. DMPK RNA copy number in human and mouse myoblasts. The absolute number of DMPK transcripts per cell was calculated based on experimental data from northern blotting (A), RT-qPCR (B) and RNA-sequencing (C). (A) Stacked bar graph showing DMPK/Dmpk:ACTB/Actb transcript ratios determined from signal strengths on northern blots for human myoblast lines 5/5, 21/200 and 11/760, and mouse myoblasts lines WT and DM500 (Supplementary Material, Fig. S4B). (B) DMPK transcript copy number in 11/760 and DM500 myoblasts was determined on the basis of known amounts of synthetic DMPK RNA fragments in RT-qPCR (Supplementary Material, Fig. S5). Note that, normal-sized and expanded DMPK transcripts could not be measured independently. (C) DMPK:GAPDH ratio based on RNA-sequencing signal of healthy and DM1 TA and quadriceps (Quad) tissue (www.dmseq.org). Each data point represents a single tissue. Mean + SEM (A and B), or mean only (C) are shown. Descriptions d-2 and d0 refer 938 to Figures 1 and 3.
mouse myoblasts (47). Our group (25) and others (32) have demonstrated that the actual onset of DMPK expression is already seen in somites in the developing embryo, well before the actual commitment to specific muscle cell fate and the onset of myogenesis. DM500/DMSXL- and Tg26-derived myoblasts carry transgenes of different size that may lack regulatory elements upstream of the DMPK TSS, but the proximal promoter sequence and the enhancer sequence in Intron 1 (elements responsive to MyoD via conserved E-boxes (48)), are present. Thus, regulatory sequences from the human locus may drive ‘near-natural’ behavior of these transgenes and control the peak-shaped up-regulation with transient increase in transcriptional activity during early differentiation. The ‘human-like’ regulation of the DMPK transgene renders these mouse myoblasts useful models for study of toxic effects of normal or expanded DMPK RNA in early development. Others have demonstrated that early-onset expression of repeat-containing RNA may influence phenotypic severity by affecting proper tissue development in animals in vivo (16–19).
In HSA LR myoblasts, expression of repeat-containing RNA was hardly detectable until late in differentiation in vitro. Conspicuously, the Acta1 gene, whose human counterpart served as the recipient body for the transgene with (CTG)250 repeat insertion, showed an earlier onset of expression in differentiating mouse cells. The explanation for this differential behavior may thus be that the proximal promoter is present in the transgene, but that a cis-regulatory module in a region that activates transcription in differentiating myoblasts, >20 kb downstream of the basal promoter (49), is lacking. We found pronounced differences in the abundance of (CUG)nrepeat RNAs from transgenes and RNA products from the endogenous Dmpk gene and between expanded RNAs from cell lineages and the transgenic mouse tissues from which they originate. For proliferating cells, comparison was only meaningful for Tg26, DM500 and DMSXL myoblasts, as HSA LR myoblasts essentially lacked expression of expanded (CUG)n RNA. As explained by the presence of multiple copies of the DMPK gene in the transgenic insert in Tg26 cells, DMPK levels were relatively high. Transcripts from the
1656
| Human Molecular Genetics, 2016, Vol. 25, No. 8
Figure 8. (CUG)n foci number in DM1 mouse and human myoblasts. Representative RNA FISH images using a (CAG)7 oligo probe (A and C) and quantification (B and D) of (CUG)n foci in DM1 mouse and human myoblasts. (A and B) RNA FISH signal in WT and DM500 myoblasts. In WT mouse myoblasts foci were observed which cannot be specific for the transgenic expanded (CUG)n transcripts. As these signals may also be present in cell lines derived from other mouse lineages, including the transgenic models, we defined a level of uncertainty, plotted as a shaded area in (B). Thus, an average of two expanded (CUG)n-specific foci per cell remained in DM500 myoblasts and no specific foci were identified in Tg26 and HSA LR myoblasts. (C and D) RNA FISH on human healthy (5/5) and DM1 (21/200 and 11/760) myoblasts. Foci were only detected in 11/760 cells. Each data point represents foci number in one nucleus; mean is plotted in graph. Bar 20 µm. ***P < 0.001.
DMPK transgene in DM500 and DMSXL cells were ∼10-fold lower than transcripts from the Dmpk gene in these myoblasts. Even if we take into account that these observations reflect the production rate from one DMPK transgene versus two Dmpk genes in the DM500 cell model, transgenic RNA production is still ∼5-fold lower. Intrinsic differences in regulatory capacity of DMPK and Dmpk promoters may partly explain this observation, but we cannot exclude involvement of progressive epigenetic alterations, like DNA methylation or heterochromatization of the transgene
or the DMPK promoter. Brouwer et al. (50) observed decreased transgene expression with age in the DM300-328 lineage, the ancestral mouse model from which DM500 and DMSXL mice and thus DM500 and DMSXL cells originate. Cis effects of repeat presence may have contributed to methylation state alterations in the DMPK transgene (50). Also transient propagation of mice in the homozygous state may have triggered partial gene silencing even before the myoblasts were derived in vitro (51–53). Finally, we cannot exclude effects of experimental handling, for example, by the
Human Molecular Genetics, 2016, Vol. 25, No. 8
use of dimethylsulfoxide during repeated cell freezing, which can affect the epigenetic state and is a known modulator of differentiation programming (54). Although we did not systematically study expression levels over time, we have the impression that DMPK expression in DM500 cells decreases with increasing passage number [compare data shown in (55)]. This could point to the influence of epigenetic silencing, explaining also variability in observations of different research groups in the DM1 field. Also in muscle tissue obtained from hemizygous DM500 and DMSXL mice DMPK transcripts were 10-fold less abundant than Dmpk RNAs, confirming the observation by Huguet et al. (56). The overall low level of transgene expression may explain why disease manifestation in these models is relatively mild, even in homozygous animals. Conversely, however, one can also argue that the presence of these few expanded RNAs is already sufficient to cause mild myotonia, slow progressive muscle weakness, nuclear (CUG)n foci and splicing abnormalities (1,14,57), for which compelling evidence was provided in various studies. Our most conspicuous observation was that ACTA1 (CUG)n expression in GPS muscle of homozygous HSA LR mice was over 1000-fold higher than that of Dmpk, and remarkably similar to Acta1 expression. The high (CUG)n RNA expression may explain why the HSA LR mouse lineage has by far the most severe DM1like phenotype of all models, including myotonia, extensive splice abnormalities and a conspicuous abnormal density of intranuclear foci, all limited to skeletal muscle (1,14,27). The use of expression ratios between transgenic and endogenous transcripts (e.g. Dmpk, Acta1, Actb and 18S RNA) helped us to compare repeat RNA levels between muscle cells and mouse and human tissues, but we reasoned that the knowledge of absolute transcript copy numbers in muscle would be mechanistically more informative. Absolute numbers of molecules can only be meaningfully assessed if studied on a per cell basis. Analysis of DMPK expression in the three human myoblast lineages with no, intermediate or long repeat expansions confirmed that transcripts from the wild-type and mutant allele are about equally abundant. We found no evidence for an inverse correlation between repeat the length and RNA expression level (46,58). Because endogenous DMPK/Dmpk transcripts appeared equally abundant in human and mouse myoblasts, quantitative comparison between patients and DM1 models was straightforward. Estimates for RNA expression ratios of ACTB and GAPDH, data from northern blot and RNA-sequencing analysis and absolute RT-qPCR experiments all point to the presence of at most 50 DMPK transcripts per cell. We thus propose that in patient cells 1,000 CTG repeats from the human DM1 locus. PLoS Genet., 8, e1003043. 57. Seznec, H., Agbulut, O., Sergeant, N., Savouret, C., Ghestem, A., Tabti, N., Willer, J.C., Ourth, L., Duros, C., Brisson, E. et al. (2001) Mice transgenic for the human myotonic dystrophy region with expanded CTG repeats display muscular and brain abnormalities. Hum. Mol. Genet., 10, 2717–2726. 58. Krahe, R., Ashizawa, T., Abbruzzese, C., Roeder, E., Carango, P., Giacanelli, M., Funanage, V.L. and Siciliano, M.J. (1995) Effect of myotonic dystrophy trinucleotide repeat expansion on DMPK transcription and processing. Genomics, 28, 1–14. 59. Taneja, K.L., McCurrach, M., Schalling, M., Housman, D. and Singer, R.H. (1995) Foci of trinucleotide repeat transcripts in nuclei of myotonic dystrophy cells and tissues. J. Cell Biol., 128, 995–1002. 60. Larsen, J., Pettersson, O.J., Jakobsen, M., Thomsen, R., Pedersen, C.B., Hertz, J.M., Gregersen, N., Corydon, T.J. and Jensen, T.G. (2011) Myoblasts generated by lentiviral mediated MyoD transduction of myotonic dystrophy type 1 (DM1) fibroblasts can be used for assays of therapeutic molecules. BMC Res. Notes, 4, 490. 61. Xia, G. and Ashizawa, T. (2015) Dynamic changes of nuclear RNA foci in proliferating DM1 cells. Histochem. Cell Biol., 143, 557–564. 62. Michel, L., Huguet-Lachon, A. and Gourdon, G. (2015) Sense and Antisense DMPK RNA foci accumulate in DM1 tissues during development. PLoS One, 10, e0137620. 63. Davis, B.M., McCurrach, M.E., Taneja, K.L., Singer, R.H. and Housman, D.E. (1997) Expansion of a CUG trinucleotide repeat in the 3′ untranslated region of myotonic dystrophy protein kinase transcripts results in nuclear retention of transcripts. Proc. Natl Acad. Sci. USA, 94, 7388–7393. 64. Jones, K., Wei, C., Iakova, P., Bugiardini, E., Schneider-Gold, C., Meola, G., Woodgett, J., Killian, J., Timchenko, N.A. and Timchenko, L.T. (2012) GSK3β mediates muscle pathology in myotonic dystrophy. J. Clin. Invest.,122, 4461–4472.
1662
| Human Molecular Genetics, 2016, Vol. 25, No. 8
65. Kuyumcu-Martinez, N.M., Wang, G.-S. and Cooper, T.A. (2007) Increased steady-state levels of CUGBP1 in myotonic dystrophy 1 are due to PKC-mediated hyperphosphorylation. Mol. Cell, 28, 68–78. 66. Tian, B., White, R.J., Xia, T., Welle, S., Turner, D.H., Mathews, M.B. and Thornton, C.A. (2000) Expanded CUG repeat RNAs form hairpins that activate the double-stranded RNA-dependent protein kinase PKR. RNA, 6, 79–87. 67. Olejniczak, M., Urbanek, M.O. and Krzyzosiak, W.J. (2015) The role of the immune system in triplet repeat expansion diseases. Mediators Inflamm.,2015, 873860. 68. Jucker, M. and Walker, L.C. (2013) Self-propagation of pathogenic protein aggregates in neurodegenerative diseases. Nature, 501, 45–51. 69. Zhang, Y.-J., Jansen-West, K., Xu, Y.-F., Gendron, T.F., Bieniek, K.F., Lin, W.-L., Sasaguri, H., Caulfield, T., Hubbard, J., Daughrity, L. et al. (2014) Aggregation-prone c9FTD/ALS poly(GA) RAN-translated proteins cause neurotoxicity by inducing ER stress. Acta Neuropathol.,128, 505–524.
70. Wen, X., Tan, W., Westergard, T., Krishnamurthy, K., Markandaiah, S.S., Shi, Y., Lin, S., Shneider, N.A., Monaghan, J., Pandey, U.B. et al. (2014) Antisense proline-arginine RAN dipeptides linked to C9ORF72-ALS/FTD form toxic nuclear aggregates that initiate in vitro and in vivo neuronal death. Neuron, 84, 1213–1225. 71. Jat, P.S., Noble, M.D., Ataliotis, P., Tanaka, Y., Yannoutsos, N., Larsen, L. and Kioussis, D. (1991) Direct derivation of conditionally immortal cell lines from an H-2KbtsA58 transgenic mouse. Proc. Natl Acad. Sci. USA, 88, 5096–5100. 72. Wheeler, T.M., Sobczak, K., Lueck, J.D., Osborne, R.J., Lin, X., Dirksen, R.T. and Thornton, C.A. (2009) Reversal of RNA dominance by displacement of protein sequestered on triplet repeat RNA. Science, 325, 336–339. 73. Schindelin, J., Arganda-Carreras, I., Frise, E., Kaynig, V., Longair, M., Pietzsch, T., Preibisch, S., Rueden, C., Saalfeld, S., Schmid, B. et al. (2012) Fiji: an open-source platform for biological-image analysis. Nat. Methods, 9, 676–682.