recognition performance under adverse conditions. In this work, we propose two maximum a posteriori (MAP) based algorithms to improve the online estimation ...
A MAP-based Online Estimation Approach to Ensemble Speaker and Speaking Environment Modeling Yu Tsao, Shigeki Matsuda, Chiori Hori, Hideki Kashioka, Member, IEEE, and Chin-Hui Lee, Fellow, IEEE
Abstract: An ensemble speaker and speaking environment modeling (ESSEM) approach was recently developed. This ESSEM process consists of offline and online phases. The offline phase establishes an environment structure using speech data collected under a wide range of acoustic conditions, whereas the online phase estimates a set of acoustic models that matches the testing environment based on the established environment structure. Since the estimated acoustic models accurately characterize particular testing conditions, ESSEM can improve the speech recognition performance under adverse conditions. In this work, we propose two maximum a posteriori (MAP) based algorithms to improve the online estimation part of the original ESSEM framework. We first develop MAP-based environment structure adaptation to refine the original environment structure. Next, we propose to utilize the MAP criterion to estimate the mapping function of ESSEM and enhance the environment modeling capability. For the MAP estimation, three types of priors are derived; they are the clustered prior (CP), the sequential prior (SP), and the hierarchical prior (HP) densities. Since each prior density is able to characterize specific acoustic knowledge, we further derive a combination mechanism to integrate the three priors. Based on the experimental results on the Aurora-2 task, we verify that using the MAP-based online mapping function estimation can enable ESSEM to achieve better performance than using the maximum-likelihood (ML) based counterpart. Moreover, by using an integration of the online environment structuring adaptation and mapping function estimation, the proposed MAP-based ESSEM framework is found to provide the best performance. Compared with our baseline results, MAP-based ESSEM achieves an average word error rate reduction of 15.53% (5.41 to 4.57%) under 50 testing conditions at a signal-to-noise ratio (SNR) of 0 to 20 dB over the three standardized testing sets. Index Terms—ensemble speaker and speaking environment modeling, noise robustness, ESSEM, MAP
I. INTRODUCTION VEN though the performance of automatic speech recognition (ASR) has been significantly improved over recent years, an issue that has continued to limit the applicability of ASR is the considerable performance degradation that occurs when the acoustic conditions of the testing utterances and acoustic models do not match. The acoustic mismatch is rather difficult to deal with because it typically comes from a complex combination of multiple distortion sources, including inter- and intra-speaker effects, additive noise, convolutive transmission, and channel distortions. Many approaches have been proposed to resolve this issue [1-5]. Among them, a class of approaches generates enhanced acoustic models for recognition. These
E
models have better capability of tolerating classification degradations caused by acoustic mismatches. These approaches are often referred to as model-based methods and can be roughly divided into two categories. The first category attempts to prepare acoustic models that are robust against environmental changes in the offline phase, whereas the second attempts to estimate new acoustic models that match the testing conditions in the online phase. To prepare robust acoustic models, using multi-condition training data is an effective approach. By directly using multi-condition training data, the trained acoustic models can provide a good coverage over various speaker and speaking environments [6, 7]. Meanwhile, a class of approaches has been proposed to utilize speaker, channel, or noise statistics from the training data to estimate a canonical acoustic model. Because the canonical acoustic model is independent from any specific speaker or noise condition, it can maintain satisfactory ASR performance under adverse conditions and can be suitably combined with a model adaptation process to further enhance recognition accuracy. Notable methods belonging to this class include speaker adaptive training (SAT) [8], joint adaptive training (JAT) [9] and noise adaptive training (NAT) [10, 11]. On the other hand, adopting discriminative training criteria is also an effective way to prepare robust acoustic models. By applying discriminative training algorithms to refine the maximum likelihood (ML)-trained acoustic models, recognition performance can be robust against adverse testing conditions [12-14]. Well-known discriminative training methods include minimum classification error (MCE) [12], minimum phone error (MPE) [15], maximum mutual information estimation (MMIE) [16], and soft margin estimation (SME) [17]. Approaches in the online estimation category are also known as acoustic model adaptation methods. A group of online estimation approaches designs a distortion model and applies the vector Taylor series (VTS) approximation to update the parameters in the acoustic models. With given or estimated noise and channel statistics, these approaches can adjust the acoustic models to match the testing condition and enhance recognition accuracy effectively. Well-known approaches of this group include VTS-based model adaptation [18], joint compensation of additive and convolutive distortions (JAC) [19, 20], JAC with unscented transform (JAC-UT) [21], and joint uncertainty decoding (JUD) [22]. Another group of online estimation approaches prepares an environment structure using the training data during the offline phase. Speech segments from the testing conditions are then used to estimate the acoustic difference of the training and testing conditions. Fi-
nally, a mapping function is calculated to construct a new set of acoustic models for the testing condition [2]. These approaches can be summarized into two categories based on the number of acoustic model sets that are used to form the environment structure [23]. The first category uses a single set of acoustic models to establish the environment structure. In this category, the mapping function is used to transform the original acoustic model set to a new set that matches the testing conditions. Effective approaches belonging to this category include linear and nonlinear stochastic matching [2, 24], maximum likelihood linear regression (MLLR) [25, 26], and maximum a posteriori linear regression (MAPLR) [27, 28]. More recently, a series of studies has been developed, in which speaker and background noise effects are separately characterized using specific transforms. Well-known methods include factorized adaptation [29] and acoustic factorisation algorithms [30, 31]. The second category of approaches uses multiple sets of acoustic models to prepare the environment structure. These approaches usually adopt a simpler mapping function than those in the first category and so require fewer adaptation data to calculate the mapping function. Well-known examples include eigenvoice [32], cluster adaptive training (CAT) [33], and ensemble speaker and speaking environment modeling (ESSEM) [34, 35]. For the eigenvoice method, an eigenspace is constructed by applying principal component analysis (PCA) [36] to the entire sets of mean parameters from multiple sets of acoustic models. Each set of acoustic models characterizes a particular training speaker. The available adaptation data are then used to estimate a set of weighting coefficients and to calculate a set of acoustic models for the testing speaker. For CAT, several sets of acoustic models are prepared during the offline phase. Each set of models is estimated using a cluster of training data with similar acoustic characteristics. A linear combination is computed, and the parameters of the cluster-based acoustic models are combined to find the target acoustic model for the testing condition. ESSEM prepares multiple set of acoustic models, each of which specifies a particular speaker and speaking environment. These acoustic models are structured by clustering similar environments into smaller groups during the offline process. Each group contains several sets of acoustic models with similar acoustic properties. During testing, a group of acoustic models is first selected and a mapping function is estimated to calculate a new set of acoustic models that matches the testing condition. Since the acoustic characteristics of the selected group of acoustic models are similar to the testing condition, a simple mapping function can be utilized to model the combined distortion. A variety of mapping functions, including best-first, linear combination (LC), linear combination with correction bias (LCB), and multiple cluster matching (MCM), have been proposed, and their effectiveness has been confirmed in previous studies [35, 37]. In this paper, we intend to enhance the rapid adaptation capability of ESSEM for robust speech recognition. For originally proposed ESSEM, the maximum likelihood (ML) criterion is used as the objective function to calculate the parameters in the mapping function. Although the original ML-based ESSEM (named ML-ESSEM hereafter) has been verified to be efficient for characterizing the testing conditions [34, 35], poor transformations may occur when the amount of adaptation utterances is limited and the corresponding transcription con-
tains erroneous information (especially in an unsupervised adaptation mode). To solve this problem, we proposed to use the MAP criterion for the ESSEM online process in a previous study [37]. This work further extends the developed MAP-based ESSEM in two directions by developing MAP-based environment structure adaptation (ESA) and mapping function estimation (MFE) algorithms. Moreover, three types of prior density are derived to facilitate the MAP estimation. They are clustered prior (CP), sequential prior (SP), and hierarchical prior (HP) densities. A combination mechanism for integrating the three prior densities was also developed. The proposed methods were evaluated using the Aurora-2 connected digit database [38, 39]. The experimental results verify that the MAP-based ESSEM (named MAP-ESSEM hereafter) outperforms ML-ESSEM in a per-utterance unsupervised adaptation mode. The rest of this paper is organized as follows. Section II reviews the ESSEM framework. Section III introduces the proposed MAP-ESSEM approach. Section IV reports and discusses our experimental results. Finally, Section V offers concluding remarks regarding our findings. II. ENSEMBLE SPEAKER AND SPEAKING ENVIRONMENT MODELING In this section, we review the offline and online procedures of the originally proposed ESSEM framework. In the offline phase, an environment structure that covers a wide range of acoustic conditions is prepared. In the online phase, a set of acoustic models that matches the testing condition is estimated. A. The Overall ESSEM Framework Similar to other ML-based model adaptation approaches, the goal of original ESSEM is to estimate a new set of acoustic models, ̅ , based on the ML criterion ̅
( |
)
(1)
where is adaptation data, and is the transcription to . Instead of using a direct estimation, ESSEM computes ̅ in a two-stage (offline and online) process. In the offline phase, ESSEM prepares speech data for a wide range of speaker and speaking conditions, including different speakers, noise types, SNR levels, and channel distortions. Assuming that the entire training set includes P distinct speaker and speaking environments, with these P subsets of training data, we can train P sets of hidden Markov models (HMMs), ; each set of HMMs characterizes a particular speaking and speaker environment. Using these P sets of HMMs, we form an environment structure, , ( ). In the online phase, original ESSEM computes a mapping ( ), to transform the environment structure, , function, into a transformed model, , by ( )
(2)
where is the parameter set in the mapping function. In pre( ) have been developed, vious studies, various forms of including best-first, LC, and LCB [34, 35]. From (2), the esti-
mation of ̅ in Eq. (1) has become the calculation of the op() timal parameters set, ̅, in ̅
( |
)
(3)
) where ( | ( | ( ) ) , representing the likelihood of the adaptation data given the transformed model. Equations (2) and (3) present the general concept of original ESSEM, and we have derived several algorithms to improve the offline and online phases of ESSEM to achieve better performances [34, 35]. With these algorithms, the optimal subset of is determined to compute the new acoustic model, ̅ in Eq. (1), and a tree structure is used to facilitate the estimation of parameter set, ̅ in Eq. (3). In the following contents, we will introduce the offline and online phases of the ESSEM framework in more detail.
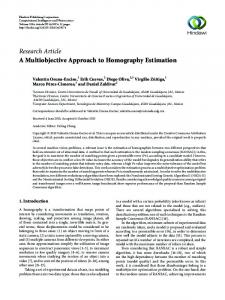
Figure 1 illustrates the overall framework combining the EC and EP algorithms. We first establish an EC tree to cluster the training environments into C clusters. Each EC node has an environment structure and an EP tree. Each EP tree is established based on the set of representative HMMs of its EC node. Accordingly, C EC structures and C EP trees are prepared. The advantage of using the EC tree is that it allows us to find a group of environments that are close to the testing condition. Therefore, the complex effect of multiple distortion sources can be simplified. On the other hand, the EP tree can be used to approximate the ideal mapping function (which might be in a complex and nonlinear form) into several simpler functions in a piece-wise approximation manner [42].
Root
1-st EP Tree
B. Offline Environment Structure Preparation In the original ESSEM framework, environment clustering (EC), environment partitioning (EP), and discriminative training algorithms have been developed to prepare the environment structure in the offline phase. This section briefly reviews these three algorithms.
Layer lc
1) Environment Clustering (EC) The EC algorithm clusters the entire set of training data into several subsets. Each subset characterizes particular local information of the ensemble environments. A hierarchical tree is generated to facilitate the EC process (named EC tree hereafter). The first EC structure (corresponding to the root node of the EC tree), , is formed using the original environment structure, , which includes the entire set of . For the following layers in the EC tree, each node includes a subset of . Accordingly, we obtain a set of C EC structures corresponding to the C nodes of the EC tree. In addition to preparing the C sets of EC structures, C sets of representative HMMs, , c = 1,2…C, are prepared. Each set of representative HMMs is trained on the entire set of training data from an EC node and used to represent that EC node.
Layer Lc
2) Environment Partitioning (EP) The objective of the EP algorithm is to partition the mean parameters in each EC structure into several groups. Each group consists of mean parameters representing similar acoustic properties. During the online phase, a same group of mean parameters shares a same mapping function and is transformed together to form a new acoustic model [34]. In this study, we also use a hierarchical tree to perform the EP process (named EP tree hereafter). Each EP tree is constructed based on the representative HMMs, and the construction procedure of an EP tree resembles that used in SMAP [40] and structural MAPLR (SMAPLR) [41]. The root node of the EP tree includes the entire set of mean parameters; in the following layers, mean parameters in the representative HMMs are partitioned into several groups. We built an EP tree for each EC node and thus prepare C sets of EP tree in total. For the c-th EC node, if the EP tree is constructed to comprise Q nodes, the mean parameters are thus clustered into Q groups.
c-th EP Tree
EC Tree
C-th EP Tree
Fig. 1. The environment clustering and partitioning framework. 3) Discriminative Training To increase the discriminative power within each and between each pair of HMM sets, we derived two discriminative training algorithms, namely intra-environment (intraEnv) and inter-environment (interEnv) [34]. We first apply the intraEnv training to enhance the discriminative power of the parameters in each set of HMMs. Then the interEnv training is performed to increase the separation between each pair of HMM sets. Notably, we also apply the discriminative training on the representative HMM sets before using these model sets to construct EP trees. C. Online Mapping Function Estimation During the online phase, original ESSEM performs the following three steps. Step 1) With the adaptation data, , a cluster selection (CS) process is performed by locating one representative HMM set from the C nodes in the EC tree by ( |
)
(4)
where is assumed to be the set of representative HMMs that best matches the testing condition. With the located , the corresponding environment structure, , and EP tree are also located. In the following discussions, we are assuming that includes V speaker and speaking environments, namely,
̃ ̃ ̃ . Because ly, is computed using that contains the cluster of HMM sets more relevant to the testing condition, the CS process resembles subset selection methods [43]. Step 2) With the EP process, the original structure, , is partitioned into Q sub-spaces, , q=1,2…Q. In the online phase, we estimate the parameters in the mapping function by ̅
( |
)
(5)
Notably, ̅ is estimated using the adaptation statistics corresponding to the Gaussian components in the q-th EP node. The use of an EP tree in the ESSEM approach resembles the use of a regression tree for the MLLR adaptation [44]. Therefore, ESSEM decides the total number of mapping function dynamically according to the amount of available adaptation data. If very limited amount of adaptation data is available, a single mapping function (corresponding to the mapping function associated with the root node) is calculated and applied to transform all of the mean parameters. When more adaptation statistics become available, the further the tree is descended and more specific mapping functions are computed. The advantage of using the EP tree is that each mapping function is shared by a group of mean parameters, allowing for adaptation of both observed and unobserved acoustic units. Step 3) With the estimated mapping function parameters, we can obtain a new set of acoustic models, ̅ , in Eq. (1). In this study, we present two types of mapping functions ( ) in Eq. (2), namely, linear combination (LC) and linear of combination with correction bias (LCB). For the LC mapping function, we prepare a matrix, ̃ ̃ ̃ for the m-th Gaussian component, where ̃ is the m-th mean vector for the v-th speaker and speaking environment in . We can formulate the model adaptation function as (6)
,
where is m-th mean vector in , represents the LC mapping function for the q-th EP node. More specifically, ( ) and in and in Eq. (6), respectively, correspond to Eq. (2). For the LC mapping function, the parameters in are weighting coefficients, i.e., , which correspond to in Eq. (5). Equation (6) can be re-written as ̃
̃
̃ .
(7)
Assuming that the q-th node in the EP tree includes mean vectors, we can derive an auxiliary function (
)
∑ ∑ ∑ ∑ )
( ) ( ) (
where t is the time index, T is the total number of feature frames, is the t-th feature vector, ( ) is the posterior probability of the t-th frame on the m-th Gaussian component, and is the covariance matrix for the m-th Gaussian component. We use a diagonal matrix for in this study. Here, the m-th Gaussian component is assumed to belong to the -th node in the EP tree. With the auxiliary function in Eq. (8), we can derive the optimization equation as
( |
) (8)
( )
̅
(
Next, by taking the derivative of (
and setting
)
( )
∑ ∑ (
)
) (
(9) ),
(
)
(10)
in Eq. (10), ̅ can be calculated by ̅
(11)
where ( )
∑ ∑
(12)
( )
∑ ∑
(13)
When using the LCB mapping function, we set the environment matrix to ̃ ̃ ̃ where is a D-by-D identity matrix, and , where is a D dimensional correction bias (D is the dimensionality of each feature vector). Notably, Gaussian components that belong to the -th node share a same mapping function, . Then the adapted mean, , using the LCB mapping function can be formulated as ̃ and the parameters in (11)–(13).
̃
̃
,
(14)
can be computed by following Eqs.
III. MAP-BASED ENSEMBLE SPEAKER AND SPEAKING ENVIRONMENT MODELING In this section, we introduce the MAP-based online algorithms for ESSEM and three types of prior densities. Similar to the procedure used in original ESSEM, we first locate space using the CS procedure in Eq. (4). Aside from original ESSEM, we incorporate a MAP-based environment structure adaptation (ESA) procedure to refine the parameters in the structure. Next, a MAP-based mapping function estimation (MFE) is performed to compute a new set of acoustic models. In what follows, the MAP-based ESA and MFE processes are explained in more detail.
A. MAP-based ESA The objective of ESA is to increase the coverage of the environment structure over the testing condition, especially for the conditions that are not seen in the training set. Similar concept has been used and proven effective in a previous study [45]. In ESSEM, with the structure, , located by the CS process using Eq. (4), the MAP-based ESA refines the parameters in using ̅
( |
) (
)
( |̃
̃
) (̃ )
(16)
)
∑ ∑
( )
∑
(
( |
) (21)
)
where is a factor that controls the weights of the prior density. In this study, we assume that the prior density for the m-th Gaussian at the q-th EP node has the form of (
)
{
(
)
(22)
(
)}
where ̅ is the ESA adapted acoustic model, v=1,2,…V. Since we focus on mean adaptation in the ESSEM framework, ESA only adapts mean parameters of the V sets of acoustic models. For the mean vector of the m-th Gaussian component in the v-th model, the adaptation is performed by ̅
(
(15)
where ̅ is the ESA adapted environment structure. In this ̃ , is adapted study, each model in , namely ̃ ̃ individually based on the MAP criterion [3] by ̅
For the LC mapping function, MAP-based MFE uses and ̃ ̃ ̃ and defines the auxiliary function, ( ) as
()
()
(
( )
)
(17)
where and are the hyper-parameters of the prior density. The prior density of is designed directly since the prior densities of individual and are relatively difficult to specify. The MAP-based optimization equation is formulated as ̅
(
)
(23)
where ( )
()
∑
∑ ( )(
( )( ( )
( )
)
) ()
( (
( )
( )
)
(18) ()
)
B. MAP-based MFE MAP-based MFE estimates the parameters in the mapping function by ( |
) (
)
(
(19)
where ( ) and ( ) are the ii-th diagonal component of and i-th component of , respectively; is a controlling factor; () ̅ ( ) , ( ) , and are the i-th component of ̅ , , and ; ( ) ( ) and are the ii-th diagonal element of matrices, and ; and are hyper-parameters in the prior density. ̃ , where In this study, we simply set ̃ , and ̃ ̃ and , respectively, denote the mean vector and covariance matrix of the m-th Gaussian component in the v-th model, and is a scaling factor. From Eqs. (17)-(19), it is noted that the adapted mean, ̅ , is a weighted combination of the original mean, ̃ , and the observation vectors, ( ). After performing MAP-based ESA, we obtain the adapted ̅ ̅ ̅ . environment structure, ̅
̅
By integrating Eqs. (21) and (22) into Eq. (23) and taking derivative of ( ), we have
(20)
)
∑ ∑
( )
(
∑
)
(
Then, we can compute ̅ by setting ̅
) (
(24)
)
=0 and obtain (25)
where ∑ ∑
( )
∑
(26)
∑ ∑
( )
∑
(27)
The same derivations of Eqs. (25)-(27) can also be applied to compute the LCB mapping function by setting and ̃ ̃ ̃ .
C. Prior Information Specification In this section, we are presenting three types of prior densities, namely, clustered prior (CP), sequential prior (SP), hierarchical prior (HP) densities. These prior densities are used for MAP-based MFE in Eqs. (25)–(27). Figure 2 shows the c-th EP tree, corresponding to the c-th EC node in Fig. 1. For this EP tree, represents the entire set of mean vectors, is the hyper-parameter set for ; is the q-th subset of the entire set of mean vectors, and is the hyper-parameter set for . Root
{M0;Z0}
0 1
{M3;Z3}
3
2
utterances for modeling the current testing environment. In a previous study, a MAP estimation using the SP density showed satisfactory performance [47]. In this study, we designed an environment dependent (ED) SP using the local information provided by the EC algorithm. Because the CS procedure determines the best EP tree for each utterance, sequential Bayesian updating is only applied to the located EP tree. For the c-th EC node, we performed the following three steps. ( )
Step 1) At the beginning stage, is computed based on the ML criterion by following Eqs. (11)-(13). For the m-th Gaussian component that belongs to the q-th node, its hy( ) ( ) per-parameter is then set . ( ) Step 2) For the u-th utterance,
( )
is calculated by following (
Layer lp
{Mβ;Zβ}
β q-2
q
q-1
{Mq;Zq}
Layer Lp
In this study, we online update ( ) ( )
EP Tree
1) Clustered Prior (CP) We prepare the CP density for every EP node in the environment structuring framework (Fig. 1). We assume that the c-th node in the EC tree includes training data from V different environments. For the m-th mean vector belonging to the q-th node in the EP tree in Fig. 2, its hyper-parameter for the CP density is specified by ∑
( )
(
( ) ( )
), where
( ) ( )
and use a fixed
is a predefined scaling
factor.
Fig. 2. c-th environment partitioning (EP) tree.
( )
)
Eqs. (25)-(27) with hyper-parameter , which is ( ) specified from the previous utterances. ( ) Step 3) The calculated is used to update the hyper-parameters for the next utterances. For the m-th Gaussian component that belongs to the q-th node, its hyper-parameter is ( ) ( ) updated with . ( )
(28)
( )
where is computed by Eq. (9) using the training statistics for the q-th EP node of the v-th environment in the c-th EC node. In this paper, we focus on the design of mean parameters in Eq. (22) and simply set , where is a scaling ( ) factor. Using the same procedure, we can specify the CP densities for every node in all of the C EP trees. Because each CP density is associated with a certain group of mean parameters (as shown in Eq. (28)) for a particular cluster of environments, the CP density provides local information of the ensemble environments. Using the online CS process, we can first select an EC node and its EP tree. Then, a node in the EP tree is selected according to the amount of adaptation statistics, and the CP density for that node is used for the MAP estimation. 2) Sequential Prior (SP) The calculation of the SP density is based on the sequential Bayesian learning [46]. Using the SP density, the MAP-based estimation incorporates the information from previous testing
3) Hierarchical Prior (HP) The estimation of HP densities for MAP-ESSEM resembles that performed in SMAP [40] and SMAPLR [41]. As mentioned above, we prepare C EP trees in the environment structuring framework, and each EP tree characterizes particular local information of the ensemble acoustic conditions. Using the CS procedure, we locate the EP tree that best matches the testing condition and specify the HP density based on that located EP tree. When using the HP density for the MAP-based estimation, we perform the following steps. Step 1) For the root node of the EP tree, we perform the following two procedures. (a) The mapping function corresponding to the root node, , is calculated based on the ML criterion by following Eqs. (11)-(13). (b) The calculated is applied to update the mean parameters in the root node and used to compute the hyper-parameters in the child nodes of the root node. Step 2) For the q-th node with its parent node β (as in Fig. 2), we perform the following three procedures: (a) For the m-th Gaussian component that belongs to the q-th node, its hyper-parameter set is specified as , where is cal( ) ( ) culated from the β-th node, and is a scaling factor. (b) is calculated by following Eqs. (25)–(27) with the hyper-parameters in the q-th node ( in Fig. 2). (c) is applied to update the mean parameters in the q-th node and used to calculate the hyper-parameters in the child nodes of the q-th node. Step 3) Repeat Step 2 until to the leaf nodes of the EP tree.
The advantage of HP is that it is able to dynamically propagate useful information along the EP tree. 4) Combination of the Three Prior Information Although each of the above three priors can effectively characterize specific prior knowledge, some limitations are observed. First, when testing utterances are very different from the training condition, CP cannot provide suitable priors for the MAP-based estimation. In this case, online updating prior information from SP and HP can provide complementary knowledge. Next for SP, no previous knowledge is available at the beginning stage. In this case, we can use the knowledge of CP and HP to prepare suitable priors. Finally, when the available adaptation data is limited, HP may have limited capability. We may need to incorporate SP and CP in this condition. Therefore, we propose to integrate the CP, SP, and HP knowledge using a combination mechanism ( ). Then, we have (
)
(29)
where is the combined hyper-parameter. In this study, we simply use a linear combination function to combine the hyper-parameters of the three prior densities (30) where , , and are the weighting coefficients. Similar to in the HP density, we first locate one EP tree, and then iteratively estimate and propagate the . Finally, the estimation and propagation stop at the leaf nodes of the EP tree. Similar to the SP and HP densities, we only update online and use a fixed ( ) to form a prior density in Eq. (22), where is a scaling factor. Since the information from CP, SP, and HP has been combined, incorporates multiple prior knowledge sources.
IV. EXPERIMENTAL SETUP AND RESULTS The experimental setup and evaluation results are presented in this section. First, we show the performances of the baseline and two well-known model adaptation approaches: MLLR [25, 26] and SMAPLR [41]. Next, we present the performance of ML-ESSEM. Finally, we report the recognition results achieved by the proposed MAP-ESSEM. A. Experimental Setup In this section, the Aurora-2 task, acoustic features, and model topologies used in the experiments are first introduced. Then the offline and online processes of ESSEM are described. 1) Aurora-2 Task, Feature, and Model Topologies We conducted speech recognition experiments on the Aurora-2 task [38, 39], which is a standardized database for connected digit recognition under noisy conditions. The original speech utterances in Aurora-2 were acquired from the TIDIGITs database [48] and artificially contaminated with different noise types at particular SNR levels to generate noisy speech utter-
ances. There are three test sets in Aurora-2. Test Sets A and B were distorted by eight additive noise types: for Set A, the noise types were subway, babble, car, and exhibition; for Set B, the noise types were restaurant, street, airport, and train station; for Set C, speech utterances were distorted by additive noise and channel effects (subway and street noises together with an MIRS channel mismatch). Each noise instance was added to the clean speech at six SNR levels (including -5, 0, 5, 10, 15, and 20 dB SNRs). Therefore, along with the clean condition, the Aurora-2 test set consisted of 70 different test conditions. Each condition contained 1,001 utterances, and the gender distribution of the test speakers was roughly even. The Aurora-2 corpus provided two training sets: clean- and multi-condition sets. The clean-condition training set included 8,440 clean speech utterances. The multi-condition training set included the same 8,440 utterances, with artificially affected by the same four types of additive noise as those in test Set A, at different SNRs: 5 dB, 10 dB, 15 dB, 20 dB, and clean condition. In addition to the training and testing sets, we used the clean utterances from the multi-condition training set (1,688 utterances in total) to prepare a development set. With these clean utterances, we artificially generated noisy speech utterances by using the same four types of noise in test Set A at 5 dB, 10 dB, 15 dB, and 20 dB SNR levels. These four noise sources were obtained from the Aurora-2 database [38, 39] and were added to the clean speech using the FaNT tool [49]. This development set was only used to tune parameters but not involved in the offline preparation and online estimation processes of ESSEM. The multi-condition training set in Aurora-2 was used to train HMMs and build the environment structure. Because gender labels were provided, we first divided the training set into two subsets based on speaker’s gender. The speech utterances for both genders were further divided into 17 different speaking environments (four noise types at four SNR levels, along with the clean condition). Thus, we classified the training set into 34 subsets, each representing a specific speaker and speaking condition. To establish the environment structure, we first used the entire set of multi-condition training data to prepare an environment-independent HMM set (named EI-HMM hereafter). A MAP adaptation criterion [3, 28] was later performed on EI-HMM using the two gender-dependent training subsets to generate two sets of gender-dependent HMMs (named GD-HMM sets hereafter). Finally, each GD-HMM set was further adapted by MAP [3, 28] using the 17 training subsets to generate 17 environment-specific HMM sets (named ES-HMM sets hereafter). Accordingly, we prepared 34 ES-HMM sets, which were then used to construct the environment structure. Notably, we only applied MAP to update the mean parameters, and thus these 34 HMM sets shared the same covariance parameters. Since the multi-condition training set comprised noisy speech data contaminated by the four noise types in test Set A, the prepared environment structure provided good coverage over test speech data in Set A but a relatively poor coverage over test speech data in Sets B and C. For each approach, we evaluated the performance using 70 different testing conditions, corresponding to ten noise types, at six SNR levels, along with the clean condition, from the Aurora-2 test set. A modified ETSI advanced front-end (AFE) was used to extract the feature vectors [50, 51], and a complex back-end topology [38, 51] was adopted to train the 34 sets of HMMs.
The overall implementation procedure of ESSEM is illustrated in Fig. 3, which is divided into eight steps. We will introduce these eights steps in the next two sub-sections. Multiple Acoustic Models, Ω Λ1
Λ2
ΛP ① Discriminative Training
② EC
③ EP Offline Preparation Target Model
Test Speech Data Y
ESSEM Online
⑤ CS ⑥ ESA ⑦ MFE
④ 1st Decode
Online Estimation
ΛY Recognition Results ⑧ 2nd Decode
W*
Fig. 3. Overall procedure of the MAP-ESSEM algorithm. 2) Offline Preparation With the prepared 34 HMM sets, we first applied discrimina1 in Fig. 3) to increase the discriminative power tive training (○ within each and between each pair of HMM sets [34]. In this study, we performed intraEnv and interEnv training using SME [17] and MCE algorithms [12], respectively. Next, we per2 in Fig. 3) and EP (○ 3 in Fig. 3) algorithms to formed the EC (○ construct the environment structure. We constructed an EC tree of a two-layered binary structure to cluster the 34 environments into seven nodes (one root, two intermediate, and four leaf nodes). The first layer divided the 34 environments into two nodes of both genders. For the second layer, each node in the first layer was roughly classified by high/low SNR levels. To perform the second layer classification, we collected the mean parameters in each of the 17 HMM sets (corresponding to the 17 environments) and concatenated them into 17 super-vectors. Then the k-means algorithm [52] was applied to these 17 super-vectors to cluster them into two groups. A preliminary experiment indicated that if each group had too few HMM sets, the overall performance can deteriorate. Thus, some environments that were located at the periphery were shared across different nodes in the second layer. Finally, each cluster comprised 12 to 14 different environments in the second layer. Next, the training data set that belongs to each EC node was used to prepare a representative HMM set. The representative HMM sets for the root node is EI-HMM and for the two nodes in the first layers are the two sets of GD-HMMs. The four representative HMM sets (corresponding to two genders and high/low SNR conditions) in the second layer were estimated using the training utterances with the given gender and hypothesized high/low SNR labels. The seven representative HMMs corresponding to these seven nodes were further refined by the intraEnv and interEnv training. After performing the EC procedure, we built a two-layer EP tree for each EC node based on the representative HMM set for that node. Each EP tree consisted of one root, three intermediate, and six leaf nodes. A top-down k-means clustering algorithm with the Mahalanobis distance [52] was used to cluster the Gaussian components into several EP nodes in the same layer. Finally, an EC tree with seven nodes was
built, and for each node in the EC tree, an EP tree with ten nodes was prepared. 3) Online Estimation 5 in Fig. 3) to locate a In the online phase, we first applied CS (○ node (out of seven nodes) from the EC tree based on Eq. (4). An EC structure and an EP tree were also located. Then, we performed ESA to adjust parameters of the determined EC struc6 in Fig. 3). Next, we determined the number of mapping ture (○ functions for MFE based on the accumulated statistics, ∑ ∑ ( ), for the q-th node in the EP tree. If was larger than a predefined threshold, we used the mapping function, , to adapt mean parameters, , based on Eq. (6). If was smaller than the threshold, we checked the parent node of the q-th node to determine if it contained sufficient accumulated statistics. This process repeated until a node with sufficient statistics was located. Finally, MAP-based MFE 7 in Fig. 3). was performed to compute a new acoustic model (○ In this study, we only updated mean parameters in HMM sets, and covariance parameters remained unchanged. The evaluation was performed in a per-utterance unsupervised adaptation mode. The following three steps were conducted for each testing utterance. Step 1. The test utterance was decoded by the representative 4 in Fig. 3); the CS process (○ 5 in Fig. 3) was HMM sets (○ applied to get the best HMM set; the results decoded by the best HMM set were used as transcription reference. Step 2. ESSEM (ESA and MFE) was performed to estimate a new set of HMMs using the testing speech data and the decoded 6 and ○ 7 in Fig. 3). transcription reference (○ Step 3. The same test utterance was recognized by the new 8 in Fig. 3). HMM set estimated by ESSEM (○ For the transcription reference, instead of using the 1-best decoded reference with the highest likelihood score, we used an N-best list to enhance the ESSEM performance. By incorporating the N-best list, Eq. (5) becomes ̅
∑
( |
)
(31)
Similarly, Eqs. (15) and (20), respectively, become ̅
( |
∑
) (
)
(32)
and ̅
∑
( |
) (
)
(33)
where and are the decoded transcription and weight for the n-th hypothesis. From our previous study [53], we adopted the following equation to dynamically determine : )
( ∑
(
)
(34)
where is the log-likelihood of the h-th hypothesis, and is a parameter that determines the confidence of these hypotheses. Note that when we set , equal weighting is applied to the N-best hypotheses; by setting , only the 1-best hypothesis is used in Eqs. (31)-(33). In our experiments, we set , which gave the best performance on the development set. B. Experimental Results The average word error rate (WER) was the main metric used to evaluate the performance. For a detailed comparison among different approaches, we present the average WER results of four test sets and seven SNR levels. Both Sets A and B results represent the average WERs of 20 testing conditions (four different noise types for each at 0, 5, 10, 15, and 20 dB SNRs); Set C result is the average WER over ten testing conditions (two different noise types at 0, 5, 10, 15, and 20 dB SNRs); in addition to the three sets, we report an additional set, Avg, which is made up of the average results of 50 testing conditions (ten different noise types at 0, 5, 10, 15, and 20 dB SNRs). For the seven SNR levels (-5, 0, 5, 10, 15, and 20 dB SNRs, and clean condition), each result indicates the average WER across ten testing conditions. In addition to WER, we used a statistical hypothesis test, the dependent t-test, to verify the significance of performance improvements [54, 55]. We compare two methods by testing the ten matched-pair WER sequences for each SNR level because we are more interested in an analysis of the achievable performance under particular SNR levels. For the t-test, we assumed that for H0, “method-II is not better than method-I,” and for H1, “method-II is better than method-I.” We used the p-values to show the t-test results [54, 55]. Small p-values imply consistent improvements of method-II over method-I across the ten sets of recognition results. Our experimental results are organized as follows. First, we present the results of the baseline and two well-known model adaptation methods, MLLR and SMAPLR. Meanwhile, the results of ML-ESSEM are reported. Subsequently, ESSEM with MAP-based MFE and MAP-based ESA+MFE are presented. Finally the results of a set of oracle experiments are shown in the last part of this section. As mentioned earlier, the recognition tests were conducted in a per-utterance unsupervised model adaptation manner except the baseline. 1) Baseline, MLLR, SMAPLR, and ML-ESSEM In Table I, the left three columns show the results of the baseline (denoted as Baseline), MLLR, and SMAPLR approaches at different SNR conditions in the Aurora-2 test set. To obtain the 1 ,○ 2 , and ○ 3 in results of Baseline, the offline preparation (○ 4 5 in Fig. 3) was also conducted. Then, we performed ○ and ○ Fig. 3 online to test recognition and select the best acoustic model. The recognition results obtained by the selected acoustic model were used as the Baseline results. For the MLLR and SMAPLR approaches, the offline preparation, decoding and CS 1 ,○ 2 ,○ 3 ,○ 4 , and ○ 5 in Fig. 3) were performed, while the (○ recognized results were used as the transcription reference. 6 and ○ 7 in Fig. Next, instead of performing ESA and MFE (○ 3), the selected acoustic model was adapted to a new one by performing MLLR and SMAPLR. Finally the second stage decoding in Fig. 3 was performed to obtain the recognition results in Table I.
In addition to Baseline, MLLR and SMAPLR, Table I also presents the recognition results of ML-ESSEM using the LC and LCB mapping functions. The corresponding results are listed as ML-ESSEM (LC) and ML-ESSEM (LCB), respectively. For these two sets of ESSEM results, the steps shown in Fig. 3 were carried out, while MFE was conducted by the ML criterion, and no ESA was performed. For a fair comparison, 4 and ○ 8 in Fig. 3) were the first and second stage decoding (○ the same for MLLR, SMAPLR, ML-ESSEM (LC), and ML-ESSEM (LCB) in Table I. Moreover, both MLLR and SMAPLR only adapted the mean parameters in HMMs and left the covariance parameters unchanged. As mentioned earlier, the Avg results in Table I were the average WERs over 50 different conditions (ten different noise types at 0, 5, 10, 15, and 20 dB SNR levels). TABLE I WER (%) OF BASELINE, MLLR, SMAPLR, AND ML-ESSEM USING LC AND LCB MAPPING FUNCTIONS FOR EACH SNR Test Set
Baseline
MLLR
SMAPLR
ML-ESSEM (LC)
ML-ESSEM (LCB)
Clean 20 15 10 5 0 -5 Avg
0.34 0.55 0.88 2.05 5.55 18.01 54.62 5.41
0.31 0.45 0.73 1.73 4.73 16.96 52.62 4.92
0.29 0.44 0.72 1.73 4.71 16.56 51.96 4.83
0.29 0.45 0.69 1.70 4.80 16.43 51.79 4.81
0.27 0.45 0.67 1.68 4.59 15.92 49.98 4.66
From Table I, we notice that both ML-ESSEM (LC) and ML-ESSEM (LCB) outperform Baseline, MLLR, and SMAPLR in Avg while LCB provides clearer performance improvements. The results show that by using an environment structure, which includes diverse local information of the acoustic space, ESSEM can model particular testing conditions more precisely than MLLR and SMAPLR using simple LC and LCB mapping functions. In the following two sub-sections, we present the results of the proposed MAP-ESSEM. Notably, from Eqs. (25)-(27) and Eqs. (11)-(13), we can see that MAP-based MFE uses similar online computation as that of original ESSEM, while MAP-based ESA requires much more computation. Thus, we first show the results of MAP-based MFE alone (without performing MAP-based ESA) to facilitate a direct comparison of MAP-ESSEM and ML-ESSEM with a same level online computational cost. Next, the performance of ESSEM using MAP-based ESA and MAP-based MFE will be presented as for the complete MAP-ESSEM framework. 2) ESSEM with MAP-based MFE This section demonstrates the recognition results of ESSEM with MAP-based MFE (denoted as MAP-MFE hereafter) using the LC and LCB mapping functions. For the combination mechanism in Eq. (30), due to the unavailable SP knowledge at the beginning stage, we set { ; ; } for the first few testing utterances. A pre-defined threshold was applied to determine if the adaptation statistics became sufficient from the previous testing utterances. When the
TABLE II WER (%) OF MAP-MFE USING LC AND LCB MAPPING FUNCTIONS FOR EACH SNR Test Set Clean 20 15 10 5 0 -5 Avg
MAP-MFE (LC) 0.29 0.45 0.69 1.69 4.75 16.24 50.48 4.76
MAP-MFE (LCB) 0.27 0.43 0.67 1.66 4.56 15.71 48.57 4.60
Figure 4 illustrates the performances of ML-ESSEM and MAP-MFE using the LC and LCB mapping functions over the A and ○ C indicate the ML-ESSEM four test sets. In Fig. 4, ○ using the LC and LCB mapping functions, corresponding to the B and ○ D indicate the two results in Table I. Meanwhile, ○ MAP-MFE using the LC and LCB mapping functions, respectively, corresponding to the two results in Table II. C and ○ D achieve better From Fig. 4, we first observe that ○ A and ○ B , especially for Set C. The results performance than ○ show that when using the same optimization criterion (ML or MAP), LCB provides better performance than LC, suggesting that using a correction bias is effective for handling the addiB and ○ D contional channel distortion. Next, we notice that ○ A C sistently outperform ○ and ○, respectively, across Sets A, B, C, and Avg. The results demonstrate that when using the same mapping function (LC or LCB), MAP provides better performance than ML, again confirming that MAP-based MFE has better capability to avoid over-fitting than ML-based MFE.
5.7 5.7
A
B
WER (%)
5.4 5.4
C
5.1 5.1
D A B
4.8 4.8
A C D
B C D
A 4.5 4.5
B C D
4.2 4.2
1 Set A
2 Set B
Set3 C
4 Avg
LC function: A ML, B MAP ; LCB function: C ML, D MAP
Fig. 4. WER (%) of ESSEM using LC and LCB mapping A and ○ C ) and MAP (○ B and functions calculated by the ML (○ D ) criteria over the four test sets in Aurora-2. ○ 3) ESSEM with MAP-based ESA+MFE In this section, we first intend to compare the performances of MFE based on different learning criteria (ML and MAP) using the same environment structure. In Fig. 5, we list the results of ML- and MAP-based MFE both without MAP-based ESA as A and ○ B (the same in Fig. 4) and the results of ML- and ○ E and ○ F , MAP-based MFE both with MAP-based ESA as ○ respectively. The LC mapping function was used to obtain this set of results. 5.7 5.7
A
B E F
5.4
5.4
WER (%)
amount of statistics became larger than the threshold, the sec⁄ ; ⁄ ; ond stage started and set { ⁄ } to combine the three priors. The threshold was set so that the second stage started roughly after five testing utterances. Additionally, when incorporating CP, SP, and HP for the MAP estimation, we first applied the CS process to determine the most suitable node in the EC tree for each test utterance. Thus the most suitable prior information was used and accumulated. 8 in Fig. 3) was completed, After the second state decoding (○ the parameters were kept and used to prepare SP for the following test utterances. From our experiments, we observe that the use of SP for MAP-ESSEM was not affected much by the order of utterances. This may be owing to that the number of testing utterances was large in this particular task, and the use of SP started only when sufficient statistics from previous utterances became available. Notably, we simply used equal weights for the prior densities in this study. It is clear that the parameters of the combination mechanism in Eq. (30) can be optimized according to each particular task. Table II demonstrates the performances of ESSEM with MAP-MFE using the LC and LCB mapping functions as MAP-MFE (LC) and MAP-MFE (LCB), respectively. From Tables I and II, it is apparent that for both LC and LCB, MAP-MFE outperforms ML-ESSEM in lower SNR conditions (-5, 0, and 5 dB SNRs). The results confirm the superior adaptation capability of MAP-based estimation in more serious training-and-testing mismatched conditions.
5.1 5.1
A
A B E
4.8 4.8
B E F
F A 4.5 4.5
4.2 4.2
B E
1 Set A
F
2 Set B
3 Set C
4 Avg
Without ESA: A ML, B MAP ; With ESA: E ML, F MAP
Fig. 5. WER (%) of ESSEM without and with MAP-based ESA, A and ○ E ) and MAP-based MFE (○ B using ML-based MFE (○ F ), over the four test sets in Aurora-2. and ○ B and ○ F outperform ○ A and From Fig. 5, it is clear that ○ E , respectively. The results again confirm that MAP-based ○ MFE provides better modeling capability than ML-based MFE F when the same environment structure is used. Moreover, ○ performs the best among the four approaches in Fig. 5, showing that the integration of MAP-based ESA and MFE can achieve better performance than the individual approaches.
Next, we analyze the MAP-MFE performances using B and ○ F are the results different mapping functions. In Fig. 6, ○ D and ○ G of the LC mapping function (the same as in Fig. 5); ○ B and ○ D, are the results of the LCB mapping function. For ○ F and ○ G MAP-based ESA was not performed, while for ○ B,○ F , MAP-based ESA was performed before MFE. For all of ○ D , and ○ G , the mapping functions are estimated by the MAP ○ criterion. 5.7 5.7
B
WER (%)
5.4 5.4
F
to 4.57%) WER reduction comparing to the baseline result (5.41% WER). TABLE III WER (%) AND P-VALUES OF ML-ESSEM AND THE MAP-ESSEM FOR EACH SNR Test Set Clean 20 15 10 5 0 -5 Avg
ML-ESSEM 0.27 0.45 0.67 1.68 4.59 15.92 49.98 4.66
MAP-ESSEM 0.26 0.43 0.64 1.63 4.52 15.63 47.79 4.57
p-value 0.271 0.146 0.046 0.042 0.079 0.013 0.035
5.1 5.1
D 4.8 4.8
G B
B
F
F D G
D G
4.5 4.5
B
F D
4.2 4.2
1 Set A
G
2 Set B
3 Set C
4 Avg
Without ESA: B LC, D LCB ; With ESA: F LC, G LCB
Fig. 6. WER (%) of ESSEM without and with MAP-based ESA, B and ○ F ) and LCB (○ D and ○ G ) mapping funcusing the LC (○ tions for MAP-based MFE over the four test sets in Aurora-2. From Fig. 6, we can observe that ESSEM with ESA outperforms that without ESA for both LC and LCB in the four test sets. Furthermore, clearer improvements are achieved in Sets B and C when using the LC mapping function. Since the environment structure contains noise statistics from test Set A, the results verify the effectiveness of using MAP-based ESA to refine the structure for unseen noisy conditions. In addition, LCB gives less performance improvements than LC in Fig. 6. Because LCB already has better adaptation capability, it is reasonable that the additional gain is less than LC when integrated with MAP-based ESA. In the following discussion, ESSEM with both MAP-based ESA and MFE are denoted as MAP-ESSEM. Meanwhile, since LCB achieves better performance than LC in all of the above experiments, we only present the results of ESSEM using the LCB mapping function. C in Table III lists the detailed WERs of ML-ESSEM (○ G in Fig. 6) for each specific SNR Fig. 4) and MAP-ESSEM (○ condition. The t-test is performed to compare ML-ESSEM and MAP-ESSEM, and the p-values are also listed in Table III. From Table III, we find that MAP-ESSEM clearly outperforms ML-ESSEM under all SNR conditions. Especially at SNR = -5, 0, 10 and 15 dB, the p-values are smaller than a significance level of 0.05, and at SNR=5 dB, the p-value is smaller than a significance level of 0.1. The results indicate that consistent performance improvements were achieved by MAP-ESSEM over ML-ESSEM. Finally, comparing the results of Tables I, II, and III, we observe that MAP-ESSEM gives the best performance in our Aurora-2 experiment and provides a 15.53% (5.41
4) Oracle Experiments Since this study focuses on the MAP-based estimation for unsupervised self-adaptation, it is worth investigating if additional prior knowledge can lead to performance improvements. Accordingly, we designed two sets of oracle experiments. For the first oracle experiment (named Oracle-1 hereafter), we assumed that the gender information of every testing utterance was given. For the second oracle experiment (named Oracle-2 hereafter), we assumed that gender, noise type, and SNR level information were given. For Oracle-1, since the correct gender information was known, the CS process was conducted only to select one node out of the four nodes in the second layer of the EC tree. With the selected node, we directly used its representative HMM set to test recognition without performing model adaptation. For Oracle-2, because the multi-condition training set provided the same speech data as that in test Set A, we can use the HMM set (out of 34 ES-HMMs) that exactly matches each testing utterance’s gender, noise type, and SNR level. The matched HMM set was used to test recognition without performing model adaptation. Moreover, we list two additional sets of results in Fig. 7: the first is MAP-ESSEM as presented in Fig. 6 and Table III; the second is MAP-ESSEM with given gender information (denoted as MAP-ESEM (O) hereafter), which corresponds to a combination of Oracle-1 and MAP-ESSEM. Figure 7 illustrates the results of MAP-ESSEM G and ○ H , and the and MAP-ESSEM (O), respectively, as ○ I O1 O2 ), at 5 results of Baseline (○), Oracle-1 (○), and Oracle-2 (○ dB, 10 dB, 15 dB, 20 dB, and clean conditions in Set A. The average results of these five SNR conditions are also listed as Overall in Fig. 7. From Fig. 7, we observe that Oracle-1 outperforms Baseline in most conditions, confirming the effectiveness of the additional gender information. Meanwhile, Oracle-2 provides better performance than Oracle-1 in most conditions, showing the effectiveness of additional noise type and SNR information. Both MAP-ESSEM and MAP-ESSEM (O) yield better performance than Oracle-2. Thus, we concluded that ESSEM can achieve better performance than using an acoustic model of matched gender, noise type, and SNR level for recognizing the test utterance. Finally, we notice that MAP-ESSEM (O) provides lower WERs than MAP-ESSEM, suggesting that if additional gender information is available, MAP-ESSEM can achieve even better performance.
0.36
V. CONCLUSION
0.70
Clean
20 dB I
0.29
I
0.50
O1
O1
O2 G
O2 G
H
0.22
H
0.30 2.20
1.00
10 dB
15 dB I
0.70
I O1
O2
1.60 G
O1
H
O2 G
0.40
H
1.00 2.00
5.50
5 dB I
O1
4.60
Overall I
O2
1.50
O1
O2 G
G
H
3.70
H
1.00
I , Oracle-1 (○ O1 ), Oracle-2 (○ O2 ), Fig. 7. WER (%) of Baseline ○ G ), and MAP-ESSEM with Oracle-1 (○ H ), for MAP-ESSEM (○ each SNR level in Set A in Aurora-2.
We further list the detailed results of Oracle-1 and MAP-ESSEM (O) in Table IV at specific SNR levels and Avg. Notably, since Oracle-2 requires correct noise type and SNR labels, we could not obtain Oracle-2 results of Sets B and C. Thus, the Oracle-2 results are not presented. From the results in Tables I and IV, we can again notice that Oracle-1 outperforms Baseline in most conditions, while the improvement becomes marginal in Avg. Since the performance difference is caused by the oracle gender selection used in Oracle-1 and the CS process used in Baseline, the results suggest that using the HMM set obtained by the CS process can already provide comparable performance to that by the correct gender labels when no follow-up adaptation process is conducted. In contrast by comparing Tables III and IV, we notice that MAP-ESSEM (O1) outperforms MAP-ESSEM notably in most conditions (especially for -5 dB and 0 dB SNR levels). Since using correct gender labels for the test utterances can help to specify more accurate prior information, the performance improvements from MAP-ESSEM to MAP-ESSEM (O1) verify the effectiveness of using more suitable priors. Moreover, the results also suggest that the performance of MAP-ESSEM can be further improved when additional knowledge is available. TABLE IV WER (%) OF ORACLE-1 AND MAP-ESSEM (O1) FOR EACH SNR Test Set Clean 20 15 10 5 0 -5 Avg
Oracle-1 0.33 0.54 0.85 2.00 5.51 18.08 53.13 5.40
MAP-ESSEM (O1) 0.26 0.42 0.63 1.60 4.50 15.35 45.06 4.50
In this paper, we proposed MAP-based online environment structure adaptation (ESA) and mapping function estimation (MFE) algorithms to enhance the original ESSEM framework. For the MAP estimation, we developed CP, SP, and HP densities, which characterized the training data, the previous testing utterances, and the current testing utterance with the prepared tree structure, respectively. We further designed a combination mechanism to integrate these three priors to form a better prior density. MAP-ESSEM was tested using two forms of mapping functions, linear combination (LC) and linear combination with correction bias (LCB). From the experimental results, we observe that for both LC and LCB mapping functions, MAP-ESSEM achieved better performance than ML-ESSEM. By integrating MAP-based online ESA and MFE, the best performance reveals as 4.57% WER over an average of 50 testing conditions for the Aurora-2 task. The result also corresponds to a 15.53% (5.41 to 4.57%) WER reduction over the baseline result (5.41% WER). Finally, a set of oracle experiments was conducted, where each testing utterance’s gender information was provided. The experimental results demonstrated that the performance of MAP-ESSEM can be further enhanced when additional information is provided, confirming the effectiveness of the prior knowledge for the MAP-based estimation. In this study, we performed ESA in a per-utterance adaptation mode, and the environment structure was adapted to match only the current testing utterance. We believe that ESA can provide even clearer improvements under a batch and sequentially updating mode. Meanwhile, a transformation-based model adaptation approach can be used to perform ESA. Furthermore, we will collect training data from more sets of noise and SNR combination to investigate if the performance of ESSEM can be further enhanced by expanding the coverage of the original environment structure to more noisy conditions. REFERENCES [1] A. Acero, Acoustical and Environmental Robustness in Automatic Speech Recognition, Ph.D. thesis, Carnegie Mellon Univ., 1990. [2] A. Sankar and C.-H. Lee, “A maximum-likelihood approach to stochastic matching for robust speech recognition,” IEEE Trans. Speech Audio Processing, vol. 4, pp. 190–202, 1996. [3] J. Gauvian and C.-H. Lee, “Maximum a posteriori estimation for multivariate Gaussian mixture observations of Markov chains,” IEEE Trans. on Speech and Audio Processing, vol. 2, pp. 291–298, 1994. [4] Y. Gong, “Speech recognition in noisy environments: A survey,” Speech Communication, vol. 16, pp. 261–291, 1995. [5] L. Deng and X. Huang, “Challenges in adopting speech recognition,” Communications of the ACM, vol. 47, 69–75, 2004. [6] R. P. Lippmann, E. A. Martin, and D. B. Paul, “Multi-style training for robust isolated-word speech recognition,” in Proc. ICASSP, pp. 705–708, 1987. [7] X. Huang, A. Acero, and H.-W. Hon, Spoken Language Processing: A Guide to Theory, Algorithm and System Development, Prentice Hall, 2001. [8] T. Anastasakos, J. McDonough, R. Schwartz, and J. Makhoul, “A compact model for speaker-adaptive training,” in Proc. ICSLP, pp. 1137–1140 1996. [9] H. Liao and M. J. F. ales, “Adaptive training with joint uncertainty decoding for robust recognition of noisy data,” in Proc. ICASSP, pp. 389–392, 2007. [10] O. Kalinli, M. L. Seltzer, J. Droppo, and A. Acero, “Noise adaptive training for robust automatic speech recognition,” IEEE Trans. on Audio, Speech, and Language Processing, vol. 18, pp. 1889–1901, 2010. [11] F. Flego and M. J. F. Gales, “Discriminative adaptive training with VTS and JUD,” in Proc. ARSU, pp. 170 –175, 2009.
[12] B.-H. Juang, W. Chou, and C.-H. Lee, “Minimum classification error rate methods for speech recognition,” IEEE Trans. Speech Audio Processing, vol. 5, pp. 257–265, 1997. [13] X. Xiao, J. Li, E. Chng, H. Li, and C.-H. Lee, “A study on the generalization capability of acoustic models for robust speech recognition,” IEEE Trans. Speech Audio Processing, vol. 18, pp. 1158–1169, 2010. [14] S. Furui, “ eneralization problem in ASR acoustic model training and adaptation,” in Proc. ASRU, pp. 1–10, 2009. [15] D. Povey and P. C. Woodland, “Minimum phone error and i-smoothing for improved discriminative training,” in Proc. ICASSP, pp. 105–108, 2002. [16] V. Valtchev, J. Odell, P. C. Woodland, and S. Young, “MMIE training of large vocabulary recognition systems,” Speech Communication, vol. 22, pp. 303–314, 1997. [17] J. Li, M. Yuan, and C.-H. Lee, “Approximate test risk bound minimization through soft margin estimation,” IEEE Trans. on Audio, Speech, and Language Processing, vol. 15, pp. 2393–2404, 2007. [18] D. Y. Kim, C. K. Un, and N. S. Kim, “Speech recognition in noisy environments using first order vector Taylor series,” Speech Communication, vol. 24, pp. 39–49, 1998. [19] Y. ong, “A method of joint compensation of additive and convolutive distortions for speaker-independent speech recognition,” IEEE Trans. Speech Audio Processing, vol. 13, pp. 975–983, 2005. [20] J. Li, L. Deng, D. Yu, Y. ong, and A. Acero, “A unified framework of HMM adaptation with joint compensation of additive and convolutive distortions,” Computer Speech and Language, vol. 23, pp. 389–405, 2009. [21] J. Li, D. Yu, Y. Gong, and L. Deng, “Unscented transform with online distortion estimation for HMM adaptation,” in Proc. Interspeech, pp. 1660– 1663, 2010. [22] H. Liao and M. J. F. ales, “Joint uncertainty decoding for noise robust speech recognition,” in Proc. Interspeech, pp. 3129–3132, 2005. [23] Y. Tsao, C.-L. Huang, S. Matsuda, C. Hori, and H. Kashioka, “A linear projection approach to environment modeling for robust speech recognition,” in Proc. ICASSP, pp. 705–708, 2012. [24] A. C. Suredran, C.-H. Lee, and M. Rahim, “Nonlinear compensation for stochastic matching,” IEEE Trans. Speech Audio Processing, vol. 7, pp. 643–655, 1999. [25] C. Leggetter and P. Woodland, “Maximum likelihood linear regression for speaker adaptation of continuous density hidden Markov models,” Computer Speech and Language, vol. 9, pp. 171–185, 1995. [26] M. J. F. ales, “Maximum likelihood linear transformations for HMM-based speech recognition,” Technical report, TR 291, Cambridge University, 1997. [27] C. Chesta, O. Siohan, and C.-H. Lee, “Maximum a posteriori linear regression for hidden Markov model adaptation,” in Proc. Eurospeech, pp. 211–214, 1999. [28] O. Siohan, C. Chesta, and C.-H. Lee, “Joint maximum a posteriori adaptation of transformation and HMM parameters,” IEEE Trans. Speech Audio Processing, vol. 9, pp. 417–428, 2001. [29] M. L. Seltzer and A. Acero, “Separating speaker and environmental variability using factored transforms,” in Poc. Interspeech, pp. 1097–1100, 2011. [30] M. J. F. ales, “Acoustic factorisation,” in Proc. ASRU, pp. 77–80, 2001. [31] Y.-Q. Wang and M. J. F. Gales, “Speaker and noise factorisation on the Aurora4 task,” in Proc. ICASSP, pp. 4583–4587, 2011. [32] R. Kuhn, J.-C. Junqua, P. Nguyen, and N. Niedzielski, “Rapid speaker adaptation in Eigenvoice space,” IEEE Trans. Speech Audio Processing, vol. 8, pp. 695–707, 2000. [33] M. J. F. ales, “Cluster adaptive training of hidden Markov models,” IEEE Trans. Speech Audio Processing, pp. 417–428, 2000. [34] Y. Tsao and C.-H. Lee, “An ensemble speaker and speaking environment modeling approach to robust speech recognition,” IEEE Trans. on Audio, Speech, and Language Processing, vol. 17, pp. 1025–1037, 2009. [35] Y. Tsao and C.-H. Lee, “Improving the ensemble speaker and speaking environment modeling approach by enhancing the precision of the online estimation process,” in Proc. Interspeech, pp. 1265–1268, 2008. [36] I. T. Jolliffe, Principal Component Analysis. Berlin, Germany: Springer-Verlag, 1986. [37] Y. Tsao, S. Matsuda, S. Nakamura, and C.-H. Lee, “MAP estimation of online mapping parameters in ensemble speaker and speaking environment modeling,” in Proc. ASRU, pp. 271–275, 2009. [38] D. Macho, L. Mauuary, B. Noe, Y. M. Cheng, D. Ealey, D. Jouver, H. Kelleher, D. Pearce, and F. Saadoun, “Evaluation of a noise-robust DSR front-end on Aurora databases,” in Proc. ICSLP, pp. 17–20, 2002.
[39] D. Pearce and H.-G. Hirsch, “The aurora experimental framework for the performance evaluation of speech recognition systems under noisy conditions,” in Proc. ISCA ITRW ASR, 2000. [40] K. Shinoda and C.-H. Lee, “A structural Bayes approach to speaker adaptation,” IEEE Trans. Speech Audio Processing, vol. 9, pp. 276–287, 2001. [41] O. Siohan, T. A. Myrvoll, and C.-H. Lee, “Structural maximum a posteriori linear regression for fast HMM adaptation,” Computer Speech and Language, vol. 16, pp. 5–24, 2002. [42] . Meinardus, . Nurnberger, M. Sommer, and H. Strauss, “Algorithms for piecewise polynomials and Splines with free knots,” Mathematics of Computation, vol. 53, pp. 235–247, 1989. [43] S. Chen and D. Donoho, “Basis pursuit,” in Proc. Conf. Signals, Syst. Comput., pp. 41–44, 1994. [44] M. J. F. ales, “The generation and use of regression class trees for MLLR adaptation,” Tech. Rep. CUED/F-INFENG/TR263, Cambridge Univ.,1996. [45] M. Padmanabhan, L. R. Bahl, D. Nahamoo, and M. A. Picheny, “Speaker clustering and transformation for speaker adaptation in speech recognition systems,” IEEE Trans. Speech Audio Processing, vol. 6, pp. 71–77, 1998. [46] J. D. Hamilton, “A quasi-Bayesian approach to estimating parameters for mixtures of normal distributions,” Journal of Business & Economic Statistics, vol. 9, pp. 27–39, 1991. [47] J.-T. Chien, “Quasi-Bayes linear regression for sequential learning of hidden Markov models,” IEEE Trans. Speech Audio Processing, vol. 10, pp. 268–278, 2002. [48] R. Leonard, “A database for speaker-independent digit recognition,” in Proc. ICASSP, pp. 328–331, 1984. [49] H.-G. Hirsch, FaNT—Filtering and Noise Adding Tool. Available: http://dnt.kr.hsniederrhein.de/download.html. [50] ETSI ES 202 050 V1.1.5, Speech processing, transmission and quality-aspects (STQ); distributed speech recognition; advanced frontend feature extraction algorithms. ETSI standard, 2007. [51] J. Wu and Q. Huo, “Several HKU approaches for robust speech recognition and their evaluation on Aurora connected digit recognition tasks,” in Proc. Eurospeech, pp. 21–24, 2003. [52] R. O. Duda, P. E. Hart, and D. G. Stork, Pattern Classification, New York, Wiley, 2001. [53] Y. Tsao, J. Li, and C.-H. Lee, “Ensemble speaker and speaking environment modeling approach with advanced online estimation process,” in Proc. ICASSP, pp. 3833–3836, 2009. [54] A. J. Hayter, Probability and Statistics for Engineers and Scientists, Duxbury Press; 3rd edition, 2006. [55] A. Agresti and C. A. Franklin, Statistics: The Art and Science of Learning from Data (MyStatLab Series), Prentice Hall, 2008.