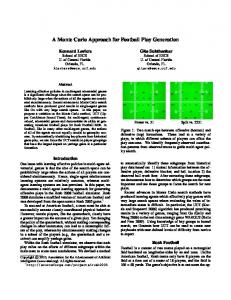
Department of Engineering Technology, University of Central Florida, Orlando, FL 32816, USA ... Meshless methods refers to a class of numerical techniques intended to alleviate the onerous task of ... complication of a surgical intervention.
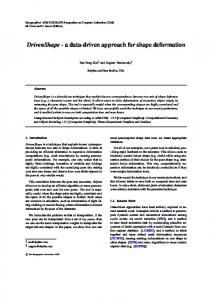
A Meshless CFD Approach for Evolutionary Shape Optimization of Bypass Grafts Anastomoses Z. EL ZAHAB † , E. DIVO ‡ and A. KASSAB †
† Department of Mechanical, Materials and Aerospace Engineering, University of Central Florida, Orlando, FL 32816, USA ‡ Department of Engineering Technology, University of Central Florida, Orlando, FL 32816, USA Improving the blood flow or hemodynamics in the synthetic bypass graft end-to-side distal anastomosis (ETSDA) is an important element for the long-term success of bypass surgeries. An ETSDA is the interconnection between the graft and the operated-on artery. The control of hemodynamics conditions through the ETSDA is mostly dictated by the shape of the ETSDA. Thus, a formal ETSDA shape optimization would serve the goal of improving the ETSDA flowfield. Computational Fluid Dynamics (CFD) is a convenient tool to quantify hemodynamics parameters; also, the genetic algorithm is an effective tool to identify the ETSDA optimal shape that modify those hemodynamics quantities such that the optimization objective is met. The present paper introduces a unique approach where a meshless CFD solver is coupled to a genetic algorithm for the purpose of optimizing the ETSDA shape. Three anastomotic models are optimized herein: the conventional ETSDA, the Miller Cuff ETSDA and the hood ETSDA. Results demonstrate the effectiveness of the proposed integrated optimization approach in obtaining anastomoses optimal shapes. Keywords: End-to-side Distal Anastomoses; Intimal Hyperplasia; Shape Optimization; Meshless CFD; Genetic Algorithms
1. Introduction Meshless methods refers to a class of numerical techniques intended to alleviate the onerous task of mesh generation task required by traditional numerical methods such as the Finite Volume Method (FVM) and the Finite Element Method (FEM). The meshless techniques are well suited to simulate physical phenomena for problems that involve complex geometries, surface discontinuities, large boundary deformations, and shape optimizations. As indicated by the name, the advantage of meshless numerical techniques is due to the fact that the governing differential equations are solved on a non-ordered set of points distributed in space, and as such, meshless techniques lend themselves ideally to automated point redistribution [2]. Meshless methods aer ideally suited for shape optimization as we will demonstrate in this paper through the shape optimization of bypass graft anastomoses [1]. Meshless methods are still under development and they have, so far, proven to be accurate in application to traditional computational fluid mechanics and heat transfer [3-17]. Although vascular surgeons are currently taking the path of minimally invasive endovascular procedures such as the balloon angioplasty and stenting, they still rely on bypass procedures when an endovascular procedure is simply unfeasible[18] . The downside of a bypass procedure is the poor post-operative graft performance due to the occurrence of intimal hyperplasia (IH) at the end-to-side distal anastomosis (ETSDA) as depicted in Figure 1. Anastomosis is connection of two structures, often tubular, and in our case refers to 1
connection between the bypass graft and the arterial vessel. Hyperplasia is a medical term referring to the abnormal proliferation of cells within a tissue or an organ, while, intimal hyperplasia (IH), is the thickening of the tunica intima, which is the inner-most layer of the various tissues composing the aterial wall, as a complication of a surgical intervention. IH preferably localizes at both the floor of the operated-on/host artery and at the graft-artery suture line area as illustrated in Figure 2. This phenomenon was observed by many investigators such as Sottiurai et al. [19], Bassiouny et al. [20], and Trubel et al. [21]. It was suggested in [20] that the IH on the floor of the host artery is purely caused by hemodynamics forces. The suture line IH is associated with the compliance mismatch resulting from the mechanical properties difference between the synthetic graft and the artery biological tissues. A comprehensive review on bypass grafts ETSDA IH can be found in Lemson [22]. The spatial wall shear stress gradient (SWSSG) is a critical hemodynamic parameter that bears consideration as its high values are indicative of the presence of disturbed flow conditions such as flow separation and reattachment, stagnation point flow, and flow recirculation. The in-vitro work of Tardy et al. [25] suggested that the high values of the SWSSG causes a denudation of the endothelium, which will very likely lead to an IH mechanism. In addition, the experimental work of Hsu et al. [26] demonstrated that high values of the SWSSG delay the motion of the endothelial cells that are migrating to re-generate a denuded section of the endothelium. In healthy circumstances, an undisturbed laminar flow with very low SWSSGs would result in a fast re-endothelization and inhibition of the proliferating cells [26]. The experimental visualization of Ojha [27] and numerical simulation of Lei [28] for the ETSDA flowfield reveals high SWSSG values at the ETSDA host artery floor, which is practically an IH site.
Figure 1. The occurrence of IH at the ETSDA.
Figure 2. The ETSDA sites of IH localization.
In order to mitigate the hemodynamics factors believed to cause IH growth, several researchers attempted to optimize the shape of the ETSDA. For instance, the shape optimization approaches of Lei [29] and O'Brien [31] are direct ones that might not yield the optimal ETSDA shape under a given optimization objective, especially when the geometry design variables become numerous. To that effect, Rozza et al. [32] incorporated a gradientbased approach to optimize the graft shape at the ETSDA toe and their objective was to reduce the flow vorticity. Nonetheless, as the gradient-based methods locally search for an optimal solution they might lead to a pre-mature convergence, i.e. converge to a local optimal solution that is not necessarily a global optimal solution as the optimization space might have several local maxima/minima. Consequently, a genetic algorithm (GA) optimization approach that employs a meshless technique is presently proposed to enhance the ETSDA shape. The GA is an evolutionary approach that relies on a global search for the optimal solution within a prescribed search range. The GA prroach is more advantageous than the gradient-based methods due to the
2
evolutionary aspect of the GA as the search mechanism constantly scans the global search range to uncover the global optimal solution. The purpose of this paper is to report study that utilizes that a shape optimization suite that consists of a genetic algorithm, a meshless CFD solver, and an automated pre-processor for the express purpose of ETSDA shape optimization. The application of this suite will be for the steady Newtonian flow in the ETSDA; this preliminary application lacks a number of physiological aspects, even so it serves as a test for the functionality of the proposed optimization suite. Following this introduction, a presentation of the meshless numerical method as formulated to solve the incompressible Navier-Stokes equations is followed by a brief description of the functionality and advantages of its automated pre-processor. Results are presented thereafter for the meshless method computations of the velocity fields and the WSS for laminar steady flow in three different ETSDA geometries. The meshless method results are compared to those produced by an established commercial finite volume CFD solver for validation. Subsequently, a section is stated about the features of the genetic algorithm (GA) and the manner of the GA coupling to the meshless CFD solver. Finally, several shape optimization examples are executed for the three considered anastomosis models. 2. The Localized Meshless Method Numerical Solution of the Navier-Stokes Equations For the current ETSDA flow in peripheral host arteries, we will assume that the blood flow is steady, laminar, and incompressible with no body forces accounted for. Although they are significant, the effects of pulsatile flow and non-Newtonian rheology are ignored in the flow model at this point because the technical aim of this paper is to prove the concept of coupling a CFD solver to an ETSDA shape optimizer; those effects will be reported later on in the literature as the meshless CFD solver will be improved. The flow is governed by the Navier-Stokes (N-S) equations that consist of the continuity equation (1) and the momentum equation (2), Ä f †Z œ! 1 Ä Ä Ä Ä `Z " Z † fZ œ Š f: .f# Z ‹ `> 3
2
Ä where Z œ ?ß @ is the velocity vector, : the pressure, 3 the density, and . the dynamic viscosity. Regarding the velocity boundary conditions, a volumetric flow rate is prescribed at the inlet, a no-slip condition (zero velocity) is prescribed at the wall knowing that blood is viscous, and a non-reflective boundary condition is assigned at the outlet(s). 2.1. The Velocity Correction Scheme In the present meshless method, the N-S equations are solved by an explicit formulation that is based on time-marching the velocity solution at each internal point through controlled time steps until a steady state is p ‡ 5+1 reached. For a given internal point 3, an artificial velocity Z 3 is estimated at every new time step k+1 from Ä Ä 5 the momentum equation by sampling the values of the convective term Š Z † fZ ‹ ß the viscous term 3 5 5 . #Ä " Š 3 f Z ‹ , and the pressure gradient term Š 3 f:‹ from the previous time step k such as, 3
3
3
p ‡ 5+1 p 5 Ä " . p p Z3 œ Z 3 ?>Œ f: f# Z Z † fZ 3 3
5
(3) 3
p ‡ 5+1 Note that Z 3 does not satisfy the continuity equation and should be corrected. This correction is done by determining the correction potential 935" from the Poisson equation for the mass defect, p ‡ 5" ˆf# 9‰5" œ Šf † Z ‹ 3
Ð4Ñ
3
Equation 3 can be explicitly solved by imposing a homogeneous second kind boundary condition type at the inlet and walls and a homogeneous first kind boundary condition at the outlet(s). When 935" is solved, it is p ‡ 5+1 p 5+1 directly used to correct Z 3 and consequently yield a velocity field Z 3 that should satisfy the continuity equation, that is, p 5+1 p ‡ 5+1 Z3 œZ3 f9
5" 3
Ð5Ñ
The pressure field can be obtained by explicitly solving a Poisson equation that is obtained by taking the divergence of the momentum equation at the new time step 5 ", Ä Ä 5+1 ˆf# :‰5" œ 3f † Š Z † fZ ‹ 3 3
Ð6Ñ
Equation 6 can be solved by imposing a pre-determined second kind boundary condition type at the inlet and walls and a prescribed first kind boundary condition at the outlet. 2.2. Localized Interpolation Topologies A key task when explicitly solving for the artificial velocity, the potential, the corrected velocity, and the pressure is to evaluate their derivatives in a stable manner. The current meshless technique relies on localized interpolations to evaluate the field variables first-order and second-order derivatives at each point on both the domain boundary and interior. What makes the meshless method stands with respect to other traditional numerical methods is its capability to interpolate the derivatives of any given field variable to a high order of accuracy over a set of non-uniformly distributed points. Other traditional numerical techniques, such as the FVM or FDM, require that the solution points be uniformly distributed or at least ordered in some sense so that derivatives can be computed with a high order of accuracy. In the current meshless technique, each point in the domain is treated as a data center that acquires influence from a neighboring set of points. The data center and its influence points are grouped together in a local topology over which the interpolation is executed. The local topologies of two arbitrary boundary and internal data centers are illustrated in Figure 3(a) and Figure 3(b) respectively.
4
Figure 3. The local topology of: (a) a boundary data center and (b) and interior data center. In order to suppress the oscillations arising from the non-linearity of the convective terms in the momentum equation, the local topology is further reduced to an upwind topology by appropriate skewing of the point selection and over which a solution limiter is applied. Taking the pressure field variable as an example, it can be interpolated over a local topology according to an expansion about a given data center B- ; this expansion is illustrated in Equation 7. RJ
:ÐB- Ñ œ
α 4 ;4 Ð B - Ñ
7
4œ"
R J is the number of points in the local topology of B- , α4 are the expansion coefficients, and ;4 are the expansion functions that depend solely on the geometrical position of the points within the topology. Two types of expansion functions are used for the current meshless technique: the least-squares-enhanced polynomials and radial basis functions. Those types of expansion functions can predict derivatives with a high order of accuracy at a data center even with non-uniformly distributed influence points in its local topology (such as shown in Figure 3). To estimate the field variable derivatives at B- , any linear differential operator _ can be applied over Equation 7 such as: RJ
_:ÐB- Ñ œ
α4 _;4 ÐB- Ñ
Ð8Ñ
4œ"
where B- is the data center of the topology. The _ operator can be either a first order derivative, a second order derivative, or even a cross derivative. Thus, in a matrix-vector form: _:ÐB- Ñ œ Ö_;ÐB- Ñ×X Öα× œ Ö_;ÐB- Ñ×X Ò;Ó" Ö:× œ Ö_×X Ö:×
9
Therefore, the evaluation of the derivatives at each of the data centers B- is provided by a simple inner product of two small vectors: Ö_× which can be pre-built and stored and Ö:× which is the sampled field variable through the topology of the data center B- from the previous time step 5 . A more detailed discussion of the localized meshless method as applied to the Navier-Stokes equation can be found in [15-17].
5
2.3. The Automated Geometry Pre-processor The advantage of using the automated pre-processor is in its ability to re-deploy a point distribution in the physical domain of interest as it evolves in the shape optimization process without the need for user interaction. When dealing with any geometry, classical numerical techniques such as the finite volume method (FVM) and the finite difference method (FDM) require a well-structured body-fitted mesh in order to produce valid results. However, the process of building a body-fitted mesh usually requires interaction by the user to develop meshes in a careful manner that avoid, amongst other things, grid skewness and grid misalignment with the flow. Besides, dividing the domain into multi-blocks becomes necessary in the case of a complex three-dimensional geometric model, which further makes the mesh generation task daunting and time-inefficient. Unstructured meshes provide some relief, however, to capture the boundary layer a structured meshes is still required close to the walls and moreover, unstructured mesh solvers are often too dissipative. As such, the localized meshless method we utilize in this study offers many advantages in shape optimization application. The automated pre-processor only requires the geometry information as an input. In the present twodimensional analysis, the geometry corners coordinates and the point distribution density on each boundary edge can give the input information. Once the geometry information is specified, the boundary points will be distributed uniformly along the boundary; following its normal vector, each boundary point will then create one neighboring shadow point in the interior. The shadow point serves to determine the normal derivatives at it corresponding boundary point. Next, the internal points are automatically created in the domain interior following a Cartesian order that is independent from the order of the boundary and the shadow points. An example showing the automated point distribution executed by preprocessor in the ETSDA vicinity is shown in Figure 4. Although the interior points seem to follow a Cartesian uniform distribution, they assume no order or connectivity with respect the boundary points as it shows in Figure 5. This non-ordered relation between the interior and the boundary points really gives the current CFD numerical technique a "meshless" aspect. Note that the Cartesian distribution of the points in the domain interior will significantly mitigate the numerical diffusion of the solution, hence putting the usage of current pre-processor at an advantage over the usage of a traditional FVM/FDM unstructured mesh generator.
Figure 4. The automated pre-processor output.
Figure 5. The order independence between the boundary and internal points
2.4. Numerical Validation of the Meshless Solver Since the localized meshless method is a relatively newcomer to computational fluid dynamics modeling, we benchmark its results with a well-established FVM CFD solver (FLUENT 6.2) for incompressible laminar flows in identical geometries and under the same physical conditions. It is critical for the present shape optimization approach to have the meshless CFD solver produce accurate results for any general case. Three
6
standard ETSDA models are selected for validation: the conventional model, the Miller Cuff model, and the hood model. For all the current ETSDA models, the blood flow is simulated as steady and Newtonian at a Reynolds number of 450 based on the graft diameter. The blood density and dynamic viscosity are taken to be equal to 1060 kg/m$ and 0.004 Ns/m# respectively. The bypass graft diameter is specified as 6 mm for all the three anastomotic models. The host artery diameter is equal to 4 mm, which is within the diameter range of the popliteal artery (at the knee level) where bypass surgeries with synthetic grafts are usually performed. For both the conventional and Miller Cuff models, the anastomotic angle is chosen to be 45 degrees. Besides, for the Miller Cuff model, the cuff height is chosen to be 3 mm. For the hood ETSDA model, the geometry of the hood consists of a cubic spline that is defined by four control points cg , c1 , c2 , and ca . Besides, the artery cut length (CL ) is taken as 1.5 mm (The artery cut length is the horizontal distance between the heel location and the toe location). For all the ETSDA models, we assume that there is no proximal flow due to a complete blockage of the host artery at the proximal side. The two-dimensional schematics of the conventional, Miller Cuff, and hood ETSDA models are shown in Figure 6.a through Figure 6.c respectively.
Figure 6. The schematics of the three bypass graft ETSDA geometries.
The difference in the pre-processing nature between the meshless method and the FVM is illustrated in Figure 7 and 8 for the given three ETSDA models. For the meshless pre-processing, one can notice that the distribution of the internal points is always Cartesian regardless of the geometry boundaries. For the FVM preprocessing however, the disposition of the mesh cells is dictated by the shape of the boundaries; unless the mesh propagates in a manner that fits the geometry, the FVM will yield un-converged results. In the event of a change in one or more of the geometry design variables, the internal points re-distribution for the meshless solver does not need a human effort as long as there is a simple automatic command performing a Cartesian distribution of those points. Conversely, the re-meshing of the modified geometry for the FVM solution cannot be done automatically and it does need a user to ensure a proper fit of the mesh within the modified geometry. This argument establishes the effectiveness of the meshless method in the area of genetic-algorithms-based shape optimization, which will be discussed in the following section. It should be noted that the benchmark FVM solutions, against which the localized meshless CFD solutions are gauged, are obtained using the QUICK upwinding scheme. The localized meshless and the FVM results are compared qualitatively in terms of velocity magnitude, xvelocity profiles and the WSS computed on the floor of the host artery. The velocity magnitude comparison is provided in Figures 9, 10, and 11 for the conventional, Miller Cuff, and hood ETSDA models respectively. The velocity magnitude contours of the three ETSDA models demonstrate a very good qualitative agreement between the values predicted by the FVM and the localized meshless solvers. Particularly, the meshless method is capable of capturing the flow recirculation at the floor of the host artery consistently with the FVM. Moreover, the flow acceleration as it emerges from the graft to the artery as predicted by the meshless solver agrees well with that predicted by the FVM solver.
7
To validate the accuracy of the meshless method quantitatively, we plot the meshless and FVM x-velocity profiles at five vertical sections (X1, X2, X3, X4, and X5) across the anastomoses of the three given ETSDA models. The locations of the velocity profiles for the three given ETSDA models are revealed in Figure 12.a through Figure 12.c. The velocity profiles results are shown for the conventional ETSDA model, Miller Cuff ETSDA model, and the hood ETSDA model in Figures 13.a, 13.b, and 13.c respectively. Although minor discrepancies are evident, the velocity profiles indicate a high level of quantitative agreement between the meshless method and the FVM.
Figure 7. The meshless point distribution.
Figure 8. The FVM meshes. 0.00 0.03 0.07 0.10 0.13 0.17 0.20 0.23 0.27 0.30 0.33 0.37 0.40
0.00 0.03 0.07 0.10 0.13 0.17 0.20 0.23 0.27 0.30 0.33 0.37 0.40
a Figure 9. Conventional ETSDA model meshless (a) and FVM (b) velocity magnitude contours.
0.00
0.06
0.12
0.17
0.23
0.29
0.35
0.40
0.00
0.46
0.06
0.12
0.17
0.23
0.29
0.35
0.40
a Figure 10. Miller Cuff ETSDA model meshless (a) and FVM (b) velocity magnitude contours.
8
b
0.46
b
0.00
0.08
0.17
0.25
0.00
0.33
0.08
0.17
0.25
0.33
a Figure 11. Hood ETSDA model meshless (a) and FVM (b) velocity magnitude contours.
(a)
b
(b)
(c) Figure 12. The x-velocity profiles and WSS locations for the three ETSDA models. Meshless at X1 Meshless at X2 Meshless at X3 Meshless at X4 Meshless at X5 FVM at X1 FVM at X2 FVM at X3 FVM at X4 FVM at X5
-0.1
0
0.1
0.2
X-Velocity (m/sec)
0.3
Meshless at X1 Meshless at X2 Meshless at X3 Meshless at X4 Meshless at X5 FVM at X1 FVM at X2 FVM at X3 FVM at X4 FVM at X5
0.4
-0.1
(a)
9
0.0
0.1
0.2 0.3 X-Velocity (m/sec)
0.4
0.5
(b)
Meshless at X1 Meshless at X2 Meshless at X3 Meshless at X4 Meshless at X5 FVM at X1 FVM at X2 FVM at X3 FVM at X4 FVM at X5
-0.1
0.0
0.1 0.2 X-Velocity (m/sec)
0.3
0.4
(c) Figure 13. The x-velocity profiles for the ETSDA models. Due to the adverse effects of its spatial and temporal gradients on the endothelium, we benchmark the meshless results of the WSS at the floor of the host artery with the WSS results generated by the FVM solver for all the ETSDA models. The development of the IH on the host artery floor is thought to be purely caused by fluid mechanics factors, unlike the situation at the suture line where injury and graft-artery compliance mismatch play a main role []. The two-dimensional WSS magnitude is expressed such as: p [ WW œ .½ > ½
10
p where > is the traction vector and its B and C components are: >B œ #
`? `? `@ 8B ΠBC `B `C `B
>C œ Œ
`? `@ `@ 8B # 8 C `C `B `C
11 12
where 8B and 8C are respectively the B- and C-components of the outward drawn unit normal vector at the boundary. The meshless and FVM plots of the WSS for the conventional, Miller Cuff, and hood ETSDA models on their host artery floors (marked by the red line in each of Figures 12.a, 12.b, and 12.c) are presented in Figures 14.a, 14.b, and 14.c respectively. The WSS results in Figure 14 reflect an acceptable agreement between the meshless method and the FVM. The minor discrepancies in the WSS between the two methods is directly attributed to the discrepancies found in the x-velocity profiles already pointed out in Figure 13. Should the x-velocity profiles perfectly match, there will be no differences in the WSS as extracted from both methods.
10
4.5 4.0
6.0
3.5
5.0
3.0
WSS (N/m2)
WSS (N/m2)
Meshless WSS FVM WSS
7.0
Meshless WSS FVM WSS
2.5 2.0 1.5
4.0 3.0 2.0
1.0
1.0
0.5 0.0 0.050
0.060 0.070 0.080 Artery Axial Distance (m)
0.0 0.050
0.090
(a)
0.060
0.070 0.080 Artery Axial Distance (m)
0.090
(b)
3.5
Meshless WSS 3
WSS (N/m2)
2.5
FVM WSS
2 1.5 1 0.5 0 0.05
0.06 0.07 0.08 Artery Axial Distance (m)
0.09
(c) Figure 14. Meshless and FVM WSS plots at the artery floor for all the ETSDA models. 3. The Genetic-Algorithm-Based ETSDA Shape Optimization 3.1. The Operation of Genetic Algorithms Genetic algorithms (GA) are evolutionary optimization techniques, that is they utilize ideas and take inspirations from the natural evolution of living systems. Evolutionary optimization are well suited to optimization of systems that exhibit high non-linear behaviors and they are characterized by several features that distinguish them from other optimization algorithms. First, they work with an assembly of different solutions, this is called the population of individuals, instead of only working with a single individual representing one solution. Second, there is communication and information exchange among individuals in the population. Such communications and information exchange are the result of the individuals selection and/or recombination at each generation of the evolution. Third, all the evolutionary optimization algorithms converge to a final generation mostly consisting of "elite individuals" that represent the best solutions. A comprehensive review and insight on the GA can be found in Goldberg [35]. For a shape optimization application, the GA process begins by randomly setting an initial population of possible individuals, where each individual represents a random geometry defined by a set of design variables. This population maintains the same number of individuals as it evolves throughout successive generations. Each individual is referred to as a ‘chromosome’ containing the binary representation of its design variables referred to as ‘genes’ of the chromosome to which genetic operators are applied. Figure 15 illustrates the genetic encoding of a given individual or chromosome. Each design variable is bounded with a minimum and a maximum value, forming a search range for the optimal solutions are sought. The genetic representation of the problem will be crucial to
11
the success of the GA. The fitness, F1 , of each individual in the population treated by the GA is evaluated through an objective function, ZGA . A typical GA relies on an iterative approach and at each iteration, the processes of selection, cross-over, and mutation operators are used to alter the individuals optimization parameters such that ZGA is minimized [40]. A selection operator is first applied to the population in order to determine and select the individuals that are going to pass information in a mating process with the rest of the individuals in the population. The probability of being a selected individual is calculated as the ratio between the value of the fitness function of each individual and the sum of all objectives function values. A weighted roulette wheel is generated, where each member of the current population is assigned a portion of the wheel in proportion to its probability of selection. The wheel is spun as many times as there are individuals in the population leading to the survival of the best chromosomes and the death of the worst ones. The selection process could be elitist whereby a number of the selected individuals are transferred directly to the new generation without undergoing the cross-over and mutation processes [36,37]. The elitist selection approach has been proven to speed-up the GA convergence by preventing the loss of the identified good solutions [38]. The selection approach employed in this paper is not formally elitist as only the best selected individual is directly transferred to the new generation. For the rest of the selected individuals which have not been directly transferred to the new generation, the cross-over or mating process starts to allow the genetic information contained of those individuals to be combined and hence generate offsprings. The mutation is the final operator that is applied to randomly affects the information obtained by the mating of individuals for further genetic improvement. Two types of mutations are commonly utilized in GA's [35,39]: the creep mutation and the jump mutation. With regards to creep mutation, a creep probability is assigned to every bit of each individual/chromosome in the population; if the mutation is effective, the bit will be switched from 0 to 1 or vice-versa. This process is implemented by generating a random number within the range (0...1) for each bit within the chromosome. If the generated number is smaller than the mutation probability the bit is mutated. Concerning the jump mutation, a jump probability is applied to every chromosome/individual in the population. If the jump mutation is effective, all bits within the chromosome/individual are switched from 0 to 1 and vice-versa. Djurisic [36] introduced an adaptive mutation technique by which each gene within of a newly-born individual is mutated based on that gene average value for all the individuals within the given population. Following selection, crossover and mutation the new population is ready for its next evolution until the convergence criteria "fitness" is reached. In summary, the genetic algorithms can be applied as follows: 1. Generate the initial population P(0) at random and set i=0 2. REPEAT a. Evaluate the Fitness of each individual in P(i) b. Select Parents from P(i) based on their fitness as follows: Given the fitness of 8 individuals as F" ,F2 ,...,Fn Þ Then, select individual 3 with probability expressed in equation 13, :3 œ
F3 8
F3 4œ"
This is often called roulette wheel selection
12
Ð13Ñ
d. Apply CROSSOVER to selected parents. e. Apply mutation to crossed-over new individuals. f. Replace parents by the offspring to produce generation P(i+1) 3. UNTIL the desired criterion is satisfied.
Figure 15. Example of an individual characterized by four genes encoded in a chromosome. 3.2. The ETSDA Shape Optimization Objective Function Having already discussed the damaging impact of the SWSSG on the endothelium, an ideal objective to be achieved by shape optimization of the ETSDA would be to arrive at a geometry that minimizes the high values of this hemodynamics wall parameters on the floor of the host artery. The two-dimensional SWSSG magnitude is expressed as: Í # # Í ÍÔ × Ô × #? #? #@ ÍÖ ` # ? > ` #? ` #@ >B Ù ` ` ` C lW[ WWKl œ Í Œ# # B8 Œ C8 p ÖŒ# B8 Œ # C8 p Ù `B `B`C `B# `B`C `C `B`C ½ > ½Ø ½ > ½Ø Õ ÌÕ
14
The SWSSG is essentially a tensor, and the expression of its magnitude in Equation 14 only considers the tensor entries that tangentially affect the endothelial cells. Kleinstreuer at al. [41] discussed the formulation of the current SWSSG magnitude expression. Examining Figures 9, 10, and 11, one can predict high SWSSG values at the floor occurring near the disturbed flow area where there is a flow recirculation and a stagnation point resulting from the flow impingementÞ On the other hand, the SWSSG values are expected to drop in the dead zone area at the host artery proximal side near the blockage and towards the outlet at the host artery distal side where the flow tends to regain its laminar parabolic shape. Plots of the SWSSG values for typical and optimal shapes of the conventional, Miller cuff, and hood ETSDA models are shown respectively in Figures 19, 22, and 26; note the spiking SWSSG values at the artery floor section across from the suture line (flow impingement site) as well as the SWSSG small values near the designated outlet at x = 0.009 (m) (recovered parabolic flow site). Thus, we would like to formulate a shape optimization objective function that represents the high values of the SWSSG at the host artery floor section where IH tends to develop. The objective function can be selected as the L# norm of the SWSSG magnitude at every boundary node on the host artery floor section that is opposite to the suture line; we call this section as the ‘floor optimization section’ Thus, the objective function, F, can be expressed as:
13
Í Í Í " RFJ lW[ WWKl J œ Ì RFJ 3œ" (1/D+/