UBICOMM 2012 : The Sixth International Conference on Mobile Ubiquitous Computing, Systems, Services and Technologies
A Metadata Monitoring System for Ubiquitous Computing Caio Batista, Gustavo Alves, Everton Cavalcante, Frederico Lopes, Thais Batista UFRN – Federal University of Rio Grande do Norte Natal, Brazil {caiosergiobatista, gustavoalvescc, evertonranielly, fred.lopes}@gmail.com,
[email protected] Abstract—In the highly dynamic context of ubiquitous systems, applications need to be continuously aware of QoS and QoC metadata to ensure their required level of quality. We present QoMonitor, a metadata monitoring system that receives synchronous and asynchronous requests from clients (a middleware system that supports ubiquitous applications), recovers metadata from several context providers, and sends them to the clients. We also present an evaluation of QoMonitor under a quantitative perspective, which aims to address the time for assessing QoS and QoC parameters and the time to completely reply to synchronous and asynchronous requests in the context of a health care application. The proposed monitoring system enables ubiquitous applications to focus on addressing the business requirements of the application and abstract away the burden of dealing with the complexities related to synchronous and asynchronous metadata monitoring. Keywords – metadata; monitoring; Ubiquitous Computing; health care application.
I.
INTRODUCTION
Ubiquitous Computing [1] uses a variety of devices, sensors and networks to form a distributed, highly heterogeneous environment integrated to daily activities of users. Typically, ubiquitous applications are composed of services and use context information from several sources to perform their tasks. In this scenario in which applications encompass contextual data and services from different sources, it is essential to know the quality of the provided information and services so that applications can use those that satisfy their requirements. Therefore, the selection of the proper services among those provided by several available providers is performed according to the quality of context information, called Quality of Context (QoC) [2] and/or the quality of the provided services, called Quality of Service (QoS). During the execution of the applications, it is also necessary to ensure that services and context information continue to satisfy the QoS/QoC application requirements. Both QoS and QoC quality parameters are typically described by metadata, which contain information about observable variables regarding services and/or context, such as resolution, precision, and freshness, for QoC, and error rate, uptime, and response time, for QoS. Ubiquitous applications are inherently dynamic since they use: (i) mobile devices, which can often be or not be in the area covered by a given network; (ii) wireless connections, which are subjected to interruptions and fluctuations in the intensity of the transmit-
Copyright (c) IARIA, 2012.
ISBN: 978-1-61208-236-3
Flávia C. Delicato, Paulo F. Pires UFRJ – Federal University of Rio de Janeiro Rio de Janeiro, Brazil {fdelicato, paulo.f.pires}@gmail.com
ted signal, and; (iii) physical parameters, such as temperature, pressure, location, which can frequently change. In this highly dynamic context, applications need to be continuously aware of QoS and QoC metadata to ensure their required level of quality. For instance, in health care applications, vital data from patients (context information) need to be provided at a high refresh rate (QoC parameter) and by a service with a low response time (QoS parameter). In this scenario, an important challenge is to provide efficient means to monitor QoS and QoC metadata, thus enabling the application to periodically gather the monitored metadata and also to be asynchronously notified whenever a given metadata becomes available. In the literature, some works on monitoring metadata in ubiquitous applications focus just on QoS [12] or QoC monitoring [11, 13] and either on synchronous or asynchronous mode [11, 13]; however, it is important to support both monitoring modes and QoS and QoC metadata. In this perspective, this paper presents QoMonitor, a metadata monitoring system that receives synchronous and asynchronous requests from clients (ubiquitous applications and/or middleware), recovers metadata from context providers, and sends them to the clients. By using the proposed monitoring system, ubiquitous applications can focus on addressing fundamental problems of the application and abstract away the burden of dealing with the complexities related to synchronous and asynchronous metadata monitoring. Furthermore, metadata monitored by QoMonitor can be available to ubiquitous applications, besides it can be associated with a middleware that would be responsible for managing this information in order to select the services that will be used by an application, for example. The QoMonitor monitoring system consists of three repositories: (i) a metadata repository, which persists all QoS and QoC metadata of the monitored services and the metadata provided by the services providers; (ii) a service repository, which stores information about all monitored services and the parameters needed to communicate with them, and; (iii) a client repository, which stores client information, thus enabling the monitor to communicate with its clients. In addition, QoMonitor contains: (i) an ontology module, which is responsible for specifying metadata using an ontology model to represent the concepts in an unambiguous way; (ii) a requests handler, which receives the requests from clients, gathers the metadata and replies to them, and; (iii) an assessment module, which is responsible for effectively monitoring and assessing QoS/QoC metadata of the services stored in the service repository.
60
UBICOMM 2012 : The Sixth International Conference on Mobile Ubiquitous Computing, Systems, Services and Technologies
This paper is structured as follows. Section II briefly describes a health care application which serves as a running example used along this paper. Section III presents QoMonitor, the proposed metadata monitoring system. Section IV contains an evaluation of QoMonitor. Section V presents related work. Finally, Section VI contains the final remarks. II.
CASE STUDY
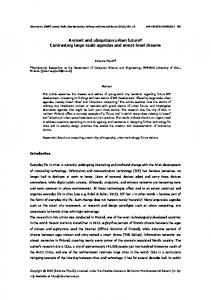
This case study is an application related to the health care context in a scenario inspired in the work of Hegering et al. [3]. The application considers as users patients with critical diseases, doctors, and ambulance staffs that use conventional or specific-purpose mobile devices, connected through heterogeneous wireless networks (e.g. Wi-Fi, 3G, Bluetooth, etc.) and/or wired infrastructures. Patients have their vital functions (e.g. blood pressure, cardiac beat rate, etc.) continuously monitored by body sensors. Besides the information provided by these sensors, medical information (called medical profile) about the patients (e.g. if a patient is smoker or not, if he has diseases and/or allergies, etc.) and previous events/medical diagnosis is available. In health care applications, if a patient has complications in his/her current health state, a set of actions must be taken, such as to trigger emergency staffs to give aid to the patient. This application was chosen because of its relevance in a real-world scenario and because it uses different types of context information deriving from different types of mobile or specific-purpose devices. In addition, many kinds of services can be considered, including services with the same functionality (such as GPS, 3G, or Wi-Fi service location), allowing us to monitor similar services implemented using distinct technologies and providing different levels of quality. To exemplify a health care application, the blood pressure of a patient was chosen as a parameter to be monitored. To sum up, if the blood pressure of the current patient is higher than a specific limit, then he/she may be suffering a cardiac attack or other kind of complication. Thus, emergency staffs are triggered and information about the current health conditions and the patient’s medical profile are provided, as well as information about his/her localization. At the same time, the application sends a message to the patient’s doctor. Figure 1 gives an overview of the different types of users and the context information processed by the application. Firstly, the patient’s blood pressure is synchronously or asynchronously monitored by the GetBloodPressure (S1) and SubscribeBloodPressure (S1’) services, respectively. If the value of the blood pressure exceeds the acceptable limit, then the patient’s medical profile, which contains previous and current information about the patient and may influence his/her treatment or be correlated to the problem in question, is consulted by executing the ConsultMedicalProfile (S2) service. Next, available closest doctors are found by executing the SearchClosestDoctorsCel (S3) and SearchClosestDoctorsGPS (S3’) localization services, so that one of them can be selected to be used by the application according to their quality (QoS/QoC) parameters. Afterwards, a SMS alert about the current medical state of the patient is sent to the doctors by executing the SendSMS (S4) service.
Copyright (c) IARIA, 2012.
ISBN: 978-1-61208-236-3
Figure 1. Users and context information in a health care application.
Together with data gathered by consulting the patient’s medical profile, the application chooses and triggers emergency staffs through SearchClosestAmbulancesGPS (S5) and CallAmbulance (S6) by using the localization of these emergency staffs with respect to the patient. Next, the best route (the shortest or the faster course) between the patient’s location and the emergency staff is determined by the DetermineRoute (S7) service, so that the emergency staff can reach the patient and carry him/her from the current location to the hospital, completing the aid action. Finally, the patient’s medical profile is updated with the event that just took place by executing the UpdateMedicalProfile service (S8). III.
QOMONITOR: A METADATA MONITORING SYSTEM
QoMonitor is a metadata monitoring system that receives synchronous and asynchronous requests from clients (ubiquitous applications and/or middleware), recovers metadata from context providers, and sends them to the clients. This section presents the architecture and operation of QoMonitor (Section III.A) and how it can be used in the context of our running example (Section III.B). A. Architecture and operation Figure 2 illustrates the architecture of QoMonitor, which was specified with a modular design, so that each component can work in an independent way. QoMonitor provides two communication interfaces: IClient for communicating with clients and IServer for communicating with service providers. The Server Façade modularizes all monitor communication with service providers thus being responsible for registering new services in the Service Repository and communicating with the providers. When one of the service providers is registered in QoMonitor, the Server Façade receives the data provided by this provider and forwards them to the Service Repository. The Service Repository is responsible for storing information regarding all monitored services and the parameters required to communicate with them. There are two ways to add new services to the Service Repository. In the first one the client makes a request to retrieve QoS/QoC metadata, and if the service’s data are not in the repository, then the Client Façade provides the data for storing the new service in the repository. In the second way, the service registers itself in the monitor through the interface provided by the Server Façade. Whenever a new service is added to the
61
UBICOMM 2012 : The Sixth International Conference on Mobile Ubiquitous Computing, Systems, Services and Technologies
TABLE 1. METHODS OF THE QOMONITOR COMMUNICATION API. Service Provider A
...
Service Provider B
Service Provider N
IServer
Method
Functionality
register
clients register themselves in the monitor
getServiceQuality subscribeServiceQuality
QoMonitor Server Façade Service Repository
unsubscribeServiceQuality
Assessment Module
Metadata Repository
Blackboard
Ontology Module Controller
Request Handler Synchronous Request
Asynchronous Request
Parameter X Assessor
Client Repository
Parameter Y Assessor
...
Parameter Z Assessor
Client Façade
IClient
Client 1
clients make synchronous requests to get QoS/QoC metadata clients make asynchronous requsts to get QoS/QoC metadata the monitor stops the sending periodic responses to clients
Client 2
...
Client N
Figure 2. QoMonitor architecture.
repository, the Assessment Module is notified to start the monitoring and assessment of the services. The Client Façade is responsible for allowing the communication of the clients with the monitor, which can be any ubiquitous application or middleware that needs to make use of QoS/QoC parameters. To perform this communication with clients, it was defined a simple API (summarized in Table 1) that implements the IClient interface. Through this API, clients can register themselves on the monitor and make synchronous and asynchronous requests. To register itself, the client calls the register method, which receives as parameters the client’s name, IP address, and access port. Then, the Client Façade forwards these data to the Client Repository for storing them to be used when the monitor needs to reply the requests of this client. To perform a synchronous request, the client calls the getServiceQuality method, which receives as parameters the data regarding the monitored service and a list of quality parameters to be sent to the client, and returns the parameters with their respective values represented in the ontology format. For instance, considering the GSMSystem service from the case study, a call to the getServiceQuality method would receive the following parameters: (service name, IP address, and access port), (a list of input parameters), and (a list of the quality parameters to be monitored). If the client wants to make an asynchronous request, then it should call the subscribeServiceQuality method, which receives as parameters: (i) the data regarding the service and the client; (ii) a list of quality parameters to be sent to the client, and; (iii) a return condition in the form of a triple. For instance, if the client wants to be informed when the parameter errorRate of the GSMSystem service is greater than 0%, a call to the subscri-
Copyright (c) IARIA, 2012.
ISBN: 978-1-61208-236-3
beServiceQuality method would receive the following parameters: (service name, IP address, and access port), (a list of input parameters), (client name, IP address, and access port), (a list of quality parameters to be monitored), and (the return condition). To perform this kind of request, the client must implement a method called callback in order to enable the communication between the monitor and the client, so that this method is responsible for receiving the response from the monitor regarding the asynchronous request. The monitor periodically checks if the return condition has been satisfied, and while it is true, the monitor replies to the client providing the parameters with their respective values represented in the form of the ontology, through the callback method. To stop the sending of responses from the monitor, the client calls the unsubscribeServiceQuality method. With the data regarding the request, the Client Façade forwards them to the Request Handler using references to clients and service providers in the respective repositories. Finally, when the data regarding the performed assessments are available, the Client Façade receives the QoS/QoC metadata in the ontology form together with a reference to the current client. If the current service is not in the Service Repository, then the Client Façade calls the Service Repository for storing its data and the repository notifies the Assessment Module informing that a new service has been added. This module immediately starts the monitoring and assessment of data. The Metadata Repository is responsible for persisting all QoS/QoC metadata assessed by the monitor and also QoS/QoC metadata provided by service providers. In turn, the Ontology Module is responsible for representing these data in the form of an ontology as depicted in Figure 3, in which QoS and QoC parameters respectively extend the QoS Parameter and QoC Parameter classes defined in the ontology. An ontology is a data model that represents a set of concepts within a domain and the relationships between them [14], thus providing formal expressiveness and avoiding ambiguity in the semantic interpretations of the same information. For instance, Dobson et al. [4] define the QoS parameter ROCOF (rate of failure occurrence), which has the same definition of the error rate parameter defined by Guo et al. [5] and that is used in this paper as the error rate in a given time interval. This situation can generate an interpretation problem that can be solved by using ontologies. When a monitor component wants to receive metadata in the ontology format, this component provides a reference to the service
62
UBICOMM 2012 : The Sixth International Conference on Mobile Ubiquitous Computing, Systems, Services and Technologies
in the Service Repository and the Ontology Module forwards it to the Metadata Repository, which performs a search and returns the data of the current service. With these data, the Ontology Module performs operations to represent them in the ontology format used by the monitor.
Figure 3. Ontology used by QoMonitor for representing metadata.
The main component of the monitor is the Assessment Module. This component is responsible for assessing QoS/QoC metadata of the services stored in the Service Repository and monitoring them and is composed by three types of elements: assessors, Blackboard, and Controller. Each assessor is responsible for assessing one specific quality (QoS/QoC) parameter from information gathered through requests to the monitored services by the Assessment Module. This information is: (i) the time spent to complete the request (CompletedTime); (ii) if the service was available or not (isAvailable); (iii) the instant in which the request was made (TimeStamp), and; (iv) the date and time of creation/sensing of the context information provided by the service (if it is a context service), so that this information is important because it enables inferring the age (Age) of the context information provided by the service. The Blackboard component incorporates the idea of a shared data repository, which is interesting since the assessors of different QoS/QoC parameters use the same aforementioned information to calculate the value of these parameters. Thus, the use of the Blackboard component avoids a large number of requests to the monitored services since, without this element, each one of the assessors would make isolated requests to the services in order to gather the metadata information, thus negatively impacting their performance. To avoid this problem, the Blackboard centralizes this information so that each assessor is able to receive it and calculate the value of the quality parameter to which the assessor proposes to measure. For instance, assessors regarding QoS parameters such as availability and error rate can make use of historical data stored in the Blackboard about the availability of the service to perform the assessment. The idea of the Controller component is to control the access to the information stored in the Blackboard and the information gathered from the assessment of the parameters,
Copyright (c) IARIA, 2012.
ISBN: 978-1-61208-236-3
so that the assessors do not know the source of the data that they use to make the assessment, thus modularizing the architecture. The monitoring of services works independently, by using threads, and starts at the time when the monitor is available, so that monitoring and assessment operations are executed while the monitor receives and replies requests. This continuous monitoring is intended to speed up the response time of requests since when a request is made, QoS/QoC metadata are already stored and can be accessed by the Request Handler to reply to the clients. Finally, the Request Handler is responsible for retrieving QoS/QoC metadata through the Ontology Module and forwarding them to the clients. When a client makes a synchronous request, the Client Façade forwards it to the Request Handler, which retrieves the current data through the Ontology Module and replies to the Client Façade. When an asynchronous request is forwarded to the Request Handler, it monitors if the QoS/QoC data satisfy the return condition informed by the client; in this case, the Request Handler continuously monitors these data in order to identify whether the return condition is satisfied. When the return condition is met, the Request Handler immediately replies to the Client Façade that calls the callback (listener) method implemented by the client. As the monitoring operation is independent of the other operations performed by the monitor, the response time of a request is considerably small since the service has already been monitored and its parameters have been assessed before making the request. An exceptional situation happens when a client makes a request regarding a service that is not present in the Service Repository, so that this service must be added to the repository and then the monitoring is started. B. Monitoring service providers Before starting the monitoring of services, two time intervals need to be defined in the monitor. The first one is called TimeToRequest and is the time interval in which the Assessment Module makes requests to the service providers. The second time interval is called TotalTime and is the time in which information is considered recent. For instance, if the TotalTime is set to ten minutes, then information gathered more than ten minutes ago will be ignored since this information is considered outdated and can interfere in the assessment calculations of the quality parameters. Next, the Blackboard receives a list of references to the available services from the Service Repository and makes periodic requests (according to TimeToRequest) through the Server Façade to the respective service providers using their data (address and list of parameters), thus returning the time spent to complete the request (CompletedTime), whether it has been performed successfully. If the request has not been successful, then the Server Façade throws an exception that is caught by the Blackboard. For the case study previously described, the context services provided by GPSLocalizationMiddleware and CellularLocalizationMiddleware use QoC metadata, so that the age of this information (Age) is also gathered. In the case study under consideration, no service provider provides the QoS/QoC metadata beforehand, so that after each request the Blackboard stores the request
63
UBICOMM 2012 : The Sixth International Conference on Mobile Ubiquitous Computing, Systems, Services and Technologies
data (CompletedTime, isAvailable, TimeStamp, and Age). If the request has failed, then CompletedTime is equal to -1, isAvailable is false, Age is null, and TimeStamp remains the same. If the service provider itself provides the QoS/QoC metadata, then the Blackboard forwards these metadata to the Ontology Module, which builds the representation of these data in the ontology format and then sends them to the Metadata Repository for storage. With the data stored in the Blackboard, the Controller is called to access the data history of the requests that are in the Blackboard and forward them to each of the assessors. After all assessors finished their assessment and returned the results to the Controller, it forwards the data to the Metadata Repository for storing them. This execution is repeatedly done with a time interval defined by TimeToRequest and is independent of the requests made by the clients since the idea here is that QoS/QoC metadata are already stored before client requests. Thus, the monitor will quickly reply to client requests and can share data whether two clients make requests to the same service. If for some reason the metadata are not available, e.g. when the first monitoring is performed, then the Request Handler remains on standby until the data are available. The running example outlined in Section II clearly illustrates the importance of using a QoS/QoC metadata monitor system when deciding which service will be used by a ubiquitous application. For instance, the service providers GPSLocalizationMiddleware and CellularLocalizationMiddleware are responsible for providing services to localize the doctors of the monitored patient and ambulances, each one using different technologies and possibly different QoS/QoC parameters. Without monitoring data, the application will not know which service is best suited to be used, in terms of quality parameters. The client (a ubiquitous application and/or a middleware) can find out the QoS/QoC metadata of the services that are available by making synchronous requests to the monitor. It can also decide which is the best time to use a particular service provider by making asynchronous requests, e.g. in situations when the response time is smaller than fifty milliseconds or the freshness is smaller than two seconds, etc. IV.
EVALUATION
This Section presents an evaluation of QoMonitor metadata monitoring system proposed in this paper under a quantitative perspective, which aims to address the time for assessing QoS and QoC parameters (Section IV.B) and the time spent to completely reply to synchronous and asynchronous requests to the monitor (Section IV.C). For the purposes of this evaluation, we have used the health care ubiquitous application outlined in Section II. The services used in the case study were implemented as Web services using the Java programming language and the Apache Axis framework [6] and deployed on an Apache Tomcat application server [7] installed in a computer with an Intel® CoreTM i7 2.7 GHz processor, 6 GB of RAM memory and Linux Ubuntu 12.04 operating system, which worked as the server to which requests were performed. In the computational experiments, the QoMonitor monitoring system was executed in a com-
Copyright (c) IARIA, 2012.
ISBN: 978-1-61208-236-3
puter with an Intel® CoreTM i5 2.3 GHz processor, 4 GB of RAM memory and Mac OS X operating system and has performed requests to the services deployed on the Apache Tomcat server installed in the remote server. Aiming to execute such experiments under similar conditions to those observed in a real-world scenario, QoMonitor and the server in which the services were hosted were placed on different networks, so as not completely disregard the influence of the network in the process. In the quantitative evaluations presented in the Sections IV.B and IV.C, we have performed fifteen independent executions for each service and for each of the six parameters listed in Section IV.A, namely: error rate, response time, MTBF, MTTR, uptime and freshness. In these executions, the values chosen for the TotalTime and TimeToRequest times were twenty minutes and five seconds, respectively. A. QoS and QoC parameters In Ubiquitous Computing, context information is gathered from several sources, e.g. it can be provided by users, sensed from sensor devices, derived from multiple origins, etc. Buchholz et al. [2] enumerate some QoC parameters, such as precision, correctness, resolution, freshness, etc. For the evaluation performed in this paper, we have considered the freshness QoC parameter, which expresses the information age, i.e. the time elapsed since the information was generated. Thus, if the information is recent, then it will be more reliable since old information may be outdated. We have chosen just this parameter to assess since other QoC parameters such as precision and resolution are provided by the sensors that measure them [8], so that they can not be properly monitored by our monitoring system. Although precision, resolution and other QoC parameters are not assessed by our QoMonitor, if they are published by the service provider, then the monitor can retrieve them and store these metadata in the ontology format. Similarly, metadata for QoS parameters are associated with the services used by the ubiquitous applications and are intended to identify the quality of the service. Among the various QoS parameters enumerated in the literature [9, 10], we have considered in this evaluation the following five QoS parameters: (i) response time, which is the time elapsed from the instant in which the client performs a request to the instant in which it processes the response message sent by the server; (ii) MTBF, which is the mean time between system failures during its operation; (iii) MTTR, which is the mean time between a system failure and its return to operation (recovery); (iv) error rate, which measures the error rate for data transmission or service operation in a given time, and; (v) uptime, which refers to the operating time (i.e. availability) of a service. B. Asessment of QoS/QoC parameters Table 2 and Table 3 present the minimum, maximum and average assessment times (in milliseconds) for each of the quality parameters considered for each service of the case study enumerated in Section II (from S1 to S8). Here, only the localization services SearchClosestDoctorsCel (S3), SearchClosestDoctorsGPS (S3’) and SearchClosestAmbulancesGPS (S6) and the blood pressure monitoring services
64
UBICOMM 2012 : The Sixth International Conference on Mobile Ubiquitous Computing, Systems, Services and Technologies
TABLE 2. MINIMUM AND MAXIMUM ASSESSMENT TIMES OF THE CONSIDERED QOS AND QOC PARAMETERS. error rate
response time
MTBF
MTTR
uptime
freshness
Services / Parameters
MIN
MAX
MIN
MAX
MIN
MAX
MIN
MAX
MIN
MAX
MIN
MAX
S1
0.173
0.269
0.049
0.043
0.023
0.043
0.021
0.040
0.025
0.041
0.088
0.145
S1’
0.190
0.260
0.087
0.071
0.035
0.071
0.038
0.049
0.034
0.102
0.035
0.151
S2
0.168
0.248
0.054
0.092
0.022
0.059
0.022
0.037
0.034
0.039
-
-
S3
0.226
0.266
0.103
0.128
0.041
0.063
0.040
0.046
0.035
0.149
0.036
0.155
S3’
0.173
0.193
0.062
0.078
0.025
0.035
0.025
0.040
0.025
0.043
0.089
0.109
S4
0.172
0.265
0.074
0.128
0.026
0.048
0.025
0.075
0.026
0.042
-
-
S5
0.172
0.261
0.079
0.129
0.026
0.047
0.025
0.045
0.026
0.041
0.089
0.148
S6
0.193
0.286
0.064
0.115
0.026
0.045
0.025
0.045
0.026
0.040
-
-
S7
0.189
0.261
0.084
0.126
0.036
0.045
0.035
0.044
0.035
0.041
-
-
S8
0.174
0.240
0.045
0.093
0.022
0.036
0.021
0.039
0.025
0.035
-
-
TABLE 3. AVERAGE ASSESSMENT TIMES OF THE CONSIDERED QOS AND QOC PARAMETERS AND RESPECTIVE STANDARD DEVIATIONS. error rate
response time
MTBF
MTTR
uptime
freshness
Services / Parameters
AVG
STD
AVG
STD
AVG
STD
AVG
STD
AVG
STD
AVG
STD
S1
0.211
0.037
0.069
0.018
0.033
0.008
0.030
0.007
0.033
0.006
0.105
0.022
S1’
0.225
0.025
0.116
0.017
0.043
0.008
0.045
0.003
0.041
0.017
0.126
0.030
S2
0.201
0.028
0.074
0.012
0.036
0.007
0.034
0.004
0.036
0.002
-
-
S3
0.251
0.010
0.120
0.006
0.045
0.005
0.042
0.002
0.045
0.029
0.137
0.030
S3’
0.181
0.005
0.067
0.006
0.028
0.003
0.028
0.005
0.031
0.006
0.094
0.007
S4
0.257
0.024
0.118
0.013
0.044
0.005
0.041
0.011
0.037
0.003
-
-
S5
0.234
0.023
0.117
0.016
0.041
0.005
0.040
0.004
0.037
0.004
0.133
0.017
S6
0.225
0.034
0.088
0.021
0.034
0.008
0.034
0.008
0.032
0.006
-
-
S7
0.233
0.025
0.110
0.014
0.041
0.003
0.039
0.003
0.037
0.002
-
-
S8
0.184
0.017
0.053
0.012
0.025
0.005
0.025
0.006
0.028
0.004
-
-
GetBloodPressure (S1) and SubscribeBloodPressure (S1’) are context services, so that only these services have the QoC parameter freshness. The assessment time of a given parameter is basically the time spent by the respective assessor to make the calculations of the values regarding this parameter after the necessary data are recorded in the Blackboard component. In Table 2, minimum and maximum assessment times are reported in the columns labelled as MIN and MAX, respectively. Similarly, in Table 3 the average assessment times are reported in the columns labelled as AVG and the respective standard deviations are reported in the columns labelled as STD. As can be clearly seen in Table 2 and Table 3, all the assessment times do not exceed the order of 1 millisecond, which is very beneficial in the sense that the monitor does not promote a significantly impact in terms of the assessment of the parameters. C. Synchronous and asynchronous requests Table 4 presents the times spent (in milliseconds) by the monitor to completely reply to synchronous and asynchronous requests made by clients regarding the services of the case study, i.e. the time elapsed between the instant when the request is received by the monitor until the instant in which the monitor sends the response, thus encompassing all operations involved in handling this request. As can be observed
Copyright (c) IARIA, 2012.
ISBN: 978-1-61208-236-3
in Table 4, the minimum, maximum and average response times (respectively reported in the columns labelled as MN, MX and AV) are small, so that the time spent by the monitor for receiving requests and replying to them is most influenced by the network than the monitor itself. Therefore, we can conclude that the monitor does not promote a significant impact regarding this issue. TABLE 4. RESPONSE TIMES FOR SYNCHRONOUS AND ASYNCHRONOUS REQUESTS. Services/ Requests
synchronous requests
asynchronous requests
MIN
MAX
AVG
STD
MIN
MAX
AVG
STD
S1
46
86
60
12
46
132
65
28
S1’
45
82
60
10
46
139
64
23
S2
43
108
70
19
43
111
57
18
S3
47
96
65
16
49
75
57
8
S3’
49
84
61
11
47
76
57
10
S4
44
71
57
8
41
123
61
23
S5
48
110
70
18
46
91
60
15
S6
50
117
69
19
48
87
68
13
S7
47
96
65
16
43
88
64
16
S8
50
102
64
15
40
96
53
17
65
UBICOMM 2012 : The Sixth International Conference on Mobile Ubiquitous Computing, Systems, Services and Technologies
V.
RELATED WORK
To the best of our knowledge, works found in the literature focus just on QoS or QoC monitoring and either on synchronous or asynchronous mode, as we have mentioned. However, it is important to support both monitoring modes and also QoS and QoC metadata. In this Section, we briefly present some of these proposals. Huebscher and McCann [11] present a mechanism to choose context services according to the QoC application requirements. The proposed mechanism defines synchronous and asynchronous functions to be used by an application when querying the QoC metadata and uses a directory service to store metadata and services. In a different way of our proposal, it considers only QoC metadata and does not use ontologies, thus being limited to a proprietary context model. Truong et al. [12] present a tool for monitoring and analyzing QoS metrics of grid computing services. QoS metadata regarding individual services are collected and sent to a middleware that stores these monitored data. A reasoning engine performs QoS analysis based on rules contained in a component called QoS knowledge base, which stores QoS historical data, so that it is possible to define automatic actions to react to changes in the parameters by sending alerts to the client. Although this tool is proposed to monitor and analyze QoS metadata at runtime as it is similarly done by our QoMonitor, it does not deal with QoC metadata neither handle synchronous and asynchronous requests. In addition, both works enable clients to retrieve monitored data since they have a storage module. Since our work focuses specifically on monitoring QoS and QoC metadata and making them available for ubiquitous applications or middleware, the QoMonitor system provides the subsides needed to serve as input to another component (or even a middleware) that would be responsible for triggering these automatic actions associated with changes regarding QoS and QoC parameters. Finally, Zheng and Wang [13] propose a tool that supports QoC management. Requests are handled by a context reasoner, which filters context information and notifies the subscribed components about context changes, thus supporting asynchronous requests. In addition, services are stored in a context repository and metadata are represented by an ontology. Although this work is very close to our proposal, it does not support synchronous requests and focuses just on QoC monitoring. VI.
FINAL REMARKS
In this paper, we presented QoMonitor, a metadata monitoring system that is in charge of handling synchronous and asynchronous requests for monitoring QoS and QoC metadata. QoMonitor recovers metadata from several context providers, uses an ontology to represent such metadata, and sends them to the clients. By using the proposed monitoring system, ubiquitous applications can abstract away the burden of dealing with the complexities related to synchro-
Copyright (c) IARIA, 2012.
ISBN: 978-1-61208-236-3
nous and asynchronous metadata monitoring. In addition, these monitored metadata can be available to ubiquitous applications and/or a middleware that would be responsible for managing this information in order to select the services that will be used by an application, for example. We have implemented this system and used it in a health care application and the evaluation of QoMonitor showed that the average time for assessing QoS and QoC parameters and the time spent to completely reply to synchronous and asynchronous requests to the monitor are significantly small. As a future work we aim to evaluate the delay when a given service is not available at the service repository yet and the monitoring system needs to ask a third-party element (typically an underlying middleware) to discover which context provisioning system provides such service. REFERENCES [1] [2]
[3]
[4]
[5]
[6] [7] [8]
[9]
[10]
[11]
[12]
[13]
[14]
M. Weiser, “The computer of the Twenty-First Century”, Scientific American, vol. 265, no. 3, Sep. 1991, pp. 94-104. T. Buchholz, A. Kupper, and M. Schiffers, “Quality of Context: What it is and why we need it”, Proc. of the 10th Workshop of the HP OpenView University, 2003, pp. 1-14. H.G. Hegering, A. Kupper, C. Linnhoff-Popien, and H. Reiser, “Management challenges of context-aware services in ubiquitous environments”, Proc. of the 14th IEEE/IFIP Workshop on Distributed Systems: Operations and Management (DSOM 2003), LNCS, vol. 2867, Germany, Springer Berlin/Heidelberg, 2003, pp. 321-339. G. Dobson and R. Lock, “Developing an ontology for QoS”, Proc. of the 5th Annual DIRC Research Conf., 2005, pp. 128132. G. Guo, F. Yu, Z. Chen, and D. Xie, “A method for semantic Web service selection based on QoS ontology”, Journal of Computers, vol. 6, no. 2, Feb. 2011, pp. 377-386. Apache Axis. Available at: http://ws.apache.org/axis [retrieved: July, 2012] Apache Tomcat. Available at: http://tomcat.apache.org/ [retrieved: July, 2012] A. Manzoor, H. Truong, and S. Dustdar, “Quality of Context: Models and applications for context-aware systems in pervasive environments”, The Knowledge Engineering Review, 2004, pp.1-24. V. Trana, H. Tsujib, and R. Masuda, “A new QoS ontology and its QoS-based ranking algorithm for Web services”, Simulation Modeling Practice and Theory, vol. 17, no. 8, Sep. 2009, pp. 1378-1398. M. Sathya and M. Swarnamugi, “Evaluation of QoS based Web service selection techniques for service composition”, International Journal of Software Engineering, vol. 1, no. 5, Feb. 2011, pp. 73-90. C. Huebscher and A. McCann, “An adaptive middleware framework for context-aware applications”, Personal and Ubiquitous Computing, vol. 10, no. 1, Dec. 2005, pp. 12-20. H. Truong, R. Samborski, and T. Fahringer, “Towards a framework for monitoring and analyzing QoS metrics of grid services”, Proc. of the 2nd IEEE Int. Conf. on e-Science and Grid Computing,USA,IEEE Computer Society, 2006, pp. 1-8. D. Zheng and J. Wang, “Research of the QoC based middleware for service selection in pervasive environment”, International Journal of Information Engineering and Electronic Business, vol. 3, no. 1, Feb. 2011, pp. 30-37. T. Gruber, “A translation approach to portable ontology specifications”, Journal of Knowledge Acquisition, vol. 5, no. 2, Jun. 1993, pp. 199-220.
66