A Method for Application Portfolio Rationalization Matthias Fabriek1, Sjaak Brinkkemper1, Jeroen van Dullemen2 1 Institute of Information and Computer Sciences, Utrecht University, The Netherlands 2 Atos Consulting, The Netherlands
[email protected],
[email protected],
[email protected] Abstract Application portfolio rationalization (APR) aims to analyze and restructure the complete set of applications in an organization. This paper presents a new APR method that assimilates various research results and empirical experiences. It explains that APR does not automatically return on investment: it is important to use the right method in order to get benefits. APR consists of three main steps: the assessment phase, where information on the applications and the portfolio is gathered, the evaluation phase, where the information is analyzed, and the planning phase, where all actions are planned that improve the portfolio and reduce complexity. A real life case of a financial services company shows the method in practice.
1. Introduction At the beginning of the computer era large organizations could buy one expensive computer and run a couple of programs [1]. Later on, when computers and applications became cheaper and departments were responsible for running their own information technology (IT), a lot of computers, networks, and applications were acquired [2]. At the last decade of the previous century, the organizational structure of IT in organizations changed: one centralized IT department was introduced to save money [3]. Approaches as for example Business Process Reengineering were used to optimize the processes in the companies [4]. This created a problematic situation, since every department still used its own software and hardware. Were applications standalone in history, now they became more and more integrated. Applications were continuously improved, removed, added, or melted together, in order to keep the business running [5]. The overview of the application spaghetti was low. IT departments used all manpower to keep the systems up, because a short downtime of some systems would cost their company a lot of money [2].
Some years ago, the management of organizations saw the importance of bringing structure in the application landscape. Besides structuring the application landscape, firms also wanted to keep an overview of the costs, the quality and other aspects of the applications. The structured analysis of information about the application landscape is called Application Portfolio Rationalization (APR) [2, 6]. This paper gives an overview of APR. In the next chapter we define APR extensively. Thereafter, the business case of APR is explained. The fourth chapter describes different APR methods that are described in scientific literature, shows their similarities, and describes a general APR method. Chapter five presents an APR case from real life to illustrate the method.
2. Defining APR Some researchers called APR: ‘Assessing the health of an Information System (IS) applications portfolio’ [7], ‘Redesign of the IS portfolio’ [8], or ‘Enterprise IT portfolio management’ [9]. All terms refer to the following elements: • Applications: Pieces of software that logically can be seen as a system, with data input, data processing, and data output [1]. • Portfolio: A set of applications in a given organizational scope, e.g. a whole enterprise or a business unit. This term refers to the reason why rationalization should be done: if the portfolio gets too complex, you need rationalization. • Rationalization: The activities that are applied to reduce portfolio complexity. Sarissamlis [6] defines APR as: “An evolutionary process that involves the continual application assessment to respond to business process changes, improve application usability and reduce the total cost of ownership.” The different parts of this definition address some important aspects: • Evolutionary process: Getting a clear application landscape is something which cannot be executed immediately. It costs time and money.
• Continual: APR is something which should be applied continuous, to keep the portfolio structured. • Application assessment: The core of APR is the gathering of information about applications. • Respond to business process changes: APR is a process that should be done by the IT department and the rest of the business together. • Improve application usability: The short-time goal of APR is to improve the usability of all applications for both end users and IT maintenance. • Reduce the total cost of ownership: The longterm goal of APR is to reduce the overall costs of the applications portfolio. In next section, this will be explained.
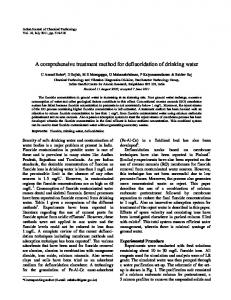
3. The APR business case According to Wegen and Hoog [10], the main goals of organizational investments are to increase their market share by improving the time to market, reducing lead times, or increasing the quality of products or services. They state that improving the applications portfolio would contribute to those goals. This is caused by the improved usability as stated in previous section. Decreased maintenance costs, decreased costs of running the applications and decreased costs of major modifications decrease the overall cost of the IT department. Indirect costs are decreased by less labor time that is spent on applications and by lower risks with regard to the continuity of an organization [7]. Swanson and Dans [11] researched the relation between portfolio complexity, system age and system size on the one hand, and maintenance effort and life expectancy on the other hand. An overview of the significant relations is shown in figure 1. Increased portfolio complexity goes hand in hand with increased maintenance effort. Increased maintenance effort increases the overall life expectancy. An organization that wants to reduce its portfolio complexity will therefore have to find a balance between investing in maintenance of the applications, which prolongs the life expectancy, and investing in new applications (and hence getting a new life expectancy). The main goal of APR is to find this balance, by establishing an overview of all information about the applications that needs to be taken into account for a making a right decision.
Figure 1. Significant portfolio relations [11]. Is there proof that the organizational performance is positively influenced by an APR? Some researchers have concluded that an IT investment will lead to positive organizational results. Other researchers showed a neutral, sometimes negative, effect. Weill and Vitale [7] therefore conclude that the main benefits of APR will not be caused by whether or not it is applied: the question is not ‘if’, but ‘how’ APR is being applied. This is why next chapter explains how to perform APR.
4. The APR method Two main APR methods are mentioned by Weill and Vitale [7] and Sarissamlis [6]. Roughly, those methods can be divided into an assessment, evaluation and planning phase. This is explained by an overview of the steps and corresponding categories that is given in figure 2. This figure also depicts the APR method that will be described in this chapter: general activities that are mentioned by Weill and Vitale, Sarissamlis and other researchers (i.e. [2, 8, 12]).
Figure 2. An overview of different methods from literature and the APR method.
4.1. Assessment
the employees of the organization, even if they cost a lot of money to procure or a lot of time to maintain.
The assessment phase is focused on both the individual applications and the complete set of applications (i.e. the portfolio). The main goal of this phase is to gather and depict all information about the application portfolio. This information will be used in the evaluation and planning phase. This phase is sometimes called ‘Application Portfolio Survery’ (APS), since the real rationalization takes place in the next phase. Before assessing the applications, the scope of the APR must be set: which applications will be analyzed? What can these applications do, and where are they mainly used in the organization? APR is focusing on applications: the scope will therefore be on rationalizing applications, and not IT processes, data or infrastructure. Is this what the organization wants? One way to depict the scope is by matching visually the applications with the processes that are performed in an organization. The application overlay in an enterprise architecture which combines applications and business processes is a useful tool for this purpose [13]. Groot et al. [8] also propose a tool to depict the applications. Their focus is on technical data. They describe a ‘picture approach’, where one picture of the complete organization is taken, and other pictures are ‘zoomed’ in on the enterprise picture. An organization has to choose whether it prefers to use a more technical [8] or a more process oriented [13] approach. The advantage of the technical approach is that all details can be depicted, which unfortunately makes it more difficult to use for communication purposes with higher management.
Investment value Nevertheless, the investment that has been done in an application also determines some of its value. The upfront provision costs of an application, operational costs, and maintenance costs are a measure that can be used to compare the value of applications in an objective way [7]. Besides these direct costs, indirect costs of the amount of time used by the application need to be taken into account. Applying the method of activity based costing can help to get an overview of all indirect costs of applications [10].
4.1.1. Assess applications The main question that needs to be answered in this activity, is: What is the value of each application? To clean up a portfolio, an organization needs to know which applications are useless or useful. Useless applications are not valuable: they increase the portfolio complexity and cost money. Weill and Vitale [7] propose to split ‘value’ up into five elements:
Management value If an application contributes to managerial tasks (planning, investigating, coordinating, evaluating, supervising, staffing, negotiating, and representing), it is highly valuable for a manager. Since a manager’s main goal is to execute the organizational strategies, this application is also highly valuable for the organization. Some applications have value for a manager, but this value is indirect: they provide information to subordinates, which in their turn help managers by performing their activities. This should be kept in mind while assessing management value.
Value for the business unit Each organization, business unit or department has its own business goals. Not only employees, but also applications contribute to those goals. Each application can be used for specific tasks, and therefore contributes to certain goals. The IT department contributes to the organizational goals by maintaining and procuring the applications. Both the IT goals and the organizational goals of management need to be aligned [14]. If this is not the case, the applications will not be seen as valuable by
Technical value This type of value looks at the technical quality of the applications. Applications with low source code quality, low data quality and reliability, low system reliability, low portability, or low output quality will cost extra maintenance work and will therefore be less valuable [7]. Value of use Usability aspects also need to be looked at. Nielsen [15] states that usability consists of multiple components: learnability of the application, efficiency of use, memorability of texts and use, amount of errors made by users, and satisfaction of the user. Each component can be assessed by users, in order to determine the value of use. One other way to assess this value, is to look at the level of use of all applications. This is a behavioral indicator of the usefulness of a specific program [7]: if an application is useful, it will be used more than a program that is not useful.
4.1.2. Categorize applications The application portfolio can be made visible by depicting the applications on certain dimensions. Some technical dimensions on which applications can be categorized, are: shared business process contribution, common functionality, shared infrastructure, shared data(base) use, and technological relationship such as programming language [6]. These dimensions are technically
oriented, and are useful in evaluating applications when a specific business decision is made, for instance to remove all applications that are written in an old programming language. If there is not yet a decision made, each application can be evaluated on its value, as determined in the assessment. Ward [16] has looked at all dimensions that were used to depict the value of applications. In Figure 3, they are depicted. Ward found that the vertical dimensions of all researchers referred to the “potential contribution of an application in achieving future business goals”. They looked at the future value of each application (Figure 4). In previous section, this was defined as management value: in what way does an application help the manager to reach his future goals? The horizontal dimensions looked at the current value of an application: the “degree of dependence of the business on an IS/IT application in achieving overall business performance objectives” (Figure 4). Technical value, value for the business unit, or value of use contribute to this dimension. Weill and Vitale [7] used this classification in order to depict all kinds of value. They chose to depict
management value on the vertical axis. For the horizontal axis they selected the technical quality. In order to depict all aspects of value, the other three were depicted as size, color or number for each application. An example of a ‘health grid’ that is the result of depicting these dimensions, can be seen in Figure 5.
Figure 5. A ‘health grid’ example This way of categorizing and depicting the applications helps to get a complete overview of the portfolio, which helps to select applications that do (not) contribute to the value of the portfolio.
Figure 3. Categorization matrices examined by Ward [16]
Figure 4. The combined matrix of Ward [16]
4.2. Evaluation Both the value assessments and the technical aspects need to be evaluated. The value assessments help to locate opportunities for portfolio reduction, whereas the technical assessments help to reveal the cause of this situation. Before an evaluation starts, the categorization and the results of the assessment need to be reviewed with managers of the different departments [7]. This prevents a bias that can exist at the (IT-)employees who perform the APR. 4.2.1. Evaluate application/category The matrices give a good start for analyzing the applications in a portfolio. While analyzing the health grid such as the one presented in Figure 5, the following rules can detect portfolio problems: • An application has a high management value and low technical value. • Technical quality is high, but an application is not recognized as valuable by management, the business unit, or the users. • Large investments are made in new software, but the applications are not seen as valuable by management or users. • An application has a low value on all dimensions. Each organization has to create its own rules that indicate when action needs to be taken. 4.2.2. Evaluate underlying patterns Besides evaluating the problems, an organization should also evaluate how these problems were raised in the past, and learn how to prevent future application complexity. The following subjects should be analyzed: Business strategy One cause of the portfolio problems can be a lack of alignment between the IT strategy and the business strategy [14]. If the IT department did not recognize the business strategy, management value or user value can differ from technical quality and investment. IT strategy It is important that the IT department looks at the long term, by determining goals and strategies: the employees should not spend all their time on ‘keeping everything running’ [4]. Enterprise architecture Besides aligning the business strategy and the IT strategy, an IT department also has to align the applications with the processes that take place in the organization. Enterprise architecture modeling helps to get an overview of the organization [13].
Culture Norms and values in the IT department influence portfolio complexity. A culture where all actions need to have benefits on the short term will probably cause quick introductions of new applications and prevent the clean up of legacy systems [17]. Communication patterns Improved communication leads to higher organizational performance [18]. This is also the case for communication between IT and other departments. If for instance an IT manager and a sales manager lack to communicate regularly, this can lead to applications that do not fit the sales organization. This decreases application value and increases portfolio complexity.
4.3. Planning In order to reduce the assessed and evaluated complexity of the portfolio, a planning needs to be made that consists of actions, money and time. 4.3.1. Determine actions Actions need to be determined by using the results of the evaluation. A company can decide to discard (parts of) applications, replace them, redevelop them, or invest in new applications. Actions can also be taken for all applications in one (technical) category [6]. If some applications are classified as having a low technical quality, and are also classified as having an uncommon programming language, a company can decide to redevelop all applications in that language to a more common one. Some process actions should also be taken. Regular meetings between IT management and line management can be started. An IT strategy can be created. The processes of the organization can be analyzed and depicted [13]. The planning of a rationalization of the physical infrastructure and the architecture also helps to reduce complexity [19]. Organizations also need to make time available for keeping a clear overview of all applications by regularly executing an APR. This prevents a comeback of the earlier situation. 4.3.2. Allocate resources An organization has to decide about the budget that is available for the actions of previous section. Some applications immediately require money. Other applications will need money in a few years. Because the effect of short term investments is more visible, manager often tend to allocate all budget to those activities. Mårtensson [12] states that an organization should not only focus on short term payback. Investments have to be made for opportunities that add future value, too. A successful investment should meet both goals (future and
current) and both perspectives (short term and long term) as depicted in Figure 6.
applications, technical software, software development tools, and personal desktop tools. The technical and functional value of all applications was assessed, too. An overview is given in figure 8.
Figure 6. Dividing resources [12] 4.3.3. Make a time-plan For time planning, Figure 6 can also be applied. During the planning, the already described relationships of Swanson and Dans [11] in figure 1 need to be kept in mind. Actions that are taken will influence the life expectancy and maintenance effort of those and other applications. Therefore, an organization not only needs to plan the actions: it also needs review the regular time and budget plans for all applications.
5. Case example A financial services company decided to analyze the application portfolio because there was a general feeling that the application landscape had become very complex. The main questions were: has the application portfolio become too complex? What are the risks for business continuity? Would the achievement of business objectives be difficult due to this complexity? And would the costs of IT still be in control? A surprising result from the preparation phase was that the total number of applications turned out to be much higher than originally was thought. This was caused by the extensive usage of spreadsheet and groupware based applications. Applications which were based on groupware, reporting or spreadsheet software and that did not play an important role in a business process, were not investigated in detail. In total 900 applications were found, of which 334 were assessed in next phase. For each application or component, approximately 40 characteristics were gathered, such as information about functionality, ownership, usage, architecture, functional quality, technical quality, platforms, interfaces, lifecycle and service management. Furthermore, the applications and interfaces were mapped on the business processes and the infrastructure. To characterize the purpose of the applications, the applications were categorized into: business
Figure 7. Analysis of the functional and technical quality A lot of applications (70%) were custom-made or customized. Although the company had developed an infrastructure architecture, only 9% of applications was positively known to fit the architecture. From the assessment (Figure 7) the organization concluded that the technical quality was generally insufficient. Comparing it to a similar analysis of the previous year (the two black lines in figure 8), the technical quality had deteriorated while maintenance costs had been equal. This indicated complexity. These and other results of the analysis were compared with business demands, which were high because of the information intensive character of the business as well as regulatory requirements. It was concluded that the company was no longer in control of the application portfolio complexity, resulting in unacceptable risks for business continuity and rapidly increasing IT management costs. Time and budget was created to reduce complexity, develop an enterprise architecture to guide development and reorganize the IT governance.
6. Conclusions and further research During this research, the authors concluded that there is not much scientific research available about APR. The available knowledge was combined in this paper, to show the main steps of a general APR method. The real life case illustrated that the APR steps are also taken in practice. The APR method helps companies to get a better overview of APR. This paper emphasized on APR methodologies that are available in scientific literature. The case illustrated the usefulness in practice, but real practical suitability is not yet proven. In future research, a mapping of APR methods that are used by (consultancy) companies helps to validate and improve the APR method.
7. References [1] Daft, R.L. (1998). Organizational theory and design. West: International Thomson.
[11] Swanson, E.B. and Dans, E. (2000). System life expectancy and the maintenance effort: exploring their equilibration. MIS Quarterly, 24-2, pp.277-297. [12] Mårtensson, A. (2006). A resource allocation matrix approach to IT management. Information Technology Management, 7, pp.21-34. [13] Koning, H., Bos, R, and Brinkkemper, S. (2006). A Lightweight Method for the Modeling of Enterprise Architectures: Introduction and Emperical Validation. UU-CS Report 2006-003, Department of Information and Computing Sciences, Utrecht University. To appear in: Enterprise Modeling and Information Systems Architectures – International Journal. [14] Venkatraman, N., Henderson, J.C., and Oldach, S. (1993). Continuous strategic alignment: exploiting information technology capabilities for competitive success. European Management Journal 11 (2). [15] Nielsen, J. (1993). Usability engineering. San Diego: Academic Press.
[2] Dullemen, J. van, Teunissen, R., and Venn, P.J. van de (2006). Applicatie Portfolio Rationalisatie. Atos Consulting.
[16] Ward, J.M. (1988). Information systems and technology application portfolio management – An assessment of matrix-based analyses. Cranfeld school of management.
[3] Turban, E., McLean, E., and Wetherbe, J.C. (2002). Information technology for management: transforming business in the digital economy. New York: John Wiley & sons.
[17] Merchant, K.A. and Van der Stede, W.A. (2003). Management control systems. Performing measurement, evaluation and incentives. Essex: Pearson Education.
[4] Ward, J.M. and Peppard, J.W. (2002). Strategic planning for information systems. Third edition. Sussex: John Wiley & Sons. [5] Irani, Z., Themistocleous, M., and Love, P.E.D. (2003). The impact of enterprise application integration on information system lifecycles. Information & Management, 41, pp 177-187. [6] Sarissamlis, S. (2006). A sea of applications: portfolio rationalization. Nautilus Research. [7] Weill, P. and Vitale, M. (1999). Assessing the health of an information systems applications portfolio: an example from process manufacturing. MIS Quarterly, 23-4, pp.601624. [8] Groot, R., Smits, M., and Halbe, K. (2005). A method to redesign the IS portfolios in large organizations. Proceedings of the 38th Hawaii international conference on system sciences. [9] Kwan, S.K. and West, J. (2004). Heterogeneity of IT importance: implications for enterprise IT portfolio management. San José: State University. [10] Wegen, B. van and Hoog, R. de (1996). Measuring the economic value of information systems. Journal of Information Technology, 11, pp.247-260.
[18] Jashapara, A. (2004). Knowledge management - an integrated approach. Essex: Pearson Education. [19] Dullemen, J. van, Bussemakers, L., and Droppert, J. (2006). Hoeveel complexiteit kun je verdragen? Tiem 15, September 2006.