Short Paper: A Method for Discovering Functional Relationships Between Air Handling Units and VariableAir-Volume Boxes From Sensor Data Marco Pritoni1, Arka Bhattacharya2, David Culler2, Mark Modera1 1
2
University of California, Davis University of California, Berkeley
[email protected] [email protected] [email protected] [email protected] and lighting. These large sensor deployments are cyber-physical systems with thousands nodes.
ABSTRACT In Building Automation Systems contextual information about sensors is frequently missing or hard-coded in the control code. Retrieving this data is time consuming and error-prone, but necessary to write any type of control application. Automating metadata acquisition is a new and active area of research. Methods to infer metadata from sensor labels or from recorded data have been previously proposed. However, these methods are ineffective in uncovering the association between HVAC components. In fact, measured variables (pressures, temperatures, flows, valve positions) have slow and attenuated responses to changes in input variables, thus impairing the efficacy of correlation methods. In addition, sensor readings are frequently constrained between physical limits and kept around setpoints by nested control loops. For this reason, pure statistical methods fail to capture the differences between sensor streams and are unable to classify them. In this article, we propose a new method for discovering functional relationships between Air Handling Units and Variable-Air-Volume Boxes from sensor data. The method utilizes perturbations of subsystem variables, while guaranteeing that the building zones remain within comfort boundaries. When applied to an existing building, our proposed method reveals correct associations in ~80% of the cases, and outperforms other methods.
Categories and Subject Descriptors C.3 [Special-Purpose and Application-Based Systems]: Process Control Systems
General Terms Algorithms, Measurement, Verification, Design.
Performance,
Experimentation,
Keywords Correlation, Clustering, Perturbation, System Identification, Modeling.
1. INTRODUCTION AND MOTIVATION Energy efficiency in the buildings sector offers great potential for cost-effective emissions reductions. We spend ~90% of our time in buildings, consume ~75% of total electricity, representing nearly half of our primary energy consumption, and generating 45% of our CO2 emissions [1]. In large commercial buildings, traditional digital control systems regulate the majority of the energy use, particularly HVAC systems, which we focus on here, Publication rights licensed to ACM. ACM acknowledges that this contribution was authored or co-authored by an employee, contractor or affiliate of the United States government. As such, the United States Government retains a nonexclusive, royalty-free right to publish or reproduce this article, or to allow others to do so, for Government purposes only. BuildSys '15, November 04 - 05, 2015, Seoul, Republic of Korea Copyright is held by the owner/author(s). Publication rights licensed to ACM. ACM 978-1-45033981-0/15/11…$15.00 DOI: http://dx.doi.org/10.1145/2821650.2821677
Software applications have been recently developed to optimize energy use, improve comfort, and identify faults for these systems [8, 9, 10, 11, 12]. For all these applications to be implemented, detailed information about sensors’ context is required. Unfortunately, such information is very difficult to obtain, because it is either embedded in the building automation system (BAS) or non-existent. Current efforts in automatic metadata acquisition include two different strategies: extrapolating metadata from labels (e.g., BACnet point names), and inferring them from sensor readings. Recent work has just started exploring the latter approach. Fontugne et al. [2] proposed a method to correlate inter-device user patterns by extracting traces of occupancy from electrical energy use. Koc et al. [3] compared correlation methods to infer spatial relationships between discharge and zone temperature sensors in different rooms of a building. Rajagopal et al. [6] developed a method for using LED frequency modulation and smartphones cameras to establish a relationship between fixture and occupant location. Despite these efforts, many issues remain unresolved. In particular, we set out to devise a method for inferring functional relationships between HVAC components, as lack of this information precludes the adoption of common energy efficiency strategies (e.g., resets). This paper explores an instance of this problem (on purpose this is a very difficult case to solve). The example is specific to a particular building, but technique and considerations are generalizable to many other buildings. Indeed, the majority of the US large commercial buildings have some variation of these systems installed.
2. TESTBED We analyze data from a large commercial building with 3 chillers, 4 air-handling units (AHU) and 179 thermal zones. A variable air volume (VAV) box modulates the airflow from the AHU to each zone. One AHU is associated to multiple VAVs. VAV modulation is achieved through a combination of two control actions: adjusting the air damper position (DMP) and regulating the local reheat valve (RVP) (Figure 1). The temperature in each zone (Tzone) is influenced also by the supply air temperature (Tsa) and flow (FLWsa) coming from the AHU. All these points are monitored and recorded by the BAS, and represent the datasets used here. In addition, the room temperature is impacted by uncontrolled variables, such as weather (Toat is the outdoor air temperature), internal gains, and other thermal gains. This configuration is typical of a large number of buildings. The association between AHU and VAV is not stored in the BAS; however, for the purpose of the experiment, ground truth association was collected to verify the results of the proposed method. This paper explores different methods to discover the
functional relationship (i.e., the association) between the VAV box and the AHU that provides air to it. AHU# v=[Tsa#,#FLWsa]AHU## VAV# zone#
VAV# zone#
Tsetpoint## +#_#+#
w=[Toat,#gains..]#
u=[DMP,#RVP]## C#
zone#
Tzone##
VAV#Control#Logic#
Figure 1. AHU and VAV configuration. On the right, the VAV control logic is represented. Tzone is kept around the Tsetpoint by the control outputs u=[DMP, RVP]. Tzone is also influenced by parameters controlled by the AHU (v=[Tsa, FLWsa]AHU) and external disturbances w=[Toat, internal gains …].
3. RESULTS WITH EXISTING METHODS Techniques commonly employed to detect relationships in data streams include: correlation of raw data [3], correlation of transformed data [2], principal component analysis (PCA) and clustering [4,7], statistical process control [12], and model-based system identification (i.e., building a model by looking for the best fit from a single VAV and alternative AHU data). Preliminary analysis of the building dataset tested conventional correlation methods to find relationships between AHU and the corresponding VAV boxes. Table 1 shows an example of these coefficients. Results show very poor correlation. Desired values inside the bold boxes should be higher, in absolute value, than the corresponding values in the other rows. This method is able to correctly classify only 38% of the zones (Table 3). The same test was repeated with data resampled at 5 min, 15 min, and daily, yielding similar results. Table 1. Correlation matrix (showing raw data from two AHU and two VAV boxes). Data from May 28 to July 14 2015, resampled at daily rate. Example VAVAHU2 Example VAVAHU4 Tzone DMP RVP Tzone DMP RVP AHU 2 Tsa -0.06 0.06 0.11 -0.11 0.24 0.29 AHU 4 Tsa -0.20 -0.19 -0.06 -0.04 -0.01 0.02 In contrast to prior research monitoring energy consumption [2], the variables measured in this test are pressures, temperatures, flows and actuator positions, which show delayed and attenuated responses to changes in input variables, thus reducing correlation. Further, AHU and VAV boxes/zones are physically distant (differently from [3]), and variables in the latter are significantly influenced by additional measured and non-measured disturbances (Figure 1). For this reason, sensor values show a small signal to noise ratio. In addition, sensor readings are frequently constrained between physical limits (e.g., max damper position) and kept around setpoints by nested control loops. Also, cross-talk between systems (i.e., zones might influence each other) and similarity in the way different AHU are controlled (setpoints and daily behavior are similar) make correlation of raw data ineffective. Next, we constructed feature vectors for the data of each VAV. Features included were: Tzone, DMP, RVP, Tsetpoint, flow setpoint (FWS), day of the week, time of the day. PCA was applied to these feature vectors to identify the two principal components and
correlate them to the Tsa. Unfortunately, results of this analysis are not very different from what obtained with raw data (Table 2 and 3), yielding to 32% correct classifications. Table 2. Correlation matrix (showing 2 principal components of VAV data and two AHU). Data from May 28 to July 14 2015. Example VAVAHU2 Example VAVAHU4 Eig1 Eig2 Eig1 Eig2 AHU 2 Tsa 0.12 0.12 0.20 0.09 AHU 4 Tsa -0.12 -0.15 -0.04 -0.05 Finally, we tested a completely different and novel approach involving system identification (SID) techniques, which are used in control engineering to find a mathematical relationship (model) between input and output variables in an observed system [5]. A physics-inspired black-box dynamical model was constructed to predict Tzone, based on the available sensor data: !!! !"# 𝛽!! 𝑅𝑉𝑃! + 𝛽! 𝐹𝐿𝑊! ∙ 𝑇!",!
𝑇!"#$,! = 𝛽! 𝑇!"#$,!!! + 𝐹𝐿𝑊! ∙ + 𝛽! ∙ 𝑇!"#,!
!
where variable names are defined above, 𝛽! are the statistical coefficients, and t stands for time. The equation is in the form of an autoregressive time series model with exogenous inputs and interactive effects (some variables are multiplied). The term with the sum represents the lag in the effect of the reheat valve. The model is based on detailed physical knowledge of the heat transfer processes in VAV boxes. Note that all the variables in this !"# equation belong to the VAV with the exception of (𝑇!",! ), that represents the supply air temperature controlled by the AHU at !"# time t. The idea is that using the 𝑇!",! from the AHU actually connected to each VAV would improve the model fit. Both linear regression and lasso [13] were used to fit the model over 15-min resampled data. While the model fit the data very well (R2=7695% depending on the zone), it failed to capture the difference in !"# AHU. Plugging in different 𝑇!",! did not change the fit of the model as we had expected. Classification results are presented in Table 3. We reasoned that the main cause of this is that the majority of the variation in the output variable 𝑇!"#$,! is captured by the first term of the model (zone temperature at the previous time step) and the remaining 𝛽! coefficients are relatively small. !"# With the calculated coefficients, the input variable 𝑇!",! would have to change by more than 20 °F to produce measurable effects in the output variable. Such large temperature differential never occurs spontaneously in our recorded data, and if artificially produced would seriously compromise occupants’ comfort. Nevertheless, this prompted us to explore the idea of actively perturbing the building to measure system response.
4. NEW METHODOLOGY The concept underlying the proposed methodology is that by arbitrarily perturbing an AHU we can generate a distinguishable signal in the connected VAV boxes. In practice, by changing dramatically the supply air temperature in an AHU (input), the VAV box will respond by changing some controlled variables (reheat and damper position) to maintain the temperature setpoint. However, if despite saturation of actuators (damper or reheat valve completely open or close) the system cannot keep up with zone cooling/heating load, the zone temperature (Tzone) will be affected and change. The AHU supply air temperature was chosen
Table 3. Percentage of correctly classified VAVs using different methods
Correctly classified VAVs
Random
Correlation Raw
Correlation PCA
SID
25%
38%
32%
32%
over the AHU flow rate as it is practically easier to tune. Also significantly perturbing flow rates might provide insufficient ventilation or damage the ducts due to high pressure. During the experiment, care was taken in ensuring that the perturbation had no impact on occupant comfort. To do so, while creating an overall large perturbation, the temperature setpoint for the supply air in the AHU was set one day to 52 °F (cold mode) and the following day to 60 °F (hot mode), whereby the normal setpoint for a week-day was 57 °F. Since thermal systems have a significant response lag, the perturbation was sustained for a full day in each mode. To reduce the noise in the data, knowing that VAV variables have little correlation with time of the day (result found while using the other methods), we resampled the data in daily intervals. Average daily values for RVP, DAM and Tzone are still meaningful indicator of system behavior. The algorithm took the following steps: 1. Perturb one AHU at the time for two consecutive weekdays, one day in cold mode and one day in hot mode. 2. Collect data for each VAV for the following sensors: RVP, Tzone, DAM. 3. Re-sample data to obtain daily averages. 4. For each daily average, label the data as belonging to a baseline weekday (WD), cold day, or hot day, for each perturbed AHU (e.g., ColdAHU2 means cold period for AHU 2). Each VAV data stream will have periods for all AHU perturbations. 5. Standardize each stream of data to have mean = 0 and standard deviation = 1. 6. For each VAV and each period combine data into average daily vectors of the form [RVP, DAM, Tzone]. 7. Filter out vector elements that show a response value with opposite sign compared to physical intuition (e.g., a cold perturbation that reduced reheat). 8. For each VAV and each couple of AHU perturbations, calculate the Euclidian distance between hot and cold vectors. At the end of this step, each zone will have a metric for each AHU perturbation difference (hot – cold). 9. For each VAV take a vote to select the AHU whose perturbation has a highest metric (produced a larger difference in sensor vectors). The AHU selected with this method is expected to be associated with that VAV box. One important intuition here was that evaluating a metric for each VAV box across all the perturbation periods (voting) would provide better results than assigning the zone to an AHU for each perturbation (independent classification), as discussed below.
5. RESULTS AND DISCUSSION The proposed methodology was applied to the building explored with the other methods. The method correctly identified the relationship between VAV box and AHU in 79% of the cases.
5.1 Misclassifications There were three main groups of zones that were incorrectly classified: (1) VAVs that showed no response to any perturbation, (2) VAVs that had an unexpected behavior, such as counterintuitive responses to perturbations, (3) VAVs that responded more strongly to the perturbation of the ‘wrong’ AHU.
Perturbation + Voting 79%
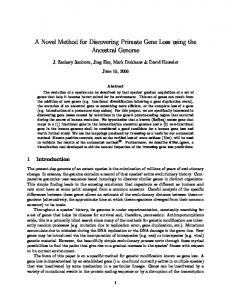
As an example of group (1), zone 308 (not shown here for brevity) presents a very tight distribution of variables, as DAM is at its minimum, and daily average RVP changes very little during all the periods. Further analysis of this case reveals very frequent oscillations (about 20 cycles per day) of RVP ranging between 0% and 40%. It is very likely that the control loop is out of tune for this zone. This might be the reason why the perturbation has no visible effect on the data. Among the zone exhibiting counterintuitive responses to perturbations (group (2)), zone 461 shows a very wide distribution of points (Figure 2). The zone seems subjected to large unmeasured disturbances. Some baseline weekdays reach max RVP (~100%), while others use only a fraction of reheat (2035%). These unknown factors probably had a larger effect compared to the perturbation, causing the zone to be misclassified.
5.2 Independent classification vs. voting Adopting a voting system compared to scoring each perturbation individually increases accuracy and precision (with one exception), as illustrated in Table 4. In addition, the classification of each AHU individually, based on its corresponding perturbation (Pi is the perturbation to AHUi), requires defining a threshold to compare the calculated metric to. Choosing the right threshold is challenging and hard to generalize. In Figure 3 each line represents a VAV box sorted by ground-truth AHU, while each column represents a perturbation of an AHU. The color in each cell is shaded proportionally to the value of the calculated metric, normalized by column. Darker colors represent higher metric values that correspond to stronger relationships between the VAV box and the perturbed AHU. It is clear from the figure that each perturbation produces responses in multiple VAV boxes, some of which are not associated with the correct AHU. Choosing a threshold corresponds to choosing a minimum shade of grey that triggers the association with the AHU currently perturbed. Further, Figure 3 shows that perturbations 2 and 4 (in column) require a very different threshold to correctly classify the corresponding VAVs. In contrast, Figure 4 illustrates the clearer heat map generated with voting. Dark areas are more clearly defined, and it is also visually easier to identify which VAV boxes are associated to the AHUs. Furthermore, if a zone is classified in different ways under separate perturbations (e.g., belonging to two AHUs) then the classification conflict needs to be resolved. When a voting system is adopted, a zone is classified univocally. Table 4. Comparison of accuracy / precision of the voting method and the independent scoring method for each AHU Accuracy/ Precision AHU 1 AHU 2 AHU 3 AHU 4
Independent classification Threshold Threshold =0 = 1 SD 39% / 31% 78% / 60 % 35% / 16% 92% / 63% 22% / 17% 83% / 48% 48% / 45% 88% / 85%
Voting Max Value 85% / 77% 94% / 77% 92% / 69 % 86% / 85%
In this paper we present a novel algorithm to infer relationships between HVAC components of large commercial buildings. We show that due to the characteristics of the data (response lags, nested control loops, tight variable boundaries) other common techniques are not effective in this context. The new algorithm utilizes perturbations of AHU variables and guarantees that the building zones remain within comfort. The method was applied to an existing building and could identify the relationship correctly in 79% of the cases. There are three main directions of research we would like to explore in the future. First, we would like to explore how our technique generalizes to other buildings, where zones may have different sensors, setpoints, and control loops. Second, we would like to explore whether we can discover relationships between subsystems like AHUs and VAV boxes without having to introduce a large perturbation to the AHU. We may be able to utilize milder perturbations like daily occupant cycles, and techniques from statistical process control to infer the same relationships. Finally, a useful future direction of research is to quantify the amount of cross-talk between zones. The heat exchange between zones with common doors, passageways, etc. introduces errors into any single-zone heat exchange analysis, and its identification and quantification could lead to more efficient and better designed control loops.
7. ACKNOWLEDGMENTS This work has been supported in part by the National Science Foundation under grant CPS-1239552, CNS-0931843 (Action Webs) and Intel. We would like to thank Miguel Sanchez, Jacob Cabrera and Ian Hurd, for their help coding some of these analyses, and Harry Stark, for allowing us to run experiments in the building. [1] Deparment of Energy (DOE), 2010a, Buildings Data Book Chapter 1, http://buildingsdatabook.eren.doe.gov/ChapterIntro1.aspx. [2] R. Fontugne, J. Ortiz, N. Tremblay, P. Borgnat, P.Flandrin, K. Fukuda, D. Culler, and H. Esaki. 2013. Strip, bind, and search: a method for identifying abnormal energy consumption in buildings. (IPSN '13). DOI=10.1145/2461381.2461399
P1
P2
P3
P4
AHU1
P4 0.022114646 0.614940779 0.514230714 0.627325659 1.169521397 1.444228393 0.113422071 0 0.087717229 0.001387439 0.015580728 0.985520494 0.883915532 0 1.247500624 0.393753803 0.550872508 1.264331942 0.163289567 0.026871097 2.608033262 0.737300037 1.538297274 1.498579184 1.593524407 0.374538937 0.396522028 0.654657683 0 1.346869978 0.49991231 0.187476945 0 0.564282174 0.000455445 1.115301524 0.350327021 2.793583757 0.957128655 0.154528488 1.129177974 0.570681653 0.681752707 0.04627894 0.143373661 1.441171127 2.326027291 0.927543858 1.39545272 0.744286765 0.392012076 2.165370272 0.580362671 2.643766086 0 0.94048667 1.959286273 0.450465748 2.076006779 1.361026403 0.91042655 0.122489526 0.84844088 0.004656499 0 0.185336478 2.441636515 0.28028118 1.508298518 1.861876955 0.360825777 0.518767373 0.802982257 0.264685599 2.272261507 0.508295649 0.242030331 2.187934769 0.284208944 1.320500533 0 0.593213199 0.018362118 0.55264061 0.5806064 2.487002722 0.240889941 0.776594543 0.323062292 0.422661174 0.235849522 0.214021475 0.07169235 0.475342459 1.180405031 0.966384327 0.65014659 0.373150159 0.15634032 0.433390937 3.115134888 2.678860474 3.83170244 4.922420715 4.399597291 4.501204171 4.854544314 3.979616338 3.122511269 3.200458789 5.818112625 4.647164892 3.925835404 5.103748971 1.696539477 3.009559838 2.259922706 5.045036145 0.620545542 4.648498509 2.808320541 5.72560944 2.843319068 2.284129011 3.952465459 4.510993343 2.54792585 1.076858241 4.769823124 4.868148764 1.516187715 5.132831684 5.526248042 4.04670407 6.19381644 4.604728847 3.649997519 4.648073221 4.547959761 2.884440097 4.254064861 2.852082446 6.24532181 3.113602365 4.379531491 0.194822469 3.910883187 5.893575251 6.067890503 1.791817929 1.970195936 3.727250298 1.736122393 5.832029028 3.068098457 3.857937954 3.124663604 1.982124884 2.932822432 2.911912478 6.653226813 5.67106848 4.872873226 3.948010036 4.756857857 2.33502924 3.466746162 4.862894279 0.705103556 0.887968653 2.77499977 1.554354735 2.821418716 3.209417547 3.123808929 1.287951916 1.206425019
AHU3 AHU2
P3 0.48682988 1.27407674 0.04281237 1.11288006 0.4266787 0.16590794 0.7625156 0.27362912 0.21292827 0.22119271 1.57031367 0.09475446 0.27852465 0.43571032 0.44681241 1.42890838 0.51055064 0.19898615 0.33193516 0.18058552 0.71062076 0.90715187 0.21665624 0.04050859 0.10239299 0 0.46262113 1.86006714 0.94158422 0.25311533 1.59721869 1.26045801 0.49443114 0.16012551 0.57457035 0.40642817 0.81324802 1.1908106 0.08752469 0.30953036 0 0.40477135 1.08485083 0 0 0.20752887 2.16448572 0.27835098 0.48848539 0.02492752 2.61383841 1.47305963 0.74715892 2.60470309 0.10130429 0.83308426 0 0.54071463 0.34779826 1.57037266 0.17654148 0.88526521 0.95140651 0.07858705 0.01323098 0.23928641 0 0.59448946 0.18931551 2.1730774 1.64016187 0.61951835 1.73792595 5.70400663 10.8358799 6.21628044 17.4513001 6.66471887 4.37184067 9.97254173 4.57557833 8.90364337 10.1182591 0.74180434 5.56731814 1.37585996 2.16644501 3.74901098 16.8769576 1.22309579 25.9330768 8.13734965 1.50276897 3.19201653 7.07347948 4.30562793 6.2166018 4.65275898 0.94927524 2.07858247 7.91108773 1.04239254 1.16235706 0.83229663 0.90714044 0.54285965 1.41372555 0.65567159 0.50791248 1.71426821 0.61972984 1.1410832 0.98826767 1.46881366 1.28283313 1.01109868 1.18124769 1.42044546 5.90125982 0.17434135 1.18699045 2.48905815 1.26309773 1.71168753 2.09113844 2.72405838 4.14940212 0.11134752 0.24887523 3.99409606 3.42933954 0.44592558 1.76493589 0.61603196 1.49850414 1.20803036 2.99550939 2.51686547 1.39453971 1.20266723 1.00753604 0.76967477 0.54951084 0 0.65422974 2.23017987 0.0497756 5.64424648 3.91860273 1.56153005 1.39849136 1.02483203 2.84696919 0.90326048 1.17836273 0.8227169 3.03156373 0.84149752 3.12057709 0.76668262 0.94050983 3.32065043 2.64081321 2.84360064 0 2.92716022 1.27588022 1.244597 0.30742792 15.1869383 1.28069918 0.13677169 1.16827924 0.28957914 0.00724957 0.65181101 1.54428917
Figure 3. Treating each perturbation as a stand-alone experiment.
6. CONCLUSION AND FUTURE WORK
8. REFERENCES
P2 0 0.43506886 1.41700831 0.09201191 1.20147605 0.2785416 0.11342207 0.2070536 0.0254621 0.89209805 0.98602227 0 0.55788876 0.06376422 0.14339884 1.43958122 0.01367939 4.49793233 0.54379091 0 1.97462622 0.13265379 0.31981645 1.33837654 0.02614203 0.63012572 0.74579534 0 0.31164654 0.61292393 0.95240813 0.45211188 0.01507245 0.42004049 0.31129846 0.07453877 0.86303187 0.99061405 0.93364424 2.11772236 0.93280295 6.02153058 0.04654544 0.09127018 0.62941929 1.81760461 0.66495718 2.20585633 1.00634791 0.49819099 5.18775773 13.0987027 4.8807287 50.3783032 4.01046133 1.77521894 4.26680576 5.25488482 7.76734883 5.75034758 0.94404197 2.47705553 2.56207258 2.92398074 4.42906323 4.49389687 2.01515467 3.41243761 0 0.87493936 1.89769478 0.81838888 2.1176107 0 0.41791745 0.06935348 0.79968203 2.11313898 0.374926 0.44330417 0.8712427 0 0.98072817 0.00611646 0.17667685 0.10823235 0.66151865 0.77865824 0 0.28549943 1.55649923 0.84741577 0.1805111 0 2.00959484 0 0.31207525 0 0.20168458 0.28263647 0.12179042 0.09390229 0.50803896 0.66221406 0 0.08784971 0 0.43184668 0.26645255 2.58352637 0 0 0 0.60709487 0.22907025 0.58238526 0.00791254 0 0.22750937 0 0.18900345 0.15323549 0.66773805 0.52295962 0 0.02700441 1.10690217 0.02560526 0 0 0.23664892 0 0.01513628 0.1019394 0 0.6848444 0.42464442 0 0.47450348 0.21828371 1.51920173 1.10462009 0.00458655 1.84421094 0.14685102 1.44808768 0.17261836 0.31507269 0.12278614 0.69106986 0 1.93271992 0 0.06492337 0.4503816 0 0.87440008 0.09508582 0.34542018 0 0.02500917 0 0.93622439 0.1437075 0.50117349 0.41169016 0.04849218 0
AHU4
AHU1 AHU3 AHU2 AHU4
Figure 2. Zone 461 incorrectly classified by the new methodology. Results projected in 2D.
P1 0.05210588 3.37155676 2.92783949 42.943818 0 0.53144227 9.72335414 0.41386949 1.47270259 3.69179382 9.02249457 5.45928016 5.80001973 1.82234086 18.670472 3.40619099 2.70694624 4.12146656 0.92888998 0.53115832 0.22492047 0.08284876 1.24509909 2.32489787 0.71499828 22.1056291 3.7680572 5.98257733 0.73259833 0.64891451 0.02117232 12.7461004 4.32616145 0.79407963 8.94116553 7.00444843 5.81932279 2.13664742 3.78233762 2.29683107 3.32083475 0.85766763 0.40020806 0.75827091 1.99060597 4.38189432 0.89395509 0.04776027 4.71375263 0 1.27466073 0.19093655 0 9.88185869 1.51018841 0.07523504 0.38017688 0 0.11580426 0.36184494 0.21407911 20.2999987 0.16709483 0.20435028 0.01691768 1.18257746 0 0.73487748 2.10615633 0.36343014 0.76370515 0.78507235 7.79789725 0 0.5929283 2.86432679 2.24412947 1.45026492 1.19017279 1.55704274 0.43702151 0.30460995 0.59382847 0.02299835 0.02365243 1.53803604 0.73984995 0.78986065 0.75217051 0.51613359 1.00806206 0.33207725 0 1.67388805 0 2.47830909 1.09740998 0 0.0379282 1.46460044 0.90980807 12.0184407 0.35443511 1.02361965 1.8144585 0.47987375 0.87296288 0.24123776 0.78776723 0.02651348 0 1.01094063 0 0.17277237 2.76169529 0.97383534 0 1.8601351 0.76606929 0.34965241 0 6.59311491 0 0.44504737 0.50544317 0.22520975 0.61297402 13.2406333 1.72232658 0.3567248 0.56153814 1.31852635 0.17750075 0.15490889 0.83114197 1.36552004 1.44799932 0 0.43071731 4.26597337 1.96149095 0.39744889 0.34514497 0.66572752 0 5.69174886 0.17551527 1.47443791 0.94892737 0.53699697 0 0.78348542 1.71048365 0.49183083 0.34206524 0 0.13025286 0 1.60565872 0.191653 0.08252843 0.97387805 0.14097543 1.82567181 2.02629744 0.47129494 4.56185201 0.32616351 0 0.59736403 0.70713975 0.78857215 0.13657128 0.65579828 0 0.02009808
Figure 4. Advantages of using a voting method.
[3] M. Koc, B. Akinci, M. Bergés. 2014. Comparison of linear correlation and a statistical dependency measure for inferring spatial relation of temperature sensors in buildings. (BuildSys '14). ACM, DOI=10.1145/2674061.2674075 [4] B. Narayanaswamy, B. Balaji, R. Gupta, and Y.Agarwal. 2014. Data driven investigation of faults in HVAC systems with model, cluster and compare (MCC). (BuildSys '14). DOI=10.1145/2674061.2674067 [5] L. Ljung. 1999 System Identification Theory For the User, 2nd ed, PTR Prentice Hall, Upper Saddle River, N.J., 1999 [6] N. Rajagopal, P. Lazik, and A. Rowe. 2014. Visual light landmarks for mobile devices. (IPSN '14). IEEE Press, Piscataway, NJ, USA, 249-260. [7] D. Hong, J. Ortiz, K. Whitehouse, and D. Culler. 2013. Towards Automatic Spatial Verification of Sensor Placement in Buildings. (BuildSys'13). ACM, New York, NY, USA, Article 13 , 8 pages. DOI=10.1145/2528282.2528302 [8] A. Krioukov, G. Fierro, N. Kitaev, and D. Culler. 2012. Building application stack (BAS). (BuildSys '12). ACM, New York, NY, USA, 72-79. [9] S. Dawson-Haggerty, A. Krioukov, J. Taneja, S. Karandikar, G Fierro, N. Kitaev, and D. Culler. 2013. BOSS: building operating system services. (nsdi'13), Nick Feamster and Jeff Mogul (Eds.). USENIX Association, Berkeley, CA, USA, 443-458. [10] T. Weng, A. Nwokafor, and Y.j Agarwal. 2013. BuildingDepot 2.0: An Integrated Management System for Building Analysis and Control. (BuildSys'13). ACM, New York, NY, USA, , Article 7 , 8 pages. DOI=10.1145/2528282.2528285 [11] P. Arjunan, N. Batra, H. Choi, A. Singh, P. Singh, and M. B. Srivastava. 2012. SensorAct: a privacy and security aware federated middleware for building management. (BuildSys '12). ACM, New York, NY, USA, 80-87. DOI=10.1145/2422531.2422547 [12] D. Wheeler, Understanding Statistical Process Control Paperback. 2010. SPC Press. [13] Tibshirani, R. 1996. Regression shrinkage and selection via the lasso. J. R. Statist. Soc. B, 58, 267–288.