Hindawi Publishing Corporation Advances in Decision Sciences Volume 2016, Article ID 8963214, 9 pages http://dx.doi.org/10.1155/2016/8963214
Research Article A Method of Assigning Weights Using a Ranking and Nonhierarchy Comparison Bangweon Song and Seokjoong Kang Department of Management of Technology for Defense, Korea University, Seoul 136-713, Republic of Korea Correspondence should be addressed to Seokjoong Kang;
[email protected] Received 4 September 2015; Accepted 6 April 2016 Academic Editor: Panos Pardalos Copyright © 2016 B. Song and S. Kang. This is an open access article distributed under the Creative Commons Attribution License, which permits unrestricted use, distribution, and reproduction in any medium, provided the original work is properly cited. The analytic hierarchy process (AHP) has advantages that the whole number of comparisons can be reduced via a hierarchy structure and the consistency of responses verified via a consistency ratio. However, at the same time, the AHP has disadvantages that values vary according to the form of hierarchy structure and it is difficult to maintain consistency itself among responses. If the number of comparisons can be reduced, a comparison within a single level is optimal, and if comparison can be made while the priority among entities is maintained, consistency may be automatically maintained. Thus, in this study, we propose a method of assigning weights, which applies hierarchy structure of AHP and pairwise comparison but complements the disadvantages of AHP. This method has advantages that the number of comparisons can be reduced and also consistency is automatically maintained via determination of priorities first on multiple entities and subsequent comparisons between entities with adjoined priorities.
1. Introduction Just like the quote, “life is full of choices,” we make numerous choices every moment in the real world. Among them, when the comparisons between alternatives for which the attributes are simple and the number of comparisons is small, priorities can be easily assigned, clear reasoning for the decision may be provided, and logical fallacies are also relatively very little. However, in the case of multiattributes or a high number of comparisons, people simplify the attributes or make a judgment by excluding part of them [1] or trade cognitive effort off against the accuracy of decision, which thereby lowers the accuracy of decision-making [2]. Since most of problems encountered in reality are complex with multiattributes, the decision-making methods to minimize errors in doing so have been the subject of many studies. The most well-known and simplest multicriteria decision-making method is the WSM (weighted sum model). If there are 𝑀 alternatives and 𝑁 criteria, then the best alternative is the one that satisfies the following expression: 𝑁
𝐴 WSM = max ∑𝑎𝑖𝑗 𝑤𝑗 , for 𝑖 = 1, 2, 3, . . . , 𝑀. 𝑗=1
(1)
𝐴 WSM is the WSM score of the best alternative, 𝑁 is the number of decision criteria, 𝑎𝑖𝑗 is the actual value of the 𝑖th alternative in terms of the 𝑗th criterion, and 𝑤𝑗 is the weight of the 𝑗th criterion. The corresponding 𝑎𝑖𝑗 values and the relative weights are assumed to be as follows: Criteria Alternatives 𝐶1
𝐶2
𝐶3 𝐶4
𝑊𝑗 𝐴1
0.1 10
0.2 20
0.3 0.4 10 30
𝐴2
20
30
10 10
𝐴3
30
10
20 10
(2)
When the formula is applied to the data, the score of the alternative 𝐴 1 is 20, 𝐴 2 = 15, and 𝐴 3 = 16. Therefore, the best alternative is alternative 𝐴 1 , and the ranking result of 𝐴 1 > 𝐴 3 > 𝐴 2 is derived. In addition to this, there are other ways such as the WPM (weighted product model), TOPSIS (the technique for order preference by similarity to ideal solution), AHP (analytic hierarchy process), and revised AHP methods.
2
Advances in Decision Sciences Goal
Criteria
Alternatives
Optimal attack helicopter
Technological advance
Logistic capability
Alternative 1
Armament
Alternative 2
Avionics
Subsist ability
Alternative 3
Figure 1: The structure model of evaluating three attack helicopters [12].
The weighted product model is similar to the weighted sum model. The main difference is that instead of addition in the model, there is multiplication. The TOPSIS method uses basic concept that the selected alternative should have the shortest distance from the ideal solution and the farthest distance from the negative-ideal solution in a geometrical sense. The analytical hierarchy process (AHP) decomposes multiple attributes into hierarchies or groups according to their entities and characters and compares them. Thus it has an effect of reducing cognitive errors and can confirm the respondent’s consistency with respect to the importance. One of the most widely used methods among them is the analytical hierarchy process [3]. Most of all, the AHP has an advantage that qualitative attributes can be quantified, which leads to its various applications in social, educational, political, and engineering areas [4]. However, the AHP has various weaknesses including ambiguous questions, fixed measurement scales, and varied results, depending on the form of hierarchy structure despite the attributes themselves being unchanged. Nevertheless, the AHP is widely applied as a comprehensive and systematic method to choose the best alternative under the limitations of time and resources, and various studies have been done to complement the weaknesses of it. However, among such numerous studies, a complementary study for the weaknesses of hierarchy structure is rare. If the hierarchy is not formed and pairwise comparison in a single level can be made, the problems caused by hierarchy structure may be easily solved, but the problem of difficulty in maintaining the consistency of decision-making accompanies pairwise comparison in a single level because of the excessive increase in the number of comparisons. Thus, in this study, we propose a method of assigning weights, which applies hierarchy structure of AHP and pairwise comparison but complements the disadvantages of AHP.
2. Background It is very difficult to choose between alternatives with multiple attributes in decision-making. In particular, the decision is more difficult when the data of the alternatives is uncertain, imprecise, and subjective [6]. The multiattributes decisionmaking methods are classified according to the type of the
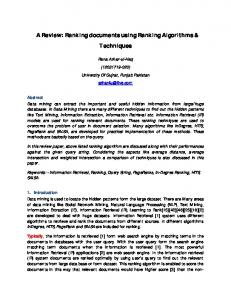
data they use, the number of decision-makers, and the type of information. As we classify the methods according to the type of the data, we have deterministic, stochastic, fuzzy multiattributes decision-making methods. We also classify single decision-making and group decision-making according to the number of decision-makers. Finally, we have WSM, WPM, AHP, revised AHP, and TOPSIS methods [7]. In the problem of multicriteria optimization, the most widely used method is the analytical hierarchy process (AHP), although various methods have been proposed, including multicriteria analysis [8], weighting method [9], and assigning weights using fuzzy pairwise comparison judgment [10]. The AHP is a technique that assigns priorities on each alternative by identifying the goals or the importance of attributes hierarchically [11]. Saaty criticized the introduction of various assumptions in order to simplify complicated decision-making tasks and argued that complicated problems had to be accepted as they were, and the hierarchical analysis of complicated relationship should be attempted. This is one of the multicriteria decision-making processes, which started in the study of operations, and a technique that utilizes a principle of “divide and conquer” on a problem [12]. The AHP minimizes cognitive errors by simplifying, partitioning, and comparing multiple attributes and, in particular, can make a comparison of not only quantitative indices but also qualitative indices. Thus, it is widely applied in a variety of areas including selection, evaluation, resource allocation, resolving conflicts, priority and ranking, and optimization. The general procedure of AHP is as follows. (1) A problem is stated and a goal is derived. (2) The criteria and subcriteria are identified by decomposing attributes required to achieve the goal. (3) The hierarchy structure is composed from the low to high levels on the basis of the criteria and subcriteria. Here, the hierarchy refers to a special form of a system, in which each element composing the system forms partitioned sets, according to its entities and characters. One set affects only one of other sets and is affected only by a different one of other sets. Each set is called a level. Figure 1 shows an example of forming a hierarchy structure after selecting 5 criteria, including a technological advance for the goal of a choice of an attack helicopter [13]. (4) Next, a matrix is created between sets of criteria and comparisons are made. In addition, weights are calculated by
Advances in Decision Sciences comparisons between alternatives for each criterion. Table 1 is an example of calculating weights among three alternatives for a technology advance. Comparisons are made by pairing two factors according to relative preferences of 1–9, as shown in Table 2, and since it is assumed that reciprocal condition is satisfied, when the number of alternatives is 𝑛, a total of 𝑛(𝑛 − 1)/2 comparisons are made. For instance, if Alternative 1 is three times as important as Alternative 2, it automatically means that Alternative 2 is 1/3 times as important as Alternative 1, and, subsequently, an additional comparison is omitted. (5) Finally, the consistency ratio (CR) is calculated in order to verify the consistency of responses. The CR value uses a priority vector, and Saaty emphasized that the reliability of the responses could be maintained only when the consistency ratio is 0.10 or less. Since the calculation of weights and CR values by a matrix can be found in many papers on AHP [14], they will not be discussed in this study, and, with the recent introduction of professional commercial software (e.g., Expert Choice), those calculations can be easily performed. The AHP makes the following four assumptions. First is the reciprocal. When the two factors are paired and compared, the value of preference should satisfy the reciprocal condition. For instance, if 𝐴 is 𝑥 times as important as 𝐵, 𝐵 is 1/𝑥 times as important as 𝐴 or vice versa. Second is homogeneity. The importance is represented by a bounded scale within a limited range. Third is dependency. Elements at a level should be dependent on those at an upper level. The fourth, and last, assumption is expectations. This assumes that the purposes of decision-making are completely included in the corresponding level. However, the AHP shows the following weaknesses in its actual application. First of all, when new entities for comparison are added to the AHP, the priorities may be altered [15]. For instance, if the priorities are decided by the comparison of A, B, and C, the importance values of A, B, and C should be maintained, even if D is added for comparison, but since priorities among A, B, and C are changed due to the addition of D, hence the reliability of the result is lowered. Second, since the importance value of a particular level in a hierarchy structure is composed of the sum of the importance values of many sublevels, if the importance value of the upper level is incorrectly calculated, those of its sublevels will have more severe errors [16]. In other words, it is assumed that the elements in the sublevels are dependent on those in the upper level in AHP, and if the hierarchy structure does not satisfy this assumption, then errors will be generated in the result. Third, since comparisons in AHP are made only using the scale of integers 1–9 and their reciprocal numbers, the proportionality between the importance values of factors is not always satisfied. For instance, when A is moderately preferred to B, and thus 3 : 1 preference is assigned, the weights are 0.73 : 0.25, which is an overestimation. In other words, there is an inconsistency between weights by the AHP and subjective weights. Finally, in AHP, a CR value is suggested to maintain the consistency of responses, but the result is reliable only when the value is 0.1 or less. However, if the number of entities to compare is increasing, it is difficult
3 Table 1: Example of pairwise comparison matrix for the criteria. Technological advance
Alternative 1 Alternative 2 Alternative 3 Weight
Alternative 1
1
3
7
0.643
Alternative 2
1/3
1
5
0.283
Alternative 3
1/7
1/5
1
0.074
𝜆max = 3.066. Consistency ratio (CR) = 0.056.
Table 2: Pairwise comparison scale for AHP preferences [5]. Numerical rating
Verbal judgements of preferences
9
Extremely preferred
8
Very strongly to extremely
7
Very strongly preferred
6
Strongly to very strongly
5
Strongly preferred
4
Moderately to strongly
3
Moderately preferred
2
Equally to moderately
1
Equally preferred
to keep the CR value within 0.1. Since priorities are used for the CR value, in some practices priorities among entities are predetermined before comparisons are made, in order to satisfy the CR value of less than 0.1. Various studies to complement the weaknesses of the AHP have been conducted. A study to enhance the consistency ratio on the result was conducted to address a problem of the difficulty in maintaining the CR value [17], while a linguistic variable weight method was proposed to complement the ambiguity of pairwise comparison questions. These were among the studies to complement the weaknesses in the application of the AHP. Also, improvements to complement the AHP itself have been proposed, all of which have combined AHP and fuzzy theory, including a fuzzy AHP, a fuzzy extent analysis method [18], a study to complement the criteria problem that the 0 weight had in fuzzy extent analysis method [19], a goal programming-AHP model to solve fuzzy problems [20], and the application of a fuzzy AHP to a government sponsored R&D project [21]. However, studies on the problem caused by the hierarchy structure itself are rare, and thus this study is focused on such a problem. The problem caused by the hierarchy structure can be easily understood via the following example. Figure 2 shows a part of the assessment criteria for a proposal of weapon system research and development that the Defense Acquisition Program Administration (DAPA, Korea) applies to select a development company. Two types of hierarchies were composed using 10 identical attributes. Type A was composed to have a criterion “make-up plan for lack of technology” as a subattribute of a criterion “development
4
Advances in Decision Sciences
Type A
Type B
Company selection
Development plan
Management plan
Company ability
Company selection
Development plan
Management plan
Company ability
HW/SW
Schedule
Technology
HW/SW
Schedule
Technology
Test and evaluation
Cost
Facility
Test and evaluation
Cost
Facility
Domestic
Quality
Experience R&D
Domestic
Quality
Experience R&D
Make-up plan for lack of tech.
Make-up plan for lack of tech.
Figure 2: Two-type hierarchy for a company selection.
plan” while it was a subattribute of a criterion “company ability” in Type B. The reason for these configurations is that if the attribute, “lack of technology,” informs a make-up plan for the technology that is lacking, then this will become a subattribute of “development plan,” but if it means the current status that the technology is lacking, then this attribute may be a subattribute of “company ability.” Thirty staff members who have had experiences in project management were asked to calculate the weights for each assessment criterion using these two different hierarchy structures, for which the consistency ratio was set to be 0.1 or less. The results are shown in Table 3. In Table 3, if the criterion, “make-up plan,” is placed under “development plan” and compared, its weight is 0.032. However, if it is under the criterion, “company ability,” and compared, its weight is changed to 0.047. Also, its priority falls from 7th out of a total of 10 criteria in Type A to 9th in Type B, and the priorities of 5 criteria out of 10 are changed. This happens since the weights are changed by the relative importance in case the entities for comparisons are varied within the same group. If weights are changed depending on how the criteria are grouped, even though the attributes of the criterion itself or the entire criteria for comparisons do not change, these weights cannot be deemed reasonable. Next, since the weight of an upper level affects its sublevels in AHP, the weight of the upper level needs to be calculated in consideration of all the attributes of its sublevels. However, it can be seen that regardless of whether the attribute “makeup plan” belongs to either the sublevel of “development plan” or that of “company ability,” the calculated weights at Lv. 2 are not substantially different (see Table 3). Just as in this case, if an upper level does not take the attributes of its sublevels into consideration, then reliability cannot be guaranteed for the total weight of subattributes that is obtained by the multiplication of weights of each level. In other words, this shows that the AHP has a weakness in hierarchy structure. Since the participants in this AHP were staff with experience in research and development project
management, they clearly understood the meaning of each criterion. Moreover, it is safe to hypothesize that they had a high understanding of the AHP since they had practiced the AHP several times during the course of their work. However, if weights are changed according to the number of objects to compare and the changes in comparison criteria depending on hierarchy structure and grouping even though attributes are not changed, the reliability of weights by AHP will be lowered and eventually the reliability of the decision-making based on that AHP will not be acknowledged. As seen in the aforementioned example, the problem of a hierarchy structure is that values are varied depending on how the attributes are grouped, and the values of subattributes are changed depending on that of their upper attribute. If levels are not divided, and the entire attributes in the sublevel are compared pairwise, then the problem will be easily solved. In other words, if the entire 10 attributes (Figure 2) are compared simultaneously, the problem caused by hierarchy structure can be solved. However, Saaty suggested that the entities for comparison in the AHP should not exceed 9 since the number of comparisons that a person can make and draw a judgment from without fault was 7 ± 2, which was based on Miller’s psychological experiment [22], and thus as the number of comparisons is increasing, it becomes extremely difficult to maintain the CR value within 0.1. Since the determination of CR value is based on priority vectors, it is possible to maintain consistency between comparisons if the priority is predetermined while the determination of priority itself is impossible if the number of entities for comparison is increasing. Also, as the number of comparisons becomes 10 C2 = 45, an excessive number of comparisons are required. Hence, if the consistency is maintained and the number of comparisons can be reduced while pairwise comparison is made within the same level, the problem caused by the hierarchy structure of AHP can be solved. Thus, in this study, we propose a method that predetermines the priorities in order to maintain consistency and can assign weights and reduce the number of comparisons.
Advances in Decision Sciences
5
Table 3: The results for the 2-type AHP. (a) Type A
Lv. 2
Development plan 0.567
Management plan 0.108
Company ability 0.325
Lv. 3
Total weight
Rank
HW/SW
0.558
0.316
1
T&E
0.263
0.149
3
Domestic
0.122
0.069
5
Make-up plan
0.057
0.032
7
Schedule
0.074
0.008
10
Cost
0.643
0.069
4
Quality
0.283
0.031
8
Technology
0.193
0.063
6
Facility
0.083
0.027
9
Experience
0.724
0.235
2
Total weight
Rank
(b) Type B
Lv. 2
Development plan 0.587
Management plan 0.101
Company ability 0.312
Lv. 3 HW/SW
0.724
0.425
1
T&E
0.193
0.113
3
Domestic
0.083
0.049
6
Schedule
0.074
0.007
10
Cost
0.643
0.065
5
Quality
0.283
0.029
8
Technology
0.275
0.086
4
Facility
0.138
0.043
7
Experience
0.540
0.168
2
Make-up plan
0.047
0.015
9
Step 2 (setting priorities of entities within each group). After creating a hierarchy, entities included in groups I, II, and II are given priorities. Since the number of cases, for which a human can make a comparison and judgment simultaneously without fault, is seven plus or minus two as the magical number (as proposed by Miller [22]), the number of comparisons of entities is proposed not to exceed 9 as in the AHP. Figure 4 shows an example of the determination of the priority between entities within the respective groups I, II, and III, in which the higher priority is given in the alphabetical order for convenience, and the starting point of an arrow indicates a higher priority. Step 3 (setting a priority between the entities with the same priority from the different groups). After giving priorities to entities in the same group, a priority between the entities with the same priority from the different groups is determined. Thus, A, D, and G with the highest priority in groups I, II, and III, respectively, are compared and priorities are given between them. The same practice is repeated for the entities with the second and third priorities from each group, respectively. Figure 5 shows a hypothetical situation that the comparison of the highest priority entities from each group yielded the priority of D > G > A, that of the second priority entities was H > B > E, and that of the third priority entities was I > F > C. Step 4 (setting a priority between the entities with adjoined priorities). In Figure 5, entities directly compared are connected by arrows, indicating priorities, and higher priority entities are arranged from left to right. If any one entity is connected to the entities spatially adjoined on its left or right, it can be stated that the priorities between entities are confirmed via a direct comparison. Then, additional comparisons between the spatially adjoined entities that are not directly connected are made. Thus, in Figure 5, the direction of arrows between A and H and E and I should be determined. Additional comparisons between adjoined entities are iterated until the following criterion is satisfied. Criterion. All the entities should be connected to all the adjoined entities on their left or right via a direct arrow.
3. Ranking and Nonhierarchy Comparison 3.1. Determination of Priorities. In case that the number of attributes is increasing, the determination of priorities without fault is nearly impossible. Thus, in AHP, many attributes are decomposed to hierarchical levels and compared to reduce cognitive errors and the number of comparisons. In this study, we propose a method to determine priorities of multiple attributes by applying hierarchy structure such as in AHP. A case of 9 entities from A to I was taken as an example of this study. Step 1 (hierarchical structuring). The first step to determine priority is to create a hierarchy using attributes and entities, likewise in the AHP. Figure 3 shows an example of a hierarchy in the case containing 2 levels and 9 entities.
For example, in Figure 6(a), the unconnected A and H were compared to yield A → H, and likewise in (b), E and I were compared to give I → E. Thus, as the lateral positions of I and E were changed, an additional comparison between B and I was needed, as in (c), and the priority was determined to be B → I. Finally, C → E was determined via a comparison between the unconnected C and E, as in (c), resulting in the full determination of priority between a total of 9 entities, which gave D → G → A → H → B → I → C → E → F. This method is based on the logic that if A is more important than B and B is more important than C, A is logically more important than C. Thus, one can assign logical priorities to multiple entities by a relatively small number of comparisons via (1) decomposing multiple attributes using hierarchy structure and then, for entities in the lowest level, (2) comparing the entities within the same group, (3)
6
Advances in Decision Sciences
Goal
Level 1 (attributes)
I
Level 2 (entities)
A
II
B
C
D
E
III
F
G
H
I
Figure 3: Hierarchy structure example (Step 1).
Priority
High
Low
Group I
A
B
C
Group II
D
E
F
Group III
G
H
I
1
2
3
Figure 4: Priority in the entities of each group (Step 2). Priority
High A
Group I Group II
F
E G
1
C
B
D
Group III
Low
2
H 3
4
I 5
6
7
8
9
Figure 5: Priority in equally ranked entities of each group.
comparing the entities of the same priority between different groups, and (4) comparing the entities of adjoined priorities that have not been compared. 3.2. Assigning Weights. Once the priority of the entire entities is determined, the weight for each attribute is assigned. If a pairwise comparison is applied to a total of 9 entities, a total of 9 C2 = 36 pairwise comparisons are needed, and thus it will be difficult to maintain the consistency because of the high number of comparisons. The reason is that it is not trivial to maintain the relative priorities between 9 entities in a total of 36 comparisons since the consistency of the AHP utilizes the priority vector. However, in this study, since the priority is determined in the preceding step, if weights are assigned while this priority is kept unchanged, the consistency is consequently maintained. Thus, comparisons were made between entities of adjoined priorities while the priority was maintained. In this pairwise comparison, the entity with a higher priority is
given a score of 10 points and that with a lower priority in turn is given a lower relative score. The reason that an entity with a higher priority is given 10 points for comparison is to minimize the cognitive gap between comparisons as well as widen the selection of scores by ensuring that the reference point in all comparisons is identical. After determining the relative importance values of the entities from the highest to the lowest priorities, the score range of the entire entities is set by considering the relative importance difference between the highest priority entity and the lowest priority entity. If the score range is not set, then the score of the entity with the lowest importance will be only close to 0, due to its low priority, irrespective of its absolute importance. To avoid this issue, a correction is needed via setting the range between the highest and lowest values. Eventually, this is to measure the relative gaps via comparisons between entities and to quantify these gaps within the range of the highest and lowest values. Table 4 shows an example that entities with determined priorities are given relative scores by pairwise comparisons between the entities with adjoined priorities. In (a), when D with the highest priority is given 10, G has an importance of 8. In the next comparison, G is given a score of 10, and in turn A is given a relative importance of 4. In this way, after the relative scores of all entities in pairwise comparisons are measured, these scores of all entities are converted into the relative importance referenced to the score of 10 for the entity with the highest priority, as seen in (b). Then, in (c), the score range of the entire entities is set by measuring the relative importance between the highest priority entity and the lowest priority entity. Next, the importance values of each entity obtained in (b) are converted into the relative values within the range between 6 and 10 set in (c). Consequently, the score of F that was 0.36 in (b) is now converted to 6, and the intermediate entities, G–E, will have relative scores within the range of 6 to 10. Finally, if the sum of all these converted values is set to be 1, and the values are further converted accordingly, the weights are obtained as in (e). 3.3. Verification of Reliability. Heretofore, we have proposed a method to assign weights, as well as maintain consistency while reducing the number of comparisons, by applying a hierarchy structure and consistency ratio to the AHP. In order to verify whether this method is valid, the priority correlations of the same entity were analyzed with three different methods.
Advances in Decision Sciences
7 Priority
High A
Group I Group II
B
D
Group III
2
H 3
4
6
F
7
A
Group I Group II
8
9
C
E
G 1
Low
B
D
Group III
I 5
Priority
High
C
E
G 1
Low
2
H 3
4
F
I 5
6
7
8
9
(a)
Priority
High A
Group I Group II
B
D
Group III
2
H 3
4
6
Group II
F
7
A
Group I
8
B
C
E
G 1
9
Low
D
Group III
I 5
Priority
High
C
E
G 1
Low
2
H 3
4
F
I 5
6
7
8
9
(b)
Priority
High A
Group I Group II
Low
B
C
D
Group III
E
G 1
2
H 3
4
6
A
Group I F
Group II
7
8
B
C
E
G 1
9
Low
D
Group III
I 5
Priority
High
2
H 3
4
F
I 5
6
7
8
9
(c)
Priority
High A
Group I
Low
B
C
Group II D Group III
E
G 1
2
H 3
4
6
A
Group I F
Group II
7
8
G 1
9
Low
B
C
D
Group III
I 5
Priority
High
2
H 3
4
E
F
8
9
I 5
6
7
(d)
Figure 6: The comparison process between adjoined entities.
Method 1: measuring with the 10-point Likert scale and calculating weights by converting the Likert scores into values, of which the sum is 1. Method 2: calculating the weights with the AHP (2 levels). Method 3: calculating the weights after assigning priorities (proposed in this study). The number of measured entities is 9, which are used for the assessment of proposals of weapon system research and development project, including HW/SW development
plan, test assessment plan, localization plan, scheduling plan, expense management plan, quality control plan, the status of technologies in possession, the status of facilities in possession, and similar development achievements. The participants in the survey were 30 staff members who had experience in assessing companies using these entities and applying the AHP. The survey was conducted via one-on-one interviews, and the purpose and method of the survey were described in detail to the participants who were then asked to respond with respect to all three methods. The participants had sufficient understanding of the assessment entities since
8
Advances in Decision Sciences Table 4: Example of result for the comparison between adjoined entities.
Rank
1
2
3
4
5
6
7
8
9
Entities
D
G
A
H
B
I
C
E
F
10
8
(a) Result D:G G:A
10
A:H
4 10
H:B
9 10
7
B:I
10
I:C
10 10
9
C:E
10
5
E:F (b) Score ratio
10.00
8.00
3.20
2.88
2.02
2.02
1.81
10
4
0.91
0.36
(c) Score bound
10
6
(d) Conversion
10.0
9.17
7.18
7.04
6.69
6.69
6.60
6.23
6.00
(e) Weight
0.152
0.140
0.109
0.107
0.102
0.102
0.101
0.095
0.091
they have already had experience in the assessment, research, and development. In the comparison by the AHP, which is Method 2 in the survey, immediately after a response a participant was apprised of the consistency ratio, and then a participant was asked to iterate a pairwise comparison until the consistency ratio became less than 0.1. Also, since the scores were absolute scores (by the Likert scale for the survey results), these were converted to the values, of which the total sum is 1, hence yielding weights in order to determine the relative importance. These weights obtained by the above method were processed by SPSS software to give the Pearson product moment correlation coefficient and Spearman rank-correlation coefficient, which are presented in Tables 5 and 6. The Pearson product moment correlation coefficient of Likert scale is 0.506 with the AHP, but 0.631 with the proposed method, which indicates that the latter reflects the subjective absolute value of each entity relatively better than the AHP (Table 5). In addition, while the Spearman rank-correlation coefficient of the Likert scale is shown to be 0.580 with the AHP, it is 0.787 with the proposed method, which strongly suggests that the proposed method is also superior to the AHP in reflecting the ranking (Table 6). In conclusion, these results showed that the proposed method in this study reflects the importance and priority of each entity, similar to or better than the AHP.
4. Conclusion The AHP has the advantages of reducing the number of comparisons and cognitive errors and confirming the response consistency by comparing objects with multiple attributes, upon hierarchical structuring and grouping according to
Table 5: The result for Pearson’s correlation coefficient. Pearson’s correlation coefficient
Likert
AHP
Proposed
Likert scale
1.000
.506∗∗
.631∗∗
AHP
.506∗∗
1.000
.511∗∗
Proposed
.631∗∗
.511∗∗
1.000
∗∗
Significance level: 0.01.
Table 6: The result for Spearman’s rank-correlation coefficient. Spearman’s rank-correlation coefficient
Likert
AHP
Proposed
Likert scale
1.000
.580∗∗
.787∗∗
AHP
.580∗∗
1.000
.613∗∗
Proposed
.787∗∗
.613∗∗
1.000
∗∗
Significance level: 0.01.
their entities and characters. However, at the same time, the AHP has the disadvantages that values are varied depending on the shape of the hierarchy structure, as well as the difficulty in maintaining consistency. Thus, we were prompted to devise a method to address those disadvantages. If the hierarchy is not created and multiple attributes can be compared at a time, those problems may be easily resolved. However, in that case, the number of comparisons is increased exponentially, and it is extremely difficult to maintain the response consistency. Thus, in this study, we proposed a method to first determine
Advances in Decision Sciences the priority in order to maintain consistency and calculate weights while reducing the number of comparisons. First of all, the priorities of multiple entities could be logically determined by a relatively small number of comparisons via first decomposing multiple attributes using a hierarchy structure as in the AHP and next, only for entities at the lowest level, comparing the entities within the group, then entities with the same priority from different groups, and finally the entities with adjoined priorities that have not been compared. Next, the weights were calculated via comparisons between the adjoined entities while the priority is maintained. The method is as follows. First, the entity with a higher priority is given a score of 10 and the entity with an adjoined lower priority is given a lower relative score. Second, a score range for all entities is determined by giving a relative score to the entity with the lowest priority when the entity with the highest priority has a score of 10. Third, the weight of each entity is determined by converting the importance value of each entity into the relative value within the determined score range. Finally, in order to verify how well these obtained results reflected the absolute importance and priority of the entities, they were compared with those of the AHP, of which the consistency was maintained well within 0.1. Therefore, it was confirmed that the method proposed in this study is relatively superior to the AHP in reflecting the absolute importance and priority of each entity. In conclusion, this study discusses the hierarchy and consistency issues of AHP that were not in the previous study and proposes the new method that does not have a disadvantage that the weights are varied according to the hierarchy structure. The method proposed can be readily utilized using simple tools such as MS Excel or a calculator owing to its simplicity in the procedure and formulas. Thus, it is expected that this proposed method can be applied in various areas that require the assignment of weights. Further study is also needed on how to determine the score range of the entire entities and the relative importance between entities of adjoined priorities.
Competing Interests The authors declare that there is no conflict of interests regarding the publication of this paper.
References [1] J. W. Payne, “Task complexity and contingent processing in decision making: an information search and protocol analysis,” Organizational Behavior and Human Performance, vol. 16, no. 2, pp. 366–387, 1976. [2] J. W. Payne, J. R. Bettman, and E. J. Johnson, “Reasonbased choice. Special issue: reasoning and decision making,” Cognition, vol. 49, no. 1-2, pp. 11–36, 1993. [3] T. L. Saaty, Analytic Hierarchy Process, McGraw-Hill, New York, NY, USA, 1980. [4] O. S. Vaidya and S. Kummar, “Analytic hierarchy process: an overview of application,” European Journal of Operational Research, vol. 186, pp. 735–747, 2006.
9 [5] K. M. Al-Subhi Al-Harbi, “Application of the AHP in project management,” International Journal of Project Management, vol. 19, no. 1, pp. 19–27, 2001. [6] C.-H. Yeh, H. Deng, and H. Pan, “Multi-criteria analysis for dredger dispatching under uncertainty,” Journal of the Operational Research Society, vol. 50, no. 1, pp. 35–43, 1999. [7] E. Triantaphyllou, B. Shu, S. Nieto Sanchez, and T. Ray, “Multicriteria decision making: an operations research approach,” in Encyclopedia of Electrical and Electronics Engineering, vol. 15, pp. 175–186, John Wiley & Sons, New York, NY, USA, 1998. [8] H. Deng, “Multicriteria analysis with fuzzy pairwise comparison,” International Journal of Approximate Reasoning, vol. 21, no. 3, pp. 215–231, 1999. [9] W. Zhang and H. Yang, “A study of the weighting method for a certain type of multicriteria optimization problem,” Computers & Structures, vol. 79, no. 31, pp. 2741–2749, 2001. [10] L. Mikhailov, “Deriving priorities from fuzzy pairwise comparison judgements,” Fuzzy Sets and Systems, vol. 134, no. 3, pp. 365– 385, 2003. [11] T. L. Saaty and L. G. Vargas, The Logic Priorities, Springer, Dordrecht, The Netherlands, 1982. [12] Y.-J. Kim and J.-S. Shim, “A comparison of weight elicitation techniques: focusing on AHP, JA, and SW,” National Policy Research, vol. 21, no. 1, pp. 5–33, 2007. [13] C.-H. Cheng, K.-L. Yang, and C.-L. Hwang, “Evaluating attack Helicopters by AHP based on linguistic variable weight,” European Journal of Operational Research, vol. 116, no. 2, pp. 423–435, 1999. [14] T. L. Saaty, “Decision-making with the AHP: why is the principal eigenvector necessary,” European Journal of Operational Research, vol. 145, no. 1, pp. 85–91, 2003. [15] V. Belton and T. Gear, “On a short-coming of Saaty’s method of analytic hierarchies,” Omega, vol. 11, no. 3, pp. 228–230, 1983. [16] B. J. Epstein and W. R. King, “An experimental study of the value of information,” Omega, vol. 10, no. 3, pp. 249–258, 1982. [17] S. Lipovetsky and W. Michael Conklin, “Robust estimation of priorities in the AHP,” European Journal of Operational Research, vol. 137, no. 1, pp. 110–122, 2002. [18] D.-Y. Chang, “Applications of the extent analysis method on fuzzy AHP,” European Journal of Operational Research, vol. 95, no. 3, pp. 649–655, 1996. [19] Y.-M. Wang, Y. Luo, and Z. Hua, “On the extent analysis method for fuzzy AHP and its applications,” European Journal of Operational Research, vol. 186, no. 2, pp. 735–747, 2008. [20] C.-S. Yu, “A GP-AHP method for solving group decisionmaking fuzzy AHP problems,” Computers & Operations Research, vol. 29, no. 14, pp. 1969–2001, 2002. [21] C.-C. Huang, P.-Y. Chu, and Y.-H. Chiang, “A fuzzy AHP application in government-sponsored R&D project selection,” Omega, vol. 36, no. 6, pp. 1038–1052, 2008. [22] G. A. Miller, “The magical number seven, plus or minus two: some limits on our capacity for processing information,” Psychological Review, vol. 63, no. 2, pp. 81–97, 1956.
Advances in
Operations Research Hindawi Publishing Corporation http://www.hindawi.com
Volume 2014
Advances in
Decision Sciences Hindawi Publishing Corporation http://www.hindawi.com
Volume 2014
Journal of
Applied Mathematics
Algebra
Hindawi Publishing Corporation http://www.hindawi.com
Hindawi Publishing Corporation http://www.hindawi.com
Volume 2014
Journal of
Probability and Statistics Volume 2014
The Scientific World Journal Hindawi Publishing Corporation http://www.hindawi.com
Hindawi Publishing Corporation http://www.hindawi.com
Volume 2014
International Journal of
Differential Equations Hindawi Publishing Corporation http://www.hindawi.com
Volume 2014
Volume 2014
Submit your manuscripts at http://www.hindawi.com International Journal of
Advances in
Combinatorics Hindawi Publishing Corporation http://www.hindawi.com
Mathematical Physics Hindawi Publishing Corporation http://www.hindawi.com
Volume 2014
Journal of
Complex Analysis Hindawi Publishing Corporation http://www.hindawi.com
Volume 2014
International Journal of Mathematics and Mathematical Sciences
Mathematical Problems in Engineering
Journal of
Mathematics Hindawi Publishing Corporation http://www.hindawi.com
Volume 2014
Hindawi Publishing Corporation http://www.hindawi.com
Volume 2014
Volume 2014
Hindawi Publishing Corporation http://www.hindawi.com
Volume 2014
Discrete Mathematics
Journal of
Volume 2014
Hindawi Publishing Corporation http://www.hindawi.com
Discrete Dynamics in Nature and Society
Journal of
Function Spaces Hindawi Publishing Corporation http://www.hindawi.com
Abstract and Applied Analysis
Volume 2014
Hindawi Publishing Corporation http://www.hindawi.com
Volume 2014
Hindawi Publishing Corporation http://www.hindawi.com
Volume 2014
International Journal of
Journal of
Stochastic Analysis
Optimization
Hindawi Publishing Corporation http://www.hindawi.com
Hindawi Publishing Corporation http://www.hindawi.com
Volume 2014
Volume 2014